
Abstract
This article aims to analyze the correlation status and development trend among science, technology and industry in the Artificial Intelligence (AI) subfield. First, it constructs the classification system and retrieval strategy for the AI subfield, and performs data cleaning and data finishing. Second, it designs the criteria and judgment method of the Industry Development Stages (IDS) in the AI subfield with the Delphi survey method. Third, it designs the monitoring method and model of the Science-Technology-Industry (STI) correlation with the methods of scientometrics and clustering, which involves three dimensions: science and IDS, technology and IDS, science & technology clustering and IDS; especially the monitoring with the global and national perspectives. Finally, it conducts empirical application in the field of neural network. The results illustrate that the correlation monitoring method can be conducive to grasp accurately the development opportunity and trend, the advantage subfield, and the development status of Science and Technology (S&T) for the dominant countries. The United States leads the global development in the empirical field. The proposed correlation monitoring method in this article can also be applied in other fields.
Introduction
The AI technologies have always been an important link in S&T development and economic decision-making around the world (Cath, 2018). Major S&T powers have formulated national development strategies related to AI, such as the Executive Order on Maintaining American Leadership in AI (2019), the European Commission’s High-Level Expert Group On AI, Made in China 2025 and the Notice of the State Council on Issuing the Development Plan on the New Generation AI (China), and the Super Intelligent Society 5.0 Strategy (Japan), etc. And then, it is one of the urgent tasks for the decision makers of the governments or enterprises to choose the appropriate technologies (Kaebnick et al., 2016; Schweizer et al., 2020), capture the industrial high-end market, and promote the industrial development in the AI field (Abbas et al., 2019; Sun et al., 2017). Exploring and discovering the STI development trends in the AI field is the methodological basis of this task (Jiang et al., 2020; Neelam & Sood, 2021). For monitoring the STI development trend in a certain field, the existing studies have three problems: (a) They are mostly conducted from the perspective of one or two of the STI. There are few studies that integrate the STI together, which is not conducive to grasping the overall development status and trend of the STI (García Manjón et al., 2016). (b) Most of them focus on the general level of the field, and there are few related studies on focusing the subfields, which is not conducive to accurately grasp the differences of the subfields. (c) Effective monitoring methods are even rarer when focusing on the STI correlation and the subfields. Obviously, comprehensively exploring the STI correlation monitoring method in the AI subfields is more conducive to choosing the correct and appropriate AI technologies, and grasping (Lu et al., 2012) the commanding heights of the innovation and development in the AI industry (Vo-Thai et al., 2021).
The above problems lead to four tasks to be solved: (a) How to divide the boundary of AI technology, that is, the classification system? which is a prerequisite for grasping and analyzing the STI correlation in the AI field. (b) How to select appropriate data to characterize the STI correlation in the AI field respectively? (c) How to design the index system, and quantitative method and model to reveal the development trend of the STI correlation in the AI field? (d) Based on the perspective of combinatorial mathematics, there are many relationships of the STI. How to select appropriate dimensions to realize the STI correlation analysis? These problems are worthy of in-depth discussion.
It is a particularly important issue to reveal the STI correlation analysis in the AI field with an effective method, focusing the overall STI and the subfields, so as to facilitate decision-makers to grasp the development status and trends.
Literature Review
This article introduces the literature from four aspects: construction of the AI classification system, division and judgment of the AI industry development stage, monitoring dimension and indexes of the STI correlation, and monitoring method of the STI correlation.
Construction of the AI Classification System
The research on the STI correlation depends on the correct S&T classification (Chowdhury et al., 2020). This article reviews the AI classification from the perspective of discipline, technology and industry.
(a) Discipline Perspective. So far, the AI classification has not been included in the various discipline classifications as a complete discipline. The AI was defined as a branch of computer science in the arXiv system (Cornell University, 2019). In the Computing Classification System (CCS) 2012 (Association for Computing Machinery, 2012) released in 2012, AI was listed as a new discipline of the secondary discipline for computer methodology (K.3). Based on the keyword co-occurrence clustering analysis of the academic publications, (Elsevier, 2018) found that the AI vocabularies clustered into seven fields. The debate on the S&T competition pattern of G20 countries (special issue on AI) divided the knowledge system of AI discipline into four aspects (Zhu et al., 2018).
(b) Technology Perspective. The definition of the existing AI technology classification system mainly appeared in the reports of research institutions (see Annex B). Most of them divided AI technology into the basic infrastructure technologies and the key technologies, such as the Debate on the pattern of science and technology competition in G20 countries (Zhu et al., 2018), the report of McKinsey & Company (Bughin et al., 2018), the AI Index 2019 Annual Report (Stanford Human-centered Artificial Intelligence, 2019), and the AI Standardization White Paper (China Institute of Electronic Technology Standardization, 2018).
(c) Industry Perspective. The Three Years Action Plan for Promoting Industry Development of the New Generation AI Industry (2018–2020) (Ministry of Industry and Information Technology of China, 2017) put forward the vertical applications as the AI industry classifications. The 2018 World AI Industry on Development Blue Book (Gartner, China Academy of Information and Communications, 2018) divided the application layer of the AI industry into “AI+” and typical products. The State of AI Report 2019 (Nathan & Ian, 2019) analyzed four AI industries: intelligent infrastructure, intelligent information and data, intelligent technology services and intelligent products. The China AI Development Report (China Institute of Science and Technology Policy at Tsinghua University, 2018) analyzed four AI industries: intelligent robots, intelligent driving, UAVs (Unmanned Aerial Vehicles) and AI+.
It can be seen from the above that there is no unified classification standard for the science, the technology and the industry in the AI field. The AI classification in the CCS 2012 is the most systematic, but it needs to be updated and improved according to the latest discipline development. The technology classifications of the AI subfields need to be further reorganized based on the various research reports. The AI industry classifications lie to the application scenarios and emphases so that they are difficult to be unified.
Division and Judgment of the AI Industry Development Stages
Since this article focuses on the industrial development of the AI subfields, this paper will not discuss and analyze the definition of the development stage of the overall AI industry. A large number of studies have defined the development stages of the AI industry, mainly including the following two categories.
(a) Specific subfields. (Thandil & Basheer, 2020) divided the development of speech recognition technology into four stages: the embryonic stage (1985–1993), the rapid development stage (1993–2001), the mature stage (2001–2007), and the commercial application stage (since 2007). (Zhou, 2018) divided the development stage of machine learning into the shallow learning stage (1943–2006), the deep learning stage (2006–2011), and the outbreak stage (since 2012). (Padhy & Patra, 2012) divided the development stage of cloud computing into three stages: the market introduction stage (2006–2011), the market integration stage (2012–2015), and the technology maturity and popularization stage (since 2015).
(b) Technology set. The AI Hype Cycle Curve (HCC) proposed by Gartner showed the AI technologies in different development stages in a fixed form curve. (Gartner, 2018) analyzes 35 AI technologies, which are respectively distributed in the five development stages of the HCC: innovation trigger, peak of inflated expectations, slope of enlightenment, and plateau of productivity. (CPA Global of Clarivate et al, 2018) proposed that deep learning technology was in the mature stage; computer vision technology and voice interaction technology were still in the early application stage; and text processing was still in the technological climbing stage.
To sum up, the previous division of AI industry development stage mostly focused on a specific subfield or a non-systematical set. The five stages of the HCC were fixed, which can not reveal the industry development history of a single technology.
Monitoring Dimensions and Indexes of the STI Correlation
There are two types of relationship among science, technology and industry: one is pair wise, and the other is all three together, that is, involving four dimensions which will be used to analyze the STI correlation.
(a) Correlation of Science and Technology. The existing correlation research of science and technology is mainly with three perspectives. (i) Based on the non-patent citation data, the relationship between the science and technology can be used to quantify (Minin et al., 2017), the concept of the S&T correlation cycle was proposed (Han & Magee, 2018), the inventor publishing high-level academic papers played important roles in the S&T correlation (van Raan, 2017). (ii) Reverse citation network can be used to analyze the knowledge flow from technology to science (Gui et al., 2019). (Lepori et al., 2016; Panagiotakos & Bersimis, 2014) designed the fusion algorithm of “science correlation” measurement index and feedback coefficient. (iii) By calculating the mutual citation of patents and papers, the Natural Publishing Group studied the S&T correlation relationship (Takano & Kajikawa, 2019), found that science and technology emerges the trends of the convergence and integration (Huang et al., 2015).
(b) Correlation of Science and Industry. (Hidayatno et al., 2019) proposed the index of Non-Patent Literature (NPL) to measure the correlation of industry and science. (Li et al., 2017; Zhang & Lei, 2015) further put forward the optimization correlation index of industry and science. The correlation intensity of the industry-university-institute cooperation in the science-based industry is low, but its innovation quality is higher (Lepori et al., 2016).
(c) Correlation of Technology and Industry (Kirchberger & Pohl, 2016) thought that the technology transfers is the most direct way for the correlation of technology and industry, and its essence is the industrialization and commercialization process of Scientific and Technological Achievement (STA) (He, 2011). (Dorner & Harhoff, 2018) analyzed the correlation of technology and industry from the perspective of patent applications and invention patents. (Daim & Oliver, 2008) studied the relationship of key technologies and industry development model. (Li & Jiang, 2013) analyzed the impact of the industry-university-institute cooperation in the industrialization process in the cloud computing field.
(d) Correlation of STI. The most direct STI correlation is the STA transformation(Zlyvko et al., 2014), which is also a comprehensive system of science, technology, production, and trade (Dorner & Harhoff, 2018; Li & Zhang, 2021). Based on data of research literatures, patents, products, markets, and industries, (Jeong & Yoon, 2017) analyzed the industry competition situation and development trend. (Wang et al., 2020) revealed the correlation and transformation process of the fund-paper-patent-drug with the retrospective analysis method. (YuSheng & Ibrahim, 2020) studied the relationship of the time and key nodes in the process of industry development. (University of Chinese Academy of Sciences, Dong, 2018) studied the quantitative motoring of the STI knowledge correlation. (Jia et al., 2015) found that the industry would transform to the science-based industry if it attached importance to the basic technological innovation, which would transform to the technology-based industry if it attached importance to the applied technological R&D (Research and Development).
The above literature effectively analyzed the STI correlation and the indexes, but there were lack of considering comprehensively the above four dimensions. This article will continue to resolve these problems.
Method of the STI Correlation Monitoring
For measuring the development trend of STI correlation, many scholars have put forward a lot of superb insights (Huang & Yang, 2014). There are two methods: the questionnaire survey and the scientometrics (Dolgin, 2008). The questionnaire survey requires a lot of investigations, which is time-consuming and expensive, but its accuracy and professionalism is guaranteed. The scientometrics includes the bibliometrics (Moro et al., 2018), the patent metrics (Chang et al., 2010), the social network analysis (Teodorescu, 2015), the technology roadmap (Silva et al., 2018), etc., which could not only provide a clear panorama of S&T development (Tan et al., 2021), but also help to understand the key S&T quickly (Furnham, 2021). The HCC uses media exposure indicators to reveal the correlation relationship between technology and industry in the AI field (Oosterhoff & Doornberg, 2020), and provides good enlightenment for this article.
This article analyzes and summarizes the existing monitoring methods by conducting literature research and expert consultation, as shown in Table 1.
Comparisons of the STI Monitoring Methods.

Based on the comparisons in Table 1, the analysis conclusions are as follows. (a) The methods listed above play a certain role in revealing the development trend of S&T correlation (Marzi et al., 2020). The HCC and technology roadmap cannot reveal the STI correlation development trend in the time series. (b) The HCC is only used to represent the 1-year development trend, but not the historical development trend, and the technology sets are not systematic. (c) For the scientometrics (the bibliometrics and the patent metrics), the citations that the number of patents cited by papers, and papers (reports) cited by patents is small, which could not be enough to reveal the development trend of S&T correlation (Huang et al., 2015).
To sum it up, the existing monitoring methods cannot meet the needs of the aforementioned revealing the STI correlation. Therefore, this article proposes the STI correlation monitoring method to solve these problems.
Research Review
To sum it up, this article obtains the following two enlightenments from the above research: papers can reveal the status and trend of science development, and patents can reveal the status and trend of technology development (Nguyen et al., 2020); in a certain field, the IDS’s judgment conclusion obtained from experts can reveal the status and trend of industry development.
There has a lot of in-depth research on STI correlation monitoring, but there are the following four deficiencies.
(a) Lack of the relatively complete AI classification system. There is not a systematical AI classification system, which is the basis of the STI correlation monitoring. The relative entire classification system should be constructed on the basis of the existing AI classification system.
(b) Lack of completely method and processing designment of the IDS judgment in the AI subfields. The different institutions and researchers have different perspectives, and they finally form different IDS division methods.
(c) The existing monitoring dimensions and indexes of the STI correlation need to be further improved. The above-mentioned four dimensions need to be considered comprehensively. Most of the research is based on the simple numbers and citations of patents and papers, which are not persuasive, and cannot reveal the subfield differences.
(d) The existing monitoring methods of the STI correlation need to be reconstructed. The above-mentioned methods cannot meet dynamically and visually revealing the development trend of the STI correlation in the AI subfields and the subfield differences. A new STI correlation monitoring method in the AI field with the above methods comprehensively need to be reconstructed.
In order to works out the above research deficiencies, this article is organized as follows (Figure 1).
(a) Briefly reviews the previous research and their shortcomings, and proposes the solutions.
(b) Performs the data processing, including construction of the AI classification system and retrieval strategies, data cleaning and finishing, selection of the national analyzing range.
(c) Designs the monitoring method and model for the STI correlation in the AI subfield, including determination of the analysis dimensions, designment of the judgment method of IDS, designment of the monitoring method and model.
(d) Selects the typical AI subfield to verify the designment effectiveness.
(e) Issues the research conclusions, contributions, and limitations.
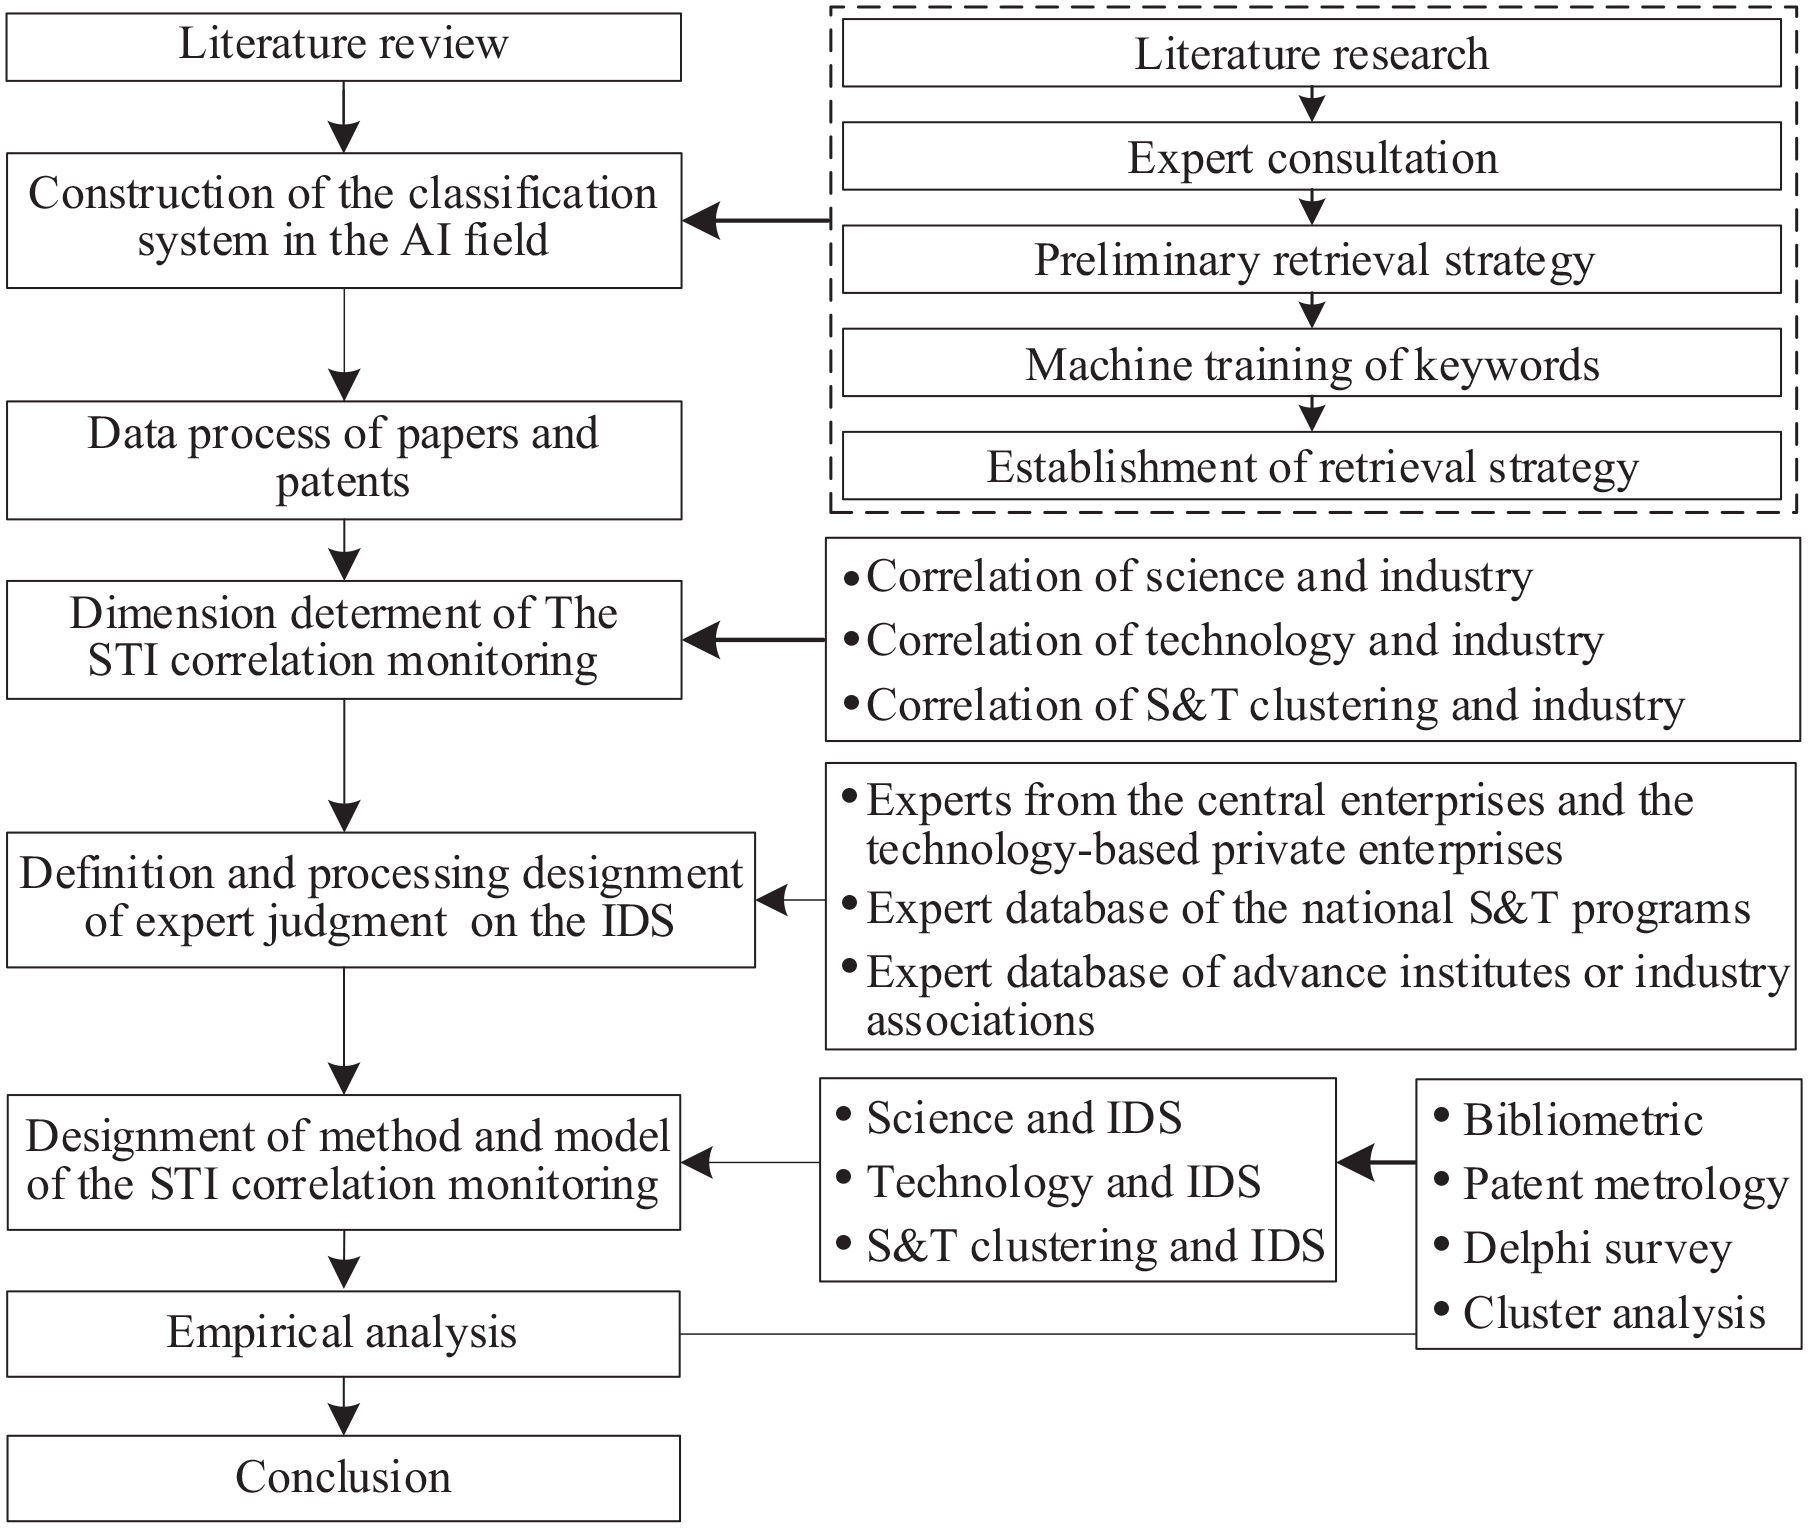
Research framework.
Data Processing
Construction of the AI Classification System
Ideas on the AI classification system
For constructing the classification system of discipline technology in AI field, this article determined three stepping stones: (a) The AI field is inseparable from the field of computer science and technology. Therefore, the AI discipline in the field of computer science and technology can be taken as the core, then extend to other disciplines, and finally form a relatively perfect classification system. (b) If the classification system of the discipline and the technology is completely determined by word frequency clustering, some relatively small fields will be ignored. Therefore, the method of word frequency clustering only is the ancillary means to construct the classification system in this article. (c) The follow-up research will make full use of the large number of existing documents (reports and papers, etc.), which hold a scientific analysis basis, word frequency clustering, etc.
To construct a classification system, it is necessary to carry out investigation and analysis, expert consultation and argumentation, data retrieval and download, machine learning (Khatter & Ahlawat, 2020), etc., it is shown in Figure 2.
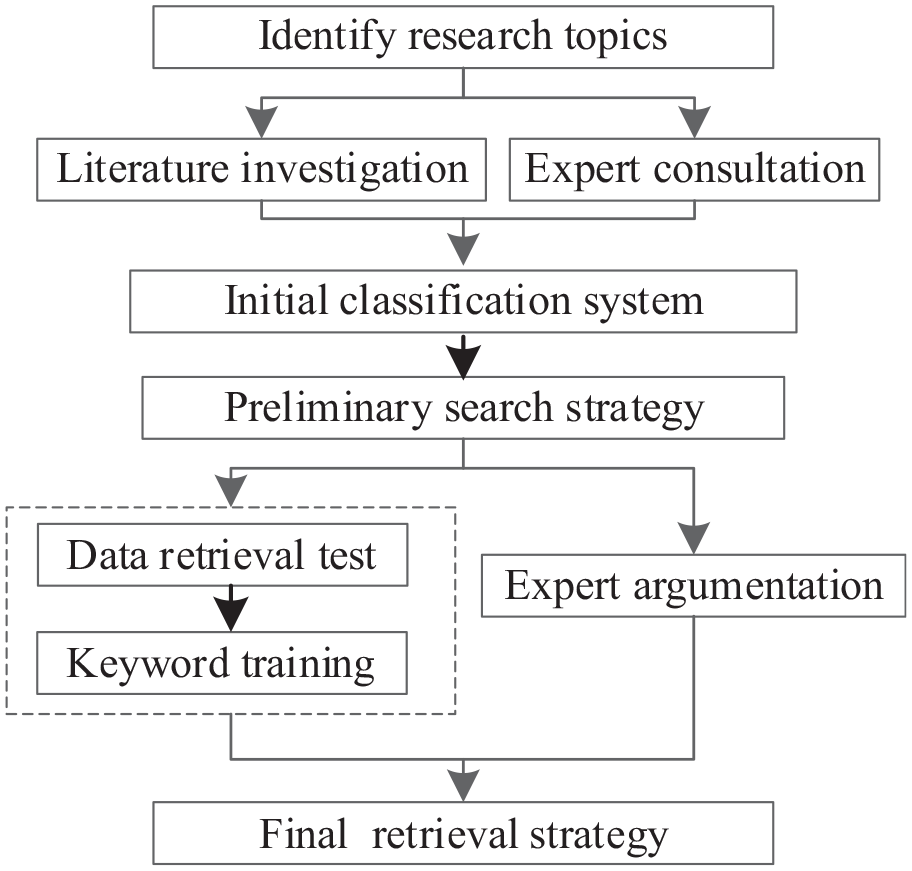
Construction process of the AI classification system.
The investigated literatures include the three aspects. (a) Important government documents and research reports of authoritative institutions, etc. (see Annex A, B). (b) Reference documents of the discipline classification, including the CCS 2012, the arXiv system of Cornell University and the Elsevier discipline classification system, etc. (c) Related science papers (see Section II).
Among the above four kinds of literatures, the CCS 2012 is the key base for the construction of the AI classification system. In the CCS 2012, “K.3 AI” is the secondary classification, but does not completely cover the AI discipline. For instance, “K.4 Machine learning” is at the same level with “K.3 AI,” and “C.1.3.1 Cloud computing” is a third level classification. It has been 10 years since 2012, and great changes have taken place. For example, “cloud computing” has become a hot spot in the AI field, which is the AI basic discipline (new infrastructure). However, the CCS 2012 has not been updated since 2012. Therefore, a relative complete AI classification system needs to be improved on basis of the CCS 2012.
Determination of the AI classification system
Based on the literature comparative analysis and expert consultation, the final AI classification system is shown in Table 2, which includes 7 major fields and 28 subfields. This article focuses on only the mainstream in the AI field, so there is no “miscellaneous” to cover all the classifications.
Classification System in the AI Field.

Determination of the retrieval strategy
In this article, the data came from the papers in the Science Citation Index (SCI) database and the Social Science Citation Index (SSCI) database of Web of Science (WOS), and the patents in the global patent database of Patsnap (https://www.zhihuiya.com/). After the multi round keyword retrievals and machine trainings in the AI field, the keyword family was constantly supplemented and perfected. The retrieval strategies in the AI subfields were determined (see Annex C).
Data Cleaning and Finishing
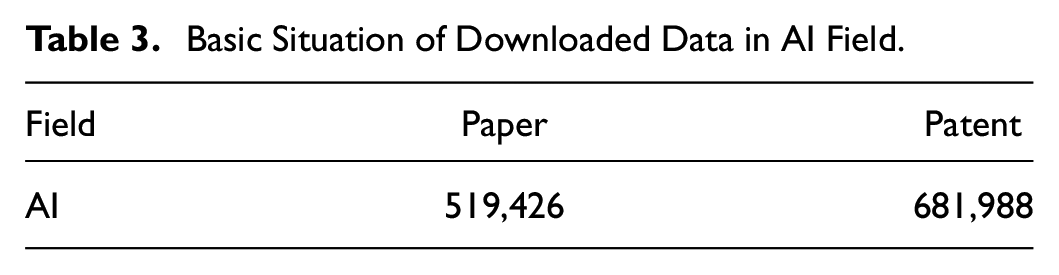
Based on the retrieval strategies, this article downloaded the data of papers and patents (January 1, 2000–December 31, 2018). The downloaded situation is shown in Table 3.
Basic Situation of Downloaded Data in AI Field.
Data cleaning
The data cleaning was carried out by running the Microsoft SQL Server software (SQL Server). The corresponding solutions included the following four categories.
(a) Solving incomplete data. Some fields of the downloaded data may have empty or incomplete values, so it would need to be deducted from the other fields or other data sources (Yan et al., 2019). For example, since the national information of some patent applicants is missing or incomplete, it need to be supplemented from the address field or other fields (Xu et al., 2020). The method is also applicable to supplement the inventor’s national information (Dai et al., 2017).
(b) Detection and solution of error value. When the external downloaded data was imported to the local database, some data had conversion errors (Goh VT & Siddiqi, 2008). For example, when “2019-01-01” in the text file was converted to the data of Excel or SQL server, it was considered as digital data, so it may become 43,466 (days from 1900-01-01 to 2019-01-01) (De et al., 2014). For the data involving dates, this article designed a comparison data table, which could execute the update command to realize batch modification.
(c) Processing of duplicate records. There are duplicate records of the same retrieval strategy (Zhang, Yang et al., 2013). The method of searching for unique record is used to form a new target table.
(d) Detection and solution of inconsistency. The data inconsistency mainly involved the inconsistency of name identification and invalid (noise) data (Bahmani et al., 2017). The inconsistent process of name identification involved converting data under certain rules. For example, the country name was labeled differently, such as US, USA and the United States, then they needed to be converted uniformly with one standard (Jia et al., 2015). For the invalid (noise) data processing, this article used the syntax analysis to clean up the multi-source data (Dai et al., 2017). The downloaded data may be not applicable to the target research. For example, when retrieving on the AI core technologies in WOS, it would get data on the policy formulating in the AI field. It is necessary to analyze, match, and compare the keywords, such as policy formulating, policy analysis, etc. (Hoeser & Kuenzer, 2020)
After the data was cleaned up, the invalid data reduced to 1.5% and 2.5% respectively, achieving the goal of eliminating unnecessary data and the full use of effective data.
Data finishing
After the data cleaning, the data set still had not reached the ideal statistical state. The following four steps were done.
(a) Simplifying database. The database simplification mainly involves the field selection from the initial database to improve the statistical analysis efficiency. This article selected 18 paper fields and 25 patent fields.
(b) Extract of characteristic information. In the downloaded data, the patent inventors (authors) and patent applicants (institution of the authors) are normally not independent individual. It is necessary to conduct statistical analysis for single inventor (author) and patent applicant (institution of the authors), thus, the data segmentation is the first step. This article designed an effective segmentation program to conduct the segmentation work (see Annex D).
(c) Identification of country information. The country identification of the inventor (paper author) and patent applicant (institution of author) which usually exists in the address field of patent and paper, is the precondition to carry out the statistical analysis. Based on the above-mentioned segmentation program, the country information also was separated from the address field’s value.
(d) Supplement and correction of data. There are also some anomalies in some data. For example, the abstract information may be written into the title field or other fields in the patent data, and countries are merged or split (such as Yugoslavia and the Soviet Union). This article carried out the manual processing for a small amount of data, and designed the contrast table to supplement or correct for a large amount of data.
Selection of Countries
There are more than 200 countries in the world, which S&T development levels are uneven. This article mainly focuses on the top 30 countries in the AI field. The method of selecting countries is as follows. (a) Ranks descending the countries according to the number of papers and patents respectively, and forms the two data sets. (b) Sums the rankings of each country in the two data sets, ranks the sums in ascending order, and ranks in ascending alphabetical order of country name if the sum value is the same. (c) Takes out the top 30 countries (see Table 4) from the ranking.
Top 30 Countries in the AI Field.

The ranking includes the ranking of patents (the first number in parentheses) and papers (the second number in parentheses).
Method and Model
Based on the methods of bibliometrics, patent metrics, the Delphi survey, and cluster analysis, this article intends to measure and reveal the development trend of the STI correlation.
Dimension Determination of STI Correlation Analysis
According to the existing research, the industrialization process of the STA is irreversible. Therefore, the situation that the S&T development path is not involved in the industry development path does not exist. The distribution time of the S&T development path must precede that of the industry development path. On the basis of assuming three time points (t0→t1→t2), this article summarized the relationship among Science (S), Technology (T) and Industry (I), and eliminated some types that do not conform to the objective situation. Their correlation relationship can be shown in Figure 3.

Correlation relationship of STI. S: Science, T: Technology, I: Industry. (a), (b), (c), (d) are the names of the sets in the dotted box. t0, t1, t2 are the time nodes and the arrows between them indicate the advance of time.
Figure 3 reveals the six following information. (a) In type (a), science, technology and industry developed independently without mutual promotion and influence. (b) In type (b), science and technology were promoted mutually and did not involve industrialization. (c) In type (c), science and technology promoted industry development, and industry was in the terminal position. (d) In type (d), science and technology promoted industry development, industry in turn promoted S&T development, and industry was in the middle or terminal position. (e) There were four types (the dotted box A) involving all of STI. (f) Science-based industry (the dotted box B) and technology-based industry (the dotted box C) existed in type (d).
The relationships in type (a) and type (b) in Figure 3 do not involve the STA industrialization, which are not within the research scope in this article. Conversely, those in type (c) and type (d) are the focus of this article, which involves the three dotted boxes, including dotted box A: focusing on all of STI; dotted box B: focusing on science and industry; and dotted box C: focusing on technology and industry. Accordingly, this article determined three measurement dimensions of the STI correlation: S and I, T and I, S and T and I. This article measured the correlation of “S and T and I” from the dimension of S&T clustering and I.
Judgment Method of the IDS in the AI Subfield
Based on the literature reviews, this article revealed the development trends of the industry with the judgment conclusions of expert groups in the AI subfield. The judgment method included three aspects: definition of the IDS, selecting experts, and expert judgment.
Definition of the IDSs
(Gort & Klepper, 1982) established the first industry life cycle model, and divided the industry life cycle into four stages: start-up, growth, mature and decline. At present, the venture capital constantly moves forward to the point of entering the industry, and focuses on the preliminary research preparation stage of products, even the stage of applied basic research. For example, the World Economic Forum (WEF) issues annually “top ten emerging technologies in the world,” which are invested by a lot of venture capitalists, although most of them are in the stage of theoretical research or laboratory (DiChristina & Meyerson, 2017). However, due to the late development of emerging industries, the vast majority of them have not developed into the mature stage, not to mention the decline stage. Based on the perspective of the whole innovation chain, this article moved the starting point into the stage of applied basic research in the AI field, and the ending point into the mature stage. This article also focuses on the expansion stage in which the industry rapidly rises and slightly decelerates.
Combining with the theory of the product life cycle, HCC, and other methods of dividing the IDS (Bahmani-Oskooee & Ratha, 2011), this article forms a preliminary understanding of the IDS in the AI field. With the means of expert consultation and literature comparison, the IDS is finally divided into five stages: R&D, start-up, growth, expansion, and maturity. On the basis of learning from HCC, this article forms its own IDS curve (Figure 4).
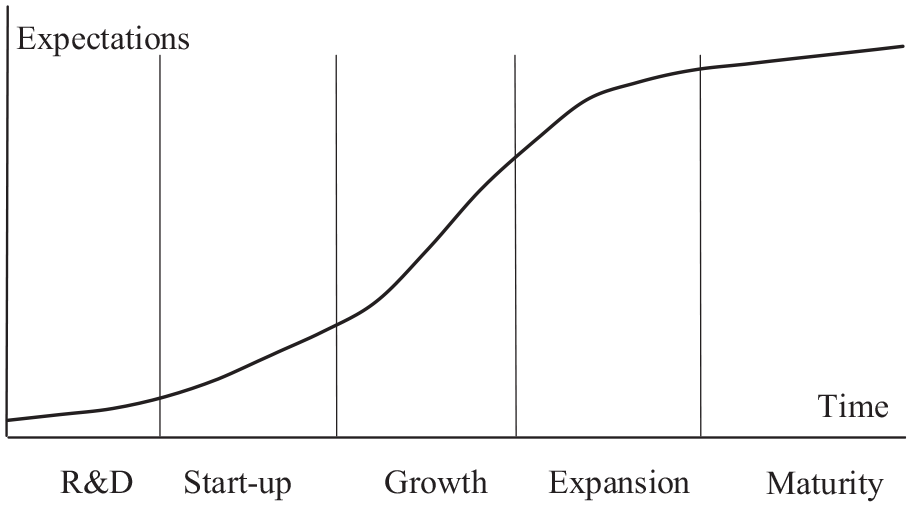
Curve of IDS.
Selecting the experts
Based on the expert resources available to this research team, the expert database in the AI field was established. The main resource of experts is shown in Figure 1. The establishment process of the expert database is as follows. (a) According to the keywords in the retrieval strategy (Annex C), experts are retrieved from the three expert databases listed in Figure 1, and there are 78 experts who accept our invitation. (b) There are 19 experts which come from expert databases (expert database of the national S&T programs, advance institutes or industry associations) and enterprises (the central enterprises and AI private enterprises, etc.) who accept the invitation. Simultaneously, some experts are familiar with multiple subfields, so there are cross situations among experts in different subfields.
Expert judgment process
The expert judgment process of the IDS in the AI subfield is as follows.
(a) Preliminary judgment of a single expert. The team has developed a complete expert judgment software. After experts have a legal system account, they can enter the system to judge the IDS in the AI subfield. The valuation range of the experts’ IDS judgment involves A, B, C, D, and E, which respectively correspond to the five stages of R&D, start-up, growth, expansion, and maturity (see Table 5).
(b) Confirmation of the conclusion of the expert group. In order to reflect the objective IDS judgment, this article finally adopts the expert group’s judgment conclusions. Table 6 shows the sample of expert group judgment conclusions.
The valuation range of expert’s IDS judgment.

The icons are used to identify the corresponding stages in the monitoring results.
Sample of Expert Group Judgment Conclusions.

The final judgment conclusion of subfield IDS is calculated according to the concentration degree of expert group conclusions, in which the number of experts is odd and greater than or equal to 3. The ratio of the maximum count values of judgment conclusion to the number of experts is calculated. If the ratio is greater than 50%, the IDS conclusion is identified by the corresponding type, or else, it needs to reorganize another expert group. In Table 6, two of the three experts drew the conclusion of “A,” so the ratio is 2/3 ≈ 67%, then the final judgment conclusion is “A” corresponding to the R&D stage.
Monitoring Method of the STI Correlation
In view of the STI correlation, this article reveals the aggregation degree of the number of science papers (patents), that is, the science (technology) hot-degree (Lin, Xie et al., 2018; Liu & Porter, 2020), and their cited situation is referred to as the science (technology) influence (Hartong & Roddy, 2020; Jokanović et al., 2017). In the subsequent analysis, papers and patents are collectively referred to as STAs. Based on the above AI classification system, the specific analysis methods are as follows.
Hot-degree of the STA
The ratio of the number of annual STAs in the subfield to that in the major field can reflect the relative aggregation degree of the subfield in a major field. For instance, for the subfield “Neural Network” to the major field “Algorithm & Platform” (see Table 2), the higher the ratio is, the higher the R&D hot-degree is.
Influence of the STA
The average cited frequency of annual STAs in the subfield is used to reflect the subfield influence. The higher the average cited frequency, the higher the science (technology) influence is in the subfield.
Correlation monitoring of the STA and the IDS
Being a common attribute of the STA and the IDS, the year is regarded as the correlation factor in this article. Based on the data of the STA hot-degree (influence), a two-dimension coordination system was constructed, in which the horizontal coordinate is the year, and the vertical coordinate is the hot-degree (influence). That the experts’ IDS judgment conclusions are attached as the icons of coordination points, forms the correlation of the IDS and the STA hot-degree (influence), as shown in Figure 5.
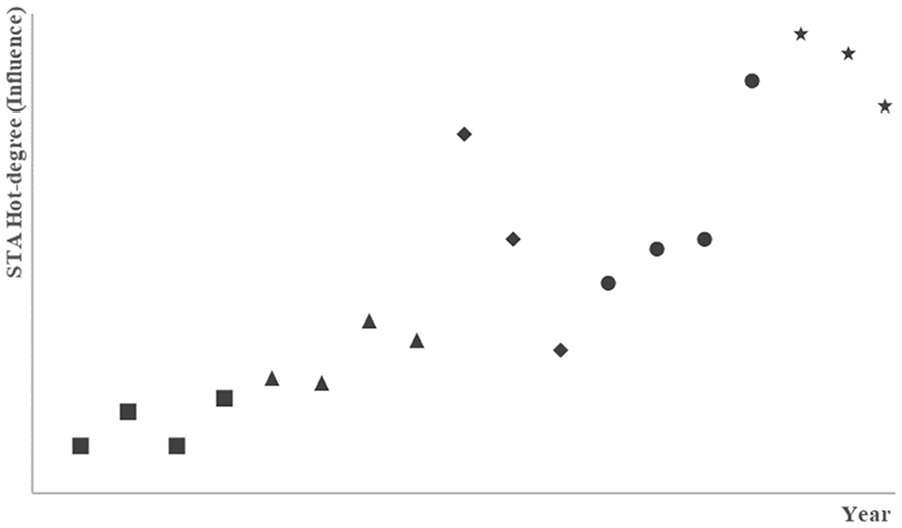
Designment of correlation monitoring of STA hot-degree (Influence) and the IDS.
Correlation monitoring of the STA Clustering and the IDS
The hot-degree (influence) data of the STA has a common attribute of the publication year (Hu & Rousseau, 2018). Therefore, this article regards the year as the clustering variable, also regards the STA hot-degree (influence) attribute as the clustering variable.
For the clustering analysis, a two-dimension coordinate system is also constructed. The horizontal coordinate is the science hot-degree (influence), and the vertical coordinate is the technology hot-degree (influence). Therefore, the points clustering the values of science hot-degree (influence) and those of technology hot-degree (influence) will scatter in four quadrants. The average value of the science hot-degree (influence) and that of the technology hot-degree (influence) is the intersection of the abscissa and the ordinate. The scatter points are labeled with the year and the IDS in the subfield. Thus, it can completely show the correlation relationship of the STA clustering and the IDS, as shown in Figure 6.

Designment of correlation monitoring of STA Hot-degree (Influence) clustering and the IDS.
Correlation monitoring perspective
The correlation monitoring of the STA and the IDS needs to be analyzed from two perspectives: all monitored countries and individual country. It is necessary to understand the global development, and also the development of the individual country which is dominant or the one of special concern.
According to the above-mentioned methods in this section, this article puts forward the specific framework of the monitoring method of the STI correlation, as shown in Figure 7.

Framework of monitoring method of the STI correlation.
In fact, our team has developed a special software system to realize the STI correlation monitoring in several emerging technology fields including the AI field. The subsequent works including expert judgment and empirical monitoring are based on this software.
Monitoring Model of the STI Correlation
Basic definition
The monitoring model depends on six basic variables: country, year, major field, subfield, and type of STA.
(a)
(b)
(c)
(d)
(e)
(f)
The correlation functions are also defined as follows.
(a) For correlation monitoring of the STA and the IDS, the function is
(b) For correlation monitoring of the STA clustering and the IDS, the function is
In the subsequent formula, the above definitions will not be repeated.
Correlation monitoring of the STA Hot-degree and the IDS
The correlation monitoring formula of the STA hot-degree and the IDS is defined as follows.
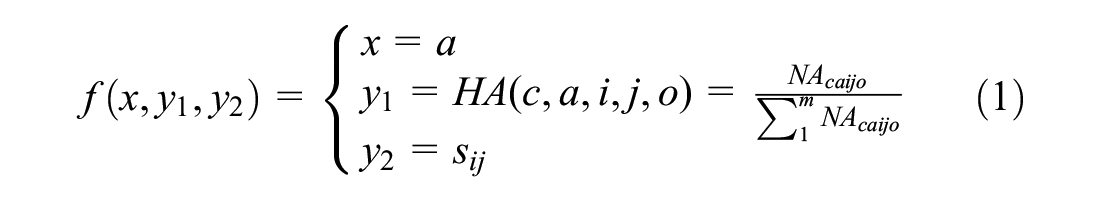
Where
Correlation monitoring of the STA influence and the IDS
The correlation monitoring formula for the STA influence and the IDS is defined as follows.

Where
Correlation monitoring of the STA Hot-degree clustering and the IDS
The correlation monitoring formula for the STA hot-degree clustering and the IDS is defined as follows.
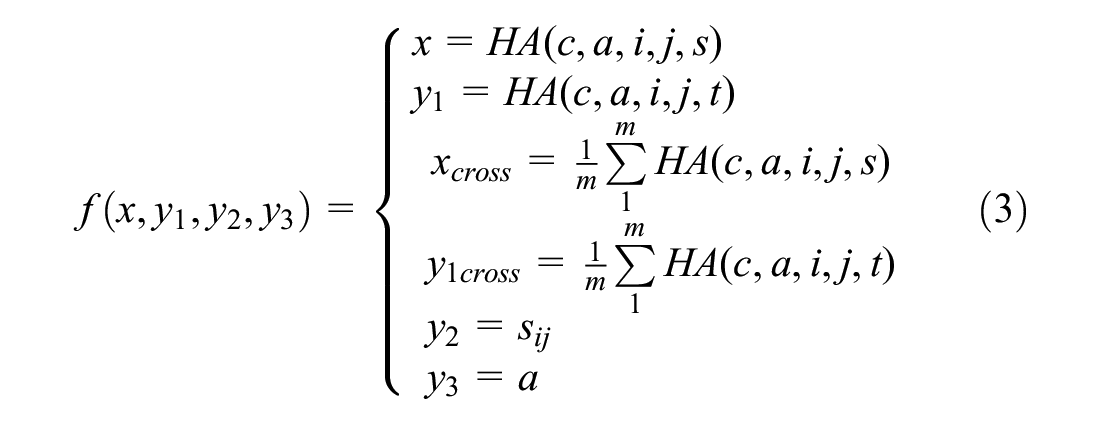
Where
Correlation monitoring of the STA influence clustering and the IDS
The correlation monitoring formula for the STA influence clustering and the IDS is defined as follows.

Where
Empirical Analysis and Discussion
Judgment Conclusion for the IDS in the AI Subfield
On the basis of the above expert group’s judgments, this article obtained the IDS judgment conclusions for 28 subfields. Table 7 shows the IDS judgment conclusions (final stage) for the expert group in the AI subfields from 2000 to 2018.
IDS Judgment Conclusions (Final Stage) in the AI Subfield .

Selection of Empirical Subfield
The empirical analysis selects the neural network (NN) field from the 28 final-level fields. The reason lies in the following two aspects: a) The NN is highly representative due that it is a R&D hotspot in the AI field since the 1980s and there are a lot of STAs (Chuah et al., 2002), and has successfully solved many practical problems in many fields, including pattern recognition, intelligent robot, automatic control, prediction and estimation, biology, medicine, economy, etc.(Khan et al., 2020); b) The NN field has developed into the expansion stage, which is the top level among the 28 AI subfields (Table 7). Therefore, let
IDS Judgment Conclusions of Expert Group in the NN Field.

Correlation monitoring for the science and the IDS
For the correlation monitoring for the science and the IDS, this article adopted two dimensions: science hot-degree and science influence, and each dimension with two perspectives: all monitored countries and an individual country. Due to the outstanding performance of S&T in the United States (U.S.), this article takes the U.S. as the analysis object.
The science hot-degree and the IDS
a) All monitored countries. Let
b) The U.S. Let

The correlation development trend for the science hot-degree and the IDS (NN).

The correlation development trend of Science Hot-degree and IDS (NN, U.S.).
The science influence and the IDS
(a) All monitored countries. Let
(b) The U.S. Let

The correlation development trend for the science influence and the IDS (NN).

The correlation development trend of the science influence and the IDS (NN, U.S.).
Correlation Monitoring of Technology and the IDS
The correlation monitoring of the technology and the IDS also adopts the two dimensions of hot-degree and influence, and the two perspectives of all monitored countries and individual country.
The technology hot-degree and the IDS
(a) All monitored countries. Let
(b) The U.S. Let

The correlation development trend of the technology hot-degree and the IDS (NN).

The correlation development trend of the technology hot-degree and the IDS (NN, U.S.).
The technology influence and the IDS
(a) All monitored countries. Let
(b) The U.S. Let

The correlation development trend of the technology influence and the IDS (NN).

The correlation development trend of the technology influence and the IDS (NN, U.S.).
Correlation Monitoring of the STA Clustering and the IDS
The correlation monitoring for the STA clustering and the IDS also adopts the two dimensions of hot-degree and influence, and the two perspectives of all monitored countries and individual country.
The STA hot-degree clustering and the IDS
(a) All monitored countries. Let

The correlation development trend for the STA hot-degree Clustering and the IDS (NN).
In quadrant I, the years with a high science hot-degree and high technology hot-degree include the years 2000 to 2006, involving the R&D and start-up stage. In quadrant II, the years with a low science hot-degree and high technology hot-degree include the years 2017 to 2018, involving the growth stage. In quadrant III, the years with a low science hot-degree and low technology hot-degree include the years 2012 to 2016, involving the expansion stage. In quadrant IV, the years with a high science hot-degree and low technology hot-degree include the years 2007 to 2011, involving the expansion stage.
In the early stages of R&D and start-up, the inputs in the science research and the technology development are relatively balanced. With the development of a balanced S&T, the industry enters the growth stage and its development focus is biased on the science research. The expansion stage covers two quadrants: quadrant III and quadrant IV. In the trend of the years 2016-2018, the focus on technology development is to transform technology into industry.
(b) The U.S. Let

The correlation development Trend for the STA hot-degree clustering and the IDS (NN, U.S.).
In quadrant I, the years with a high science hot-degree and high technology hot-degree include the years 2000 to 2008, involving the stages of R&D, start-up, and growth. In quadrant II, the years with a low science hot-degree and high technology hot-degree include the years 2009 to 2010, involving the growth stage. In quadrant III, the years with a low science hot-degree and low technology hot-degree include the years 2011 to 2018, mainly involving the expansion stage. It’s empty in quadrant IV.
In the early stages of R&D and start-up in the U.S., the S&T inputs are relatively balanced, but the technology development in the R&D is slightly biased. The growth stage spans quadrants I, II, and III, but shows a downward trend, which indicates that the S&T inputs in the U.S. have declined. The scattered points in the expansion stage are all in quadrant III. Based on the trend of the years 2011 to 2018, the industry development pays more attention on the science research with maintaining R&D inputs.
The STA influence clustering and the IDS
(a) All monitored countries. Let

The correlation development trend for the STA influence clustering and the IDS (NN).
In quadrant I, the years with high science influence and high technology influence include the years 2000 to 2006, involving the R&D and start-up stages. In quadrant II, there are no scattered points. In quadrant III, the years with low science influence and low technology influence include the years 2012 to 2018, involving the expansion stage. In quadrant IV, the years with high science influence and low technology influence include the years 2007 to 2011, involving the growth stage. The scatters in quadrants III and IV show a gradually downward trend, indicating that the high inputs in the science research and low inputs in the technology development have gradually turned to low intensity balanced inputs in the growth and expansion stage.
(b) The U.S. Let

The correlation development trend for STA influence clustering and IDS (NN, U.S.).
The correlation monitoring results for the STA influence clustering and the IDS in the U.S. in Figure 19, are similar to those of all monitored countries in Figure 18. It shows that the S&T development in the NN field in the U.S. dominates the global development direction. The cross point is (29, 24) in Figure 19, and is (20, 10) in Figure 18. That is, the values of the cross point in Figure 19 are at least 10 frequencies higher than those in Figure 18. That the scatters in two figures are basically the same in 2018, shows a downward trend and the leading role of the U.S.
Conclusion
Based on the reliable data and the STI correlation monitoring method proposed in this article, (a) it can be used to accurately grasp the IDS, the trend of the S&T development, the advantage subfields, and the dominant countries in the AI field. (b) For the development trend analysis of the STI correlation, it is necessary to comprehensively utilize the monitoring conclusions of the above three dimensions. (c) Based on the independent extraction of the global or national monitoring results in each subfield, the difference analysis between subfields can be carried out from the global or national perspectives, and between a country and the globe, and between countries can be carried out from the subfield perspective.
The monitoring results demonstrated the followings. (a) The industry development in the NN field is in the expansion stage as of 2018. The industry development also needs to strengthen S&T inputs, as well as to enhance the driving force of the basic research and the technology development. (b) The U.S. leads the global S&T development in the NN field. Its STA hot-degree (influence) is consistent with that of the globe, but its STA hot-degree (influence) is significantly higher than that of the globe, and its S&T advantages and leading role in this field are obvious. (c) From the correlation dimensions for the STA hot-degree (influence) and IDS (see Figures 8, 10, 12, and 14) in the NN field, the overall development trend of the science hot-degree (influence) is similar to that of the technology hot-degree (influence). It indicates that the proportion of annual S&T inputs are relatively balanced. That the science hot-degree (its average value is about 0.2) is significantly higher than the technology hot-degree (its average value is about 0.1), indicates that the inputs of the science research are slightly higher than those of the technology development. (d) From the correlation dimensions of the STA hot-degree clustering and the IDS, there have several years in the imbalance situation of global S&T inputs (see quadrant II and quadrant IV in Figure 16). Figure 17 shows that it is basically balanced with high S&T outputs in the early period (2000–2008) and low S&T outputs in the later period (2009–2018). (e) From the correlation dimensions of the STA influence clustering and the IDS (see Figures 18 and 19), the situation of the globe is basically convergent to that of the U.S. In the early stage (2000–2006), the S&T influence is high; while in the later stage (2009–2018), the S&T influence is low.
The monitoring method for STI correlation can serve as a support for formulation, implement and evaluate the industry policy, and assist the decision of R&D direction for the enterprises and institutions in the AI subfield. Based on the monitoring results, it can accurately grasp the development trend in the AI subfield, and ultimately promote the STI correlation development. The monitoring method can also be applied to the STI correlation monitoring in other fields.
Contribution and Limitation
Contribution
This article provides method support and practical application value for enterprises, investors and governments to grasp the frontier direction, select the R&D investment projects, and grasp the development trend in the AI subfields, mainly including the following three aspects.
Proposing the AI classification system and its construction mothed
Based on the CCS 2012, this article mainly analyzed and summarized the four types of literature, including government documents, research reports, and reference documents on the discipline classification and the research papers, and basically covered the current mainstream AI field. It would be help to clarify the boundaries of the AI subfields for the relevant personnel, including the scholars, the R&D personnel, and the service personnel for STA transformation.
This article proposes an effective method to construct the AI classification system, including collection of the basic literatures, multiple rounds of expert consultation and machine learning, and formulation of the retrieval strategies. It would provide effective ideas and methods for constructing the AI classification system.
Proposing a new division method of the IDS
From the perspective of the whole innovation chain for the emerging industry, this article divides the AI industry life cycle into five stages: R&D, start-up, growth, expansion, and maturity. The proposed IDS dividing method extends the industry life cycle forward and pays attention to the applied basic research.
The definition criteria and judgment method for the IDS can help investors accurately capture the industry development trend and opportunities in the AI subfield, even to other emerging industries.
Constructing the method and model for the STI correlation monitoring
The task of constructing the method and model for the STI correlation monitoring, is including three aspects: (a) Determinates the monitoring dimensions of the STI correlation, including Science and Industry, Technology and Industry, Science and Technology and Industry. (b) Establishes the two major indexes of the hot-degree and the influence; and then comminating the division definition of the IDS, transforms the monitoring dimensions into three types: the STA hot-degree and the IDS, the STA influence and the IDS, and the STA’s hot-degree and influence clustering and the IDS. (c) Based on the establishment of the indexes and determination of the monitoring dimensions of the STI correlation, constructs the method and model. It would be help to reveal the relative aggregation degree and the influence intensity of the subfield STA in the whole AI field, and the balance status of the science research and the technology development.
The method and model for the STI correlation monitoring can be used to analyze the policy-making effects and development trends for the science research and the technology development in different periods.
Limitations
Although this article proposes the effective method and model for the STI correlation monitoring, some limitations still need to be addressed.
(a) The monitoring data from the data fields of papers and patents has problems of time delay due to the process of reviewing and publication. According to the existing data conditions of papers and patents, more effective solution methods need to be explored.
(b) There is a lack of direct comparative analysis among different subfields or countries (regions). The comparative information can be obtained by analyzing the subfields or countries (regions) one by one. If the comparative information can be shown in one graph, the usability will be enhanced. Thus, it is necessary to further optimize the design on the basis of existing research.
(c) For the measurement of the hot-degree and influence in this article, the core indexes are the quantity and the cited frequency. Although they are the most important indexes, there are also other relevant basic indexes that need to be included in further research.
Supplemental Material
sj-docx-1-sgo-10.1177_21582440221141299 – Supplemental material for Correlation Monitoring Method and model of Science-Technology-Industry in the AI Field: A Case of the Neural Network
Supplemental material, sj-docx-1-sgo-10.1177_21582440221141299 for Correlation Monitoring Method and model of Science-Technology-Industry in the AI Field: A Case of the Neural Network by Xiaoli Wang, Yun Liu, Lingdi Chen and Yifan Zhang in SAGE Open
Footnotes
Author Contributions
The contributions of all authors are as follows: Xiaoli Wang and Yun Liu conceived and designed the study; Lingdi Chen and Yifan Zhang collected the data; Xiaoli Wang analyzed the data; Xiaoli Wang, Yun Liu, Lingdi Chen and Yifan Zhang drafted the article and revisied it critically for important intellectual content. Xiaoli Wang reviewed and edited the manuscript. Especially, we thank Liu Wenlan for her contribution to the reviewed and edited work. The authors gratefully acknowledge the valuable suggestions from the anonymous reviewers.
Declaration of Conflicting Interests
The author(s) declared no potential conflicts of interest with respect to the research, authorship, and/or publication of this article.
Funding
The author(s) disclosed receipt of the following financial support for the research, authorship, and/or publication of this article: Xiaoli Wang was partially funded by (National Natural Science Foundation of China) grant number (72074023); Yun Liu was funded by (National Natural Science Foundation of China) grant number (71810107004), (Major Projects of National Social Science Fund of China) grant number (21ZDA016), (Special work on innovation methods of the MOST of China) grant number (2020IM021000).
Supplemental Material
Supplemental material for this article is available online.
References
Supplementary Material
Please find the following supplemental material available below.
For Open Access articles published under a Creative Commons License, all supplemental material carries the same license as the article it is associated with.
For non-Open Access articles published, all supplemental material carries a non-exclusive license, and permission requests for re-use of supplemental material or any part of supplemental material shall be sent directly to the copyright owner as specified in the copyright notice associated with the article.