
Abstract
We examined the relationship between pedagogical content knowledge (PCK) test scores and elementary school teachers’ psychological variables, conceptions of teaching and learning and test utilization strategy, for mathematics. Through a web-based survey, participants responded to a six-item descriptive PCK test and to inventories of conceptions of teaching and learning and test utilization strategy. Data from 297 elementary school teachers were analyzed for associations with PCK scores. The results showed that constructivist conceptions and test utilization strategy were positively correlated with PCK test scores, and traditional conceptions were negatively correlated. In addition, the results of multiple regression analysis showed that traditional conception and test utilization strategy each showed unique associations with the PCK test. These results suggest the importance of teachers’ beliefs and test utilization strategies as related variables of teachers’ PCK.
Keywords
Introduction
Pedagogical content knowledge (PCK) is a teacher’s professional knowledge in teaching subjects to students, and accumulated evidence has demonstrated that PCK enables effective teaching, leading to improvement in students’ academic performance (see Depaepe et al., 2013 for a review). However, there is limited research on what individual characteristics of teachers are associated with PCK among in-service elementary school teachers. In this study, we focused on conceptions of teaching and learning and test utilization strategy of elementary school teachers who teach mathematics and attempted to clarify whether these individual characteristics are related to PCK through a web survey.
An Overview of PCK Research
With the rise of cognitive psychology, the view that teachers’ professional behavior is enabled by the knowledge they possess has become widespread (Hogan et al., 2003). In particular, PCK, as proposed by Shulman (1986, 1987), focuses on teacher-specific knowledge and has continued to attract attention since its proposal. Shulman (1987) defined PCK as follows: “It represents the blending of content and pedagogy into an understanding of how particular topics, problems, or issues are organized, represented, and adapted to the diverse interests and abilities of learners, and presented for instruction” (p. 8). Shulman (1986) also proposed two components of PCK: knowledge of instructional representations and knowledge of learners. Knowledge of instructional representations refers to the knowledge used to explain subject content with analogies, illustrations, examples, or demonstrations. The latter involves knowledge regarding students’ procedural bugs and misconceptions, or the knowledge required to judge whether students learn specific concepts with ease or difficulty.
Further attempts have been made to extend the elements of PCK since Shulman’s proposal. In particular, teachers’ knowledge in arithmetic and mathematics is typically known as mathematical knowledge for teaching (MKT), which refers to the mathematical knowledge that teachers need to teach mathematics and is a framework consisting of content knowledge (CK) and PCK (Ball et al., 2008). Although Shulman’s proposal was theoretical, Ball and colleagues have also used MKT as a framework for empirical testing; in fact, a number of empirical studies with teachers have been reported (Hill et al., 2004, 2005, 2008). The MKT framework subdivides CK required for teachers; the following three knowledge categories are positioned as subcategories of CK, namely common content knowledge, specialized content knowledge, and horizon content knowledge. Common content knowledge refers to the mathematical knowledge and skills used in settings other than teaching. Specialized content knowledge refers to mathematical knowledge and skills that are unique to teaching mathematics. Finally, horizon content knowledge refers to an awareness of how distinct mathematical topics are related to each other. Furthermore, in addition to the two elements proposed by Shulman, MKT positions knowledge of content and curriculum as an element of PCK.
PCK is assumed to enable effective instruction for students. Previous studies have shown that teachers’ PCK positively influences students’ academic growth (Carpenter et al., 1988; Cueto et al., 2017; Griffin et al., 2009). For example, Baumert et al. (2010) conducted a study among secondary school mathematics teachers in Germany. A total of 4,353 ninth-grade students and 181 mathematics teachers participated in the study. They examined the relationship between teachers’ PCK and students’ mathematics performance after 1 year and found that teachers’ PCK had a positive effect on students’ performance growth, mediated by the quality of teachers’ instruction. In addition, the effect of PCK on academic performance was stronger than that of CK.
Individual Characteristics Associated With Teachers’ PCK
Given the importance of teachers’ PCK, it is necessary to examine what individual differences among teachers are associated with their PCK. By examining the characteristics of teachers with a wealth of PCK, it will lead to the elucidation of the factors that determine the amount of PCK, which in turn will enable the development of effective teacher training methods focusing on those characteristics. Until recently, however, individual differences among teachers have been minimally examined, particularly in regard to a lack of focus on psychological variables; most studies have focused on demographic variables such as age, gender, and academic degree. For example, Depaepe et al. (2013), who conducted a systematic review of PCK studies in the area of mathematics, summarized the group of studies of individual difference variables associated with PCK as follows (p. 21):
The fifth research line relates teachers’ PCK to their individual characteristics, such as age ( Lee, 2010 ), gender (Blömeke et al., 2008; Lee, 2010), acquired degree (i.e., the level of education, such as, bachelor, master, doctoral degree) (Baumert et al., 2010; Krauss et al., 2008; Lee, 2010; Meredith, 1993; Strawhecker, 2005; von Minden et al., 1998), nationality (An et al., 2004; Blömeke et al., 2008; Sorto et al., 2009; Zhou et al., 2006), or teaching experience (Cankoy, 2010; Lee, 2010; Sorto et al., 2009).
Although demographic variables represent individual differences, despite that they have been found to be associated with PCK, the potential for intervention is minimal. For example, even if an effect on age were found, it would not be possible to intervene to change an individual’s age. Therefore, it is important to examine the effects of intervenable psychological variables as well. In particular, recent research on PCK has increasingly focused on psychological variables such as beliefs and motivation (see Blömeke et al., 2014; Peterson et al., 1989; Yang et al., 2020 for studies examining teachers’ beliefs and Gleason, 2008; Thomson et al., 2017 for studies examining teachers’ motivation).
For example, Kunter et al. (2013) conducted a study of 194 secondary school mathematics teachers in Germany and measured their PCK, professional beliefs, work-related motivation, and self-regulation. The results showed that only constructive beliefs were correlated with PCK (r = .32), while enthusiasm for teaching and self-regulatory skills were not related to PCK. In another study that examined teacher motivation, Aksu and Kul (2019) measured PCK, mathematics teaching efficacy (MTE), and mathematics teaching anxiety (MTA) among 463 secondary mathematical teachers. The analysis showed that PCK was positively correlated with MTE (r = .63) and negatively correlated with MTA (r = −.22).
The Focus of This Study
Some gaps in the research
As mentioned above, although previous studies have examined the relationship between PCK and related psychological variables, several issues remain to be addressed. First, there are limited studies that have examined psychological variables among in-service teachers in elementary schools. Kunter et al. (2013) reported on secondary school mathematics teachers, and Mahler et al. (2017) and Park et al. (2020) reported on biology teachers, but the number of studies is minimal. In particular, only Peterson et al. (1989) conducted a survey of elementary school teachers. However, this study also had a limited sample, with only 39 data from first-grade teachers. Unlike in the case of secondary education, in many countries, elementary school teachers are assigned to a class where they teach several subjects (The Ministry of Education, Culture, Sports, Science, and Technology in Japan, 2012). Therefore, while secondary teachers are provided with opportunities for specialized training in specific subjects and opportunities to learn PCK, elementary school teachers have relatively limited opportunities to learn specialized knowledge in specific subjects. Thus, it is necessary to examine whether the same variables would yield similar results when using elementary school teachers as the sample. To address this shortcoming, this study will collect more data than Peterson et al. (1989) through a web-based survey of in-service teachers in elementary schools.
Second, previous research has examined only a limited number of psychological variables; in particular, only one of the beliefs, that on teaching and learning, have been addressed, and no attempt has been made to ask teachers about their formative evaluations using a questionnaire. Although teachers’ beliefs regarding instruction are known to be multidimensional, such as constructivist beliefs, which view learners as subjects who construct knowledge by themselves, and traditional beliefs, which view learners as objects whose knowledge is given under the control of teachers (Chan & Elliott, 2004; Ernest, 1989; Thompson, 1992), Blömeke et al. (2014) and Kunter et al. (2013) measured only constructivist beliefs and not traditional beliefs. Although Yang et al. (2020) examined both constructive and traditional beliefs, their study was conducted with pre-service teachers, so research examining the effects of both beliefs with in-service teachers is needed. Furthermore, considering that teachers’ beliefs may be difficult to target for direct intervention due to their difficult-to-change nature (Pajares, 1992), it is necessary to focus on the more intervenable variable of classroom teaching behavior as a related variable of PCK. Therefore, in addition to constructivist and traditional beliefs, this study focuses on formative assessment, especially test utilization strategy, as an instructional behavior of teachers and examines its relationship with PCK.
Beliefs
Beliefs have been regarded as one of professional competencies of teachers and as the foundation for effective teaching (Baumert & Kunter, 2013; Fives & Gill, 2014). Beliefs are defined as “psychologically-held understandings, premises or propositions about the world that are felt to be true” (Richardson, 1996, p. 103). Unlike mere knowledge, beliefs are unique in that they are general and abstract propositions that are accompanied by certainty for that person. In particular, beliefs about learning and teaching are based on teachers’ ideas of the nature, characteristics, and methods of learning and teaching as well as ideas regarding the roles of students and teachers.
On the beliefs about learning and teaching, there have been studies that distinguish between constructivist beliefs, in which students are considered to be “knowledge constructors,” and traditional beliefs (or transmission beliefs), in which students are considered to be “objects to whom knowledge is given by the teacher” (e.g., Chan & Elliott, 2004; Staub & Stern, 2002). These beliefs may influence what teachers learn from their classroom experiences (cf. Pajares, 1992). For example, a teacher with constructive beliefs may acquire knowledge for teaching by analyzing the causes of students’ difficulties in class and generating better explanations to promote their understanding. Several studies have demonstrated the relationship between constructivist beliefs and PCK (Blömeke et al., 2014; Kunter et al., 2013; Peterson et al., 1989). In addition, Yang et al. (2020) reported a positive correlation between constructive beliefs and PCK and a negative correlation between traditional beliefs and PCK, although the study was conducted on pre-service teachers. Therefore, we hypothesize that, as Yang et al. (2020) observed among pre-service teachers, the stronger the constructivist beliefs are, the higher the PCK scores will be, and the stronger the traditional beliefs are, the lower the PCK scores will be among in-service teachers as well.
Test utilization strategy in formative assessment
Formative assessment is one of the strategies for using tests to improve teacher instruction and student learning (Black & Wiliam, 1998). Formative assessment is “all those activities undertaken by teachers, and/or by their students, which provide information to be used as feedback to modify the teaching and learning activities in which they are engaged” (Black & Wiliam, 1998, p. 7). In formative assessment, the teacher uses test results and other information to understand what students are struggling with, and then provides feedback to students about their errors and how to overcome them, as well as using this information to modify the teaching and learning activities in which they are engaged (Black & Wiliam, 1998; Wiliam & Thompson, 2008). Through these activities, teachers would acquire PCK. In fact, some studies have pointed out the relationship between formative assessment and PCK (e.g., Schildkamp et al., 2020; Xu & Brown, 2016).
In Japanese elementary schools, unit tests are commonly used in math classes. These tests are given over a relatively short span of time, sometimes every few hours. However, since the discretion is on the teacher to decide whether to utilize the results of the unit test in the next unit of math classes, there are individual differences in the degree to which the test results are utilized as formative assessment. Therefore, Fukaya and Suzuki (2020) developed test utilization strategy scale to measure the extent to which tests are effectively used to improve learning and teaching as formative assessment and reported its validity and reliability.
The test utilization strategies scale consisted of two components. The first focused on whether teachers utilized test to improve students’ learning by, for example, explaining their errors in tests to students (assessment for students’ learning improvement). The second was assessment for teachers’ teaching improvement, which involved determining what problems existed in their own classes based on students’ errors and using them to improve their teaching. Through exploratory factor analysis based on data from a web survey of 512 Japanese elementary school teachers, two components were combined into one factor. The alpha coefficient of test utilization strategy was .90, which was high enough. Moderate positive correlations were found with teacher metacognition (rs = .49–.61), autonomous motivation such as Integrated Regulation (rs = .32–.36), teacher efficacy (rs = .50), and constructivist conception (r = .42), while no significant correlation was found with traditional conception (r = −.08).
Although several studies have pointed out a possible relationship between formative assessment and PCK (e.g., Schildkamp et al., 2020; Xu & Brown, 2016), there has been no attempt to quantitatively examine the relationship between them. Therefore, this study examines the relationship between the test utilization strategy scale developed by Fukaya and Suzuki (2020) and PCK scores.
The purpose of this study is to examine the relationship between PCK in mathematics and several teacher variables through a web-based survey of Japanese elementary school teachers. To date, most quantitative investigations of PCK have been conducted in the domains of mathematics and science (Ball et al., 2008). Because science comprises many different domains and is difficult to investigate with a single test, we chose to focus on teachers’ knowledge about teaching mathematics in this study. The teacher variables included gender and years of teaching as demographic variables, and constructivist and traditional beliefs and test utilization strategies as psychological variables. Correlation coefficient was used to examine the relationship between the PCK test scores and each variable. To examine the unique association of each variable, multiple regression analysis was also conducted with the teacher variables as independent variables and the PCK test scores as dependent variables (Figure 1).
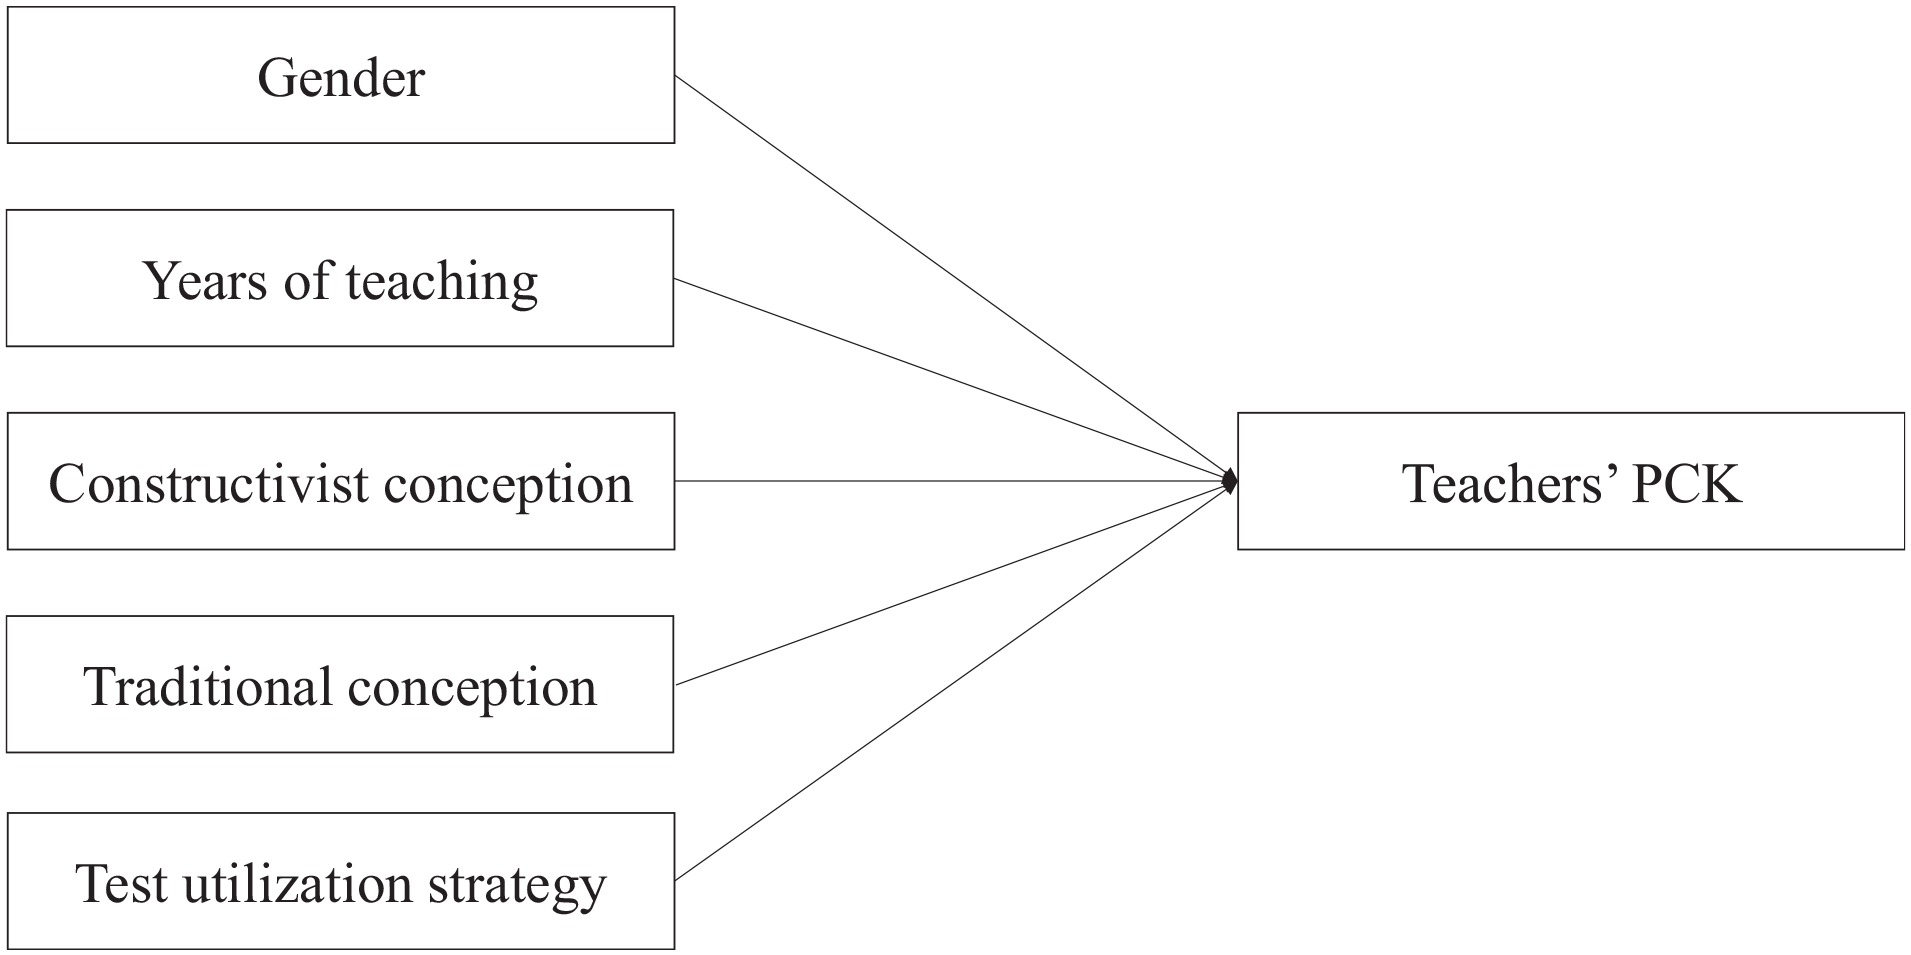
Hypothesized model of multiple regression analysis.
Method
Research Design
This study employed a one-point cross-sectional web-based survey design. Obtaining the data through a one-point cross-sectional survey allowed us to examine the correlation between PCK and teacher variables, such as whether teachers with more years of teaching experience or with higher scores on constructivist beliefs have higher PCK scores. A web-based survey also allowed us to collect a sample of hundreds of elementary school teachers from all over Japan.
Participants and Ethical Considerations
A web-based survey was conducted in January 2021 among the survey monitors of GMO Research, Inc. in Japan. Survey Monkey was used as the response system. In addition to 21 JPY for participation in the study, a reward of 50 JPY was given for answering one open-ended question to motivate participants to answer the PCK test. A maximum of 300 JPY was given to the participants for a total of six PCK questions. However, participants were informed in advance that they would not be rewarded if they wrote a response shorter than 20 words or including inappropriate content.
A web-based research company distributed this survey to elementary school teachers who were registered as monitors with the company in order to ensure that there was minimal bias in terms of gender, age, and prefecture of residence. In total, 383 participants (183 males and 200 females) who answered that they were “elementary school teachers” and “teach math on a daily basis” participated in the study.
Regarding to ethical considerations, we obtained consent for participation in the survey from each participant after having them confirm that they understood that their responses would be used for academic research, that the data would be processed statistically and no personal information would be disclosed, and that they could withdraw from the study at any time during or after the survey. In addition, an ethical review of the survey was conducted at the first author’s university, and approval for the survey was obtained (approval number 2020007).
Structure of the Survey
The survey consisted of screening questions, demographic information questions, psychological scale questions, and the PCK test. The items of the psychological scales and the PCK test were presented in a randomized order to avoid order effects.
Screening questions
In the screening, an instructional manipulation check (IMC) and the direct question scale (DQS) were administered to assess whether the participants read and answered the items properly. The IMC is a procedure used to determine whether the participants correctly read the instructional texts by presenting them with instructional texts that instruct them on how to respond in ways that do not result from intuitive response behavior (Oppenheimer et al., 2009). In this study, the following instructions were given to the participants: “When you have read this text, please do not answer any of the following questions (i.e., do not click on any of the options), and proceed to the next page.” The IMC was administered on the page between that collecting information on demographic variables and that posing psychological scale questions. For the DQS (Maniaci & Rogge, 2014), we inserted one item in the scale of conceptions of teaching and learning, such as “Please choose ‘Disagree’ for this item,” to determine whether the participants made the choices as instructed. After screening, we excluded 80 teachers who did not select correct answers for the IMC and DQS.
In addition, we screened whether respondents were truly in-service elementary school teachers by asking them to state the most recent math unit they taught and the grade they were currently teaching. We excluded three respondents who gave vague answers such as “I have been teaching many things” or who mentioned a non-existent unit such as “number and calculation.” We also excluded three respondents who answered that they were on maternity leave. In total, 297 respondents (138 men and 159 women) were included in the analysis.
Demographic questions
In the demographic information questions, we asked about gender, age, and years of teaching experience in elementary school. The number of participants in each age group were as follows: 62 in their 20 s (24 males, 38 females), 77 in their 30 s (35 males, 42 females), 77 in their 40 s (39 males, 38 females), and 81 in their 50 s (40 males, 41 females).
Psychological scale questions (conceptions of teaching and learning)
In the psychological scales (conceptions of teaching and learning, and test utilization strategy), the participants were asked to respond to each scale using a 5-point Likert scale (1: “Disagree,” 2: “Somewhat disagree,” 3: “Neither agree nor disagree,” 4: “Somewhat agree,” 5: “Agree”).
Regarding conceptions of teaching and learning, Chan and Elliott’s (2004) original scale had 30 items; however, to reduce the burden on the participants, the items were refined based on the results of Fukaya and Suzuki (2020), and 15 items were used in the survey. These items were selected according to the results of a reanalysis of Fukaya and Suzuki (2020) dataset. Specifically, items were selected with reference to the frequency distribution for each item. Furthermore, we eliminated items that were difficult for participants to understand, or that had redundant wording, selecting those items that had higher factor loadings. We validated the short scales based on a reanalysis of Fukaya and Suzuki (2020) dataset. The results of the confirmatory factor analysis showed adequate fit, CFI = .96, TLI = .95, SRMR = .06, RMSEA = .04 (90% CI [.01, .06]). In addition, descriptive statistics, alpha coefficients, and correlation coefficients between variables were checked for both the full version and the short version, and it was confirmed that there was no significant difference between them and that there were strong correlations between the full and short version (r = .93 in constructive conception and r = .95 in traditional conception). Although Chan and Elliott’s (2004) original scale was published in English, Fukaya and Suzuki (2020) used items that were translated from the original scale into Japanese and then reviewed and modified by a researcher specializing in English language education.
Constructivist conception consisted of six items, such as “Good teachers always encourage students to think for answers themselves,”“Learning means students have ample opportunities to explore, discuss and express their ideas,” and “Every child is unique or special and deserves an education tailored to his or her particular needs.” Traditional conception consisted of nine items, such as “Learning means remembering what the teacher has taught,”“Learning mainly involves absorbing as much information as possible,” and “Teaching is to provide students with accurate and complete knowledge rather than encourage them to discover it.”
Psychological scale questions (test utilization strategies)
The scale developed by Fukaya and Suzuki (2020) was used in this study. They developed items related to strategies for improving instruction and strategies for improving learning using research on formative assessment (Black & Wiliam, 1998; Wiliam & Thompson, 2008) as a reference. The strategies for improving instruction consisted of seven items, including “I conduct tests to identify the points students have difficulty understanding,”“I conduct tests to identify the causes of students’ misunderstandings,” and “If there is a question that has a low percentage of correct answers, I consider what the cause might be.” The strategy for learning improvement consisted of seven items, including “I give students feedback on the test so that they can see what they did wrong,”“When the test is returned, I give students feedback on ways to improve their learning,” and “I instruct students on how to review their tests.”
PCK test
After reviewing a sample of MKT tests (Ball & Hill, 2008), which are widely used in the literature to measure PCK for elementary school mathematics, we found the following problems: (1) some items were not covered in the Japanese curriculum and (2) the results of preliminary surveys of pre-service teachers showed that MKT tests could not distinguish between teachers’ PCK because most items showed high correct response rates. 1 In Japan, where the authors collected data, no test has been developed to measure teachers’ PCK quantitatively. Therefore, we developed new items based on the Japanese curriculum in this study. The descriptive scores and reliability of the test items were also examined to confirm whether the developed test is an appropriate measure.
A six-question descriptive test was developed and used to measure teachers’ PCK. Because Japanese teachers’ math ability is generally high (Hanushek et al., 2018) and math achievement (namely, CK) has been shown to have a high positive correlation with PCK (see Depaepe et al., 2013 for a review), we used a descriptive test, which is assumed to be more difficult to answer, rather than a multiple-choice test. Six items were used because it was assumed that increasing the number of items in the descriptive format test, which requires excessive workload in web surveys, would result in a low response rate and would not secure a sufficient sample. In fact, previous studies (Deutskens et al., 2004; Hoerger, 2010; Manfreda & Vehovar, 2002) have demonstrated that in web surveys, increasing the number of items (especially in descriptive format tests and tests that are difficult to answer) increases dropout rates and “don’t know” responses, which in turn reduces the sample size and distorts the results. In addition, because the number of items was limited to six, only knowledge of students was included in the measurement.
Referring to the existing PCK tests (e.g., Baumert et al., 2010; Isiksal & Cakiroglu, 2011 ; Jenkins, 2010 ; Tirosh, 2000), the first and fourth authors developed items, and the second and third authors reviewed their contents. To ensure content validity, questions were selected with reference to the Japanese National Curriculum to ensure that there would be no bias in terms of domain and grade (3–6 years; see Appendix). In Japan, several publishers publish textbooks based on the National Curriculum, which is approved by the Ministry of Education in Japan. In this study, the items were prepared by referring to mathematical textbooks commonly used in elementary schools in Japan.
Rich knowledge of students’ misconceptions is an important aspect included in Shulman’s definition of knowledge of learners. In fact, there are studies that have measured knowledge of students by asking them to list conceptual errors that children can exhibit (Lim-Teo et al., 2007; Tirosh, 2000; Watson & Nathan, 2010). In this study, teachers were asked to list the misconceptions that students may have about specific subject content in questions 1 and 2. In questions 3 and 4, teachers were asked to create problems to determine whether the students truly understood the content. To assess whether the students truly understood, it is necessary to use PCK, such as creating tasks that can identify the students’ misconceptions and contexts in which they can apply what they have learned. Baumert et al. (2010) also used a task related to the area of a parallelogram to measure knowledge of students in terms of where students failed to apply a formula for area. Questions 5 and 6 were designed to diagnose students’ problem-solving strategies. It is well known that one of the reasons learners fail to solve text problems is their superficial problem-solving strategies (Ryan & Williams, 2007). For example, students make arithmetic decisions based on keywords, such as “add up because it says ‘more’” (Lewis & Mayer, 1987). Diagnosing which strategies learners use has also been utilized to measure PCK (Isiksal & Cakiroglu, 2011; Jenkins, 2010). In questions 5 and 6, the teacher was shown the incorrect equation and answer along with text problems and asked about the cause of the error to see whether they would mention the possibility of the student using a superficial strategy.
Coding answers to the PCK test
The PCK test was scored based on the scoring criteria (see the Appendix for scoring criteria). One point was given for each statement that met the scoring criteria, and zero points were given for each statement that did not meet the criteria.
The fourth author coded questions 1 and 2, the third author coded questions 3 and 4, and the first author coded questions 5 and 6. To calculate the rater agreement rate, three graduate students majoring in educational psychology scored questions 1 and 2, questions 3 and 4, and questions 5 and 6, respectively. As a grading procedure, all members first confirmed the scoring criteria and then coded the data of 15 teachers as practice. Pairs of coders confirmed the discrepancies and discussed the discrepancies to achieve a mutual understanding of the grading criteria. After all remaining data were coded independently, the discrepancies were checked again, and the final coded scores were decided through discussion. When the inter-rater agreement rate was calculated, a high agreement rate was observed for most of the questions. The kappa coefficients for each question were .88 (Question 1), .81 (Question 2), .47 (Question 3), .92 (Question 4), .99 (Question 5), and .96 (Question 6).
The kappa coefficient for question 3 was .47, which was lower than that for the other questions. Question 3 asked the respondent to pose a question to check students’ understanding of proportionality, but the agreement rate seemed to be low as there was ambiguity among the coders regarding which problem could be considered similar to the original problem. Therefore, we clarified the definition of a similar problem as “a problem in which only either the numerical value or the object is changed.” The same two coders conducted the grading independently again and recalculated the inter-rater agreement, and the kappa coefficient was then 1.00.
Results
Calculating PCK Test Scores and Reliability
The mean values for each item of the PCK test and inter-item correlation coefficients are listed in Table 1. Note that the inter-item correlation coefficients were calculated using polychoric correlation rather than Pearson’s product-moment correlation coefficient. The polychoric correlation is the correlation between two observed ordinal variables, assuming an underlying joint continuous distribution (Holgado-Tello et al., 2010). The presence of floor and ceiling effects was evaluated, and no test items with extremely high or low means were found. Although the reason for this is not clear, the I-R correlation of question 3 was lower than that of the other questions. As there were some questions that showed a positive correlation with question 3, the scores of all questions were summed to obtain PCK test scores.
Item Means and Inter-Item Correlations for the PCK Test.

The reliability of the PCK test confirmed a certain level of reliability with α = .52 and ω = .57. The rationale for judging the value of this alpha coefficient to be at a certain level was explained from following three perspectives. First, the inter-item correlation was similar to that of the previous studies. For examples, Krauss et al. (2008) reported a reliability of α = .77 with 21 items, and Hill et al. (2004) reported a reliability of α = .62 with 20 items for Form A, α = .66 with 19 items for Form B, and α = .70 with 21 items for Form C among the three test sets. However, in the case of 20 items, the alpha coefficient is .78 even if the inter-item correlation is .15 (calculated from equation (19) in Okada, 2015). In this study, only six items were used owing to the limitation of the web survey, so the alpha coefficient was not as high as in previous studies, but the same level of inter-item correlation was obtained.
Second, alpha coefficients often have a cutoff point of .70 or higher, but that criterion is not substantive (Lance et al., 2006; Nunnally, 1967). In fact, in some literature, an alpha coefficient of .50 or higher is considered acceptable (especially in the early stages of research) (Hinton et al., 2004; Nunnally, 1967). According to Taber (2018), who conducted a review of research articles in science education, even values of alpha coefficients above .45 are sometimes considered acceptable or sufficient. Schmitt (1996) also pointed out that even reliability that is considered low by conventional standards may be useful. It has been repeatedly pointed out that there should not be a clear cut-off point because the expected value depends on the purpose, method, and conditions of measurement (Cho & Kim, 2015; Okada, 2015; Schmitt, 1996).
Third, because the PCK test is based on a wide variety of subject matter and teaching content covered in various grades of mathematics, it should not theoretically be expected to have the same inter-item correlations as a Likert-type psychological scale. If we prepare multiple items based only on specific subject content of specific grade level, the alpha coefficient could be higher, but this would reduce validity of the PCK test for the purpose of measuring a wide range of professional knowledge among teachers. For these reasons, we decided to adopt the measure of the PCK test in the following analysis.
Examining Relationships Between PCK Test and Other Variables
Next, we examined the relationships among variables other than the PCK test. For the psychological variables, we conducted a confirmatory factor analysis, referring to the factors reported in previous studies (Fukaya and Suzuki, 2020; Chan & Elliott, 2004). The results showed that there was an acceptable fit for each of the conceptions of teaching and learning, CFI = .91, TLI = .89, SRMR = .07, RMSEA = .06 (90% CI [.05, .07]), and test utilization strategy, CFI = .89, TLI = .87, SRMR = 0.06, RMSEA = .09 (90% CI [.08, .10]).
Table 2 presented the descriptive statistics for each variable. Data on gender and years of teaching were collected in a well-balanced manner to avoid bias of results. Furthermore, we discovered that Japanese elementary school teachers have strong constructivist beliefs but not as strong traditional beliefs, and that the test utilization strategy was actively used. The PCK test, which measures knowledge of students, yielded a score of 2.45 out of 6, indicating that even Japanese teachers, who are assumed to hold rich subject knowledge (Hanushek et al., 2018), do not necessarily have high PCK scores.
Descriptive Statistics for Each Variable and Correlation Matrix Between Variables.

Note. Gender is calculated as 0 for females and 1 for males.
p < .05. **p < .01.
The correlation coefficients were then calculated to examine the relationship between PCK and the teacher variables, which was the objective of this study (Table 2). Positive correlations with PCK test scores were found for constructive conception and test utilization strategy, and negative correlations were found for traditional conception. In contrast, no association with PCK test scores was found for gender or years of teaching.
Based on the fact that some significant correlations were found among the related variables, a multiple regression analysis was conducted with PCK scores as the dependent variable to examine the unique associations of the variables, controlling for the influence of other variables. Gender, years of teaching, constructive conception, traditional conception, and test utilization strategy were used as independent variables, and the analysis was conducted using the forced entry method. The results are shown in Table 3. The standardized partial regression coefficients for traditional conception were negative, and those for test utilization strategy were positive. These variables were shown to have a unique association with PCK test scores even after controlling for their associations with other variables.
Results of Multiple Regression Analysis.

Discussion
Elementary School Teachers’ Mathematics PCK and Its Association With Teacher Variables
In this study, elementary school teachers in Japan were asked to respond to a descriptive PCK test and questions on conceptions of teaching and learning and test utilization strategy, and the variables associated with PCK test scores were examined. The results showed that constructivist conception and test utilization strategy were positively associated with PCK scores, and traditional conception was negatively associated with PCK scores, while demographic variables such as gender and years of teaching were not associated with PCK scores. Multiple regression analysis revealed a positive partial regression coefficient for test utilization strategy and a negative partial regression coefficient for traditional beliefs.
In this study, two types of conceptions of teaching and learning were measured: constructivist conceptions, which consider students as “subjects who construct knowledge by themselves,” and traditional conceptions, which consider students as “objects who are given knowledge by the teacher” (e.g., Chan & Elliott, 2004; Staub & Stern, 2002). Teachers with a constructivist conception acquire rich knowledge of how students (sometimes incorrectly) approach math learning, for example, by trying to understand the needs of students and by actively providing opportunities for students to express their ideas (Savasci & Berlin, 2012). In contrast, teachers with traditional conceptions emphasize the importance of accurate recall of what the teacher has taught (Stipek et al., 2001). If higher scores of traditional conceptions represent a tendency to emphasize the transmission of accurate knowledge while failing to pay enough attention to how children construct knowledge, then we can assume that the stronger the traditional conception, the lower the knowledge of students’ scores will be, and the results of this study support this hypothesis.
Through test utilization strategy, we measured the extent to which teachers used the information obtained from the test to improve students’ learning and their own teaching as a teaching strategy for formative assessment (Fukaya and Suzuki, 2020). Students’ wrong answers of can provide a variety of information on what students misunderstood or how teachers can prevent such misunderstandings from occurring. However, for teachers to learn from their students’ errors, it is essential to diagnose and analyze them by identifying the causes of their misunderstandings and developing effective means to deepen students’ understanding (An & Wu, 2012; Carpenter et al., 1989; Tirosh, 2000). Teachers who scored high on this measure were more likely to use the test results to understand what students were struggling with and to consider why students made errors to improve their own teaching (Black & Wiliam, 1998; Wiliam & Thompson, 2008). Engaging in test utilization in formative assessment is expected to further promote the acquisition of PCK, particularly knowledge of learners. In fact, the present study found a positive correlation between test utilization strategy and PCK scores, which is consistent with this theoretical assumption.
In addition, this study conducted a multiple regression analysis with gender, years of teaching, constructive conceptions, traditional conceptions, and test utilization strategy as independent variables to examine the unique associations of the variables, controlling for the effects of other variables. Positive partial regression coefficients were found for test utilization strategy, and negative partial regression coefficients were found for traditional conceptions. In contrast, the partial regression coefficient of constructivist conceptions, which was significant in the case of simple correlation coefficients, was not significant. This suggests that traditional conception and test utilization strategy may be particularly important as unique associations, controlling for the effects of other variables.
In particular, the finding that test utilization strategies are positively and uniquely associated with PCK scores is a useful result to develop training programs to promote the PCK acquisition of in-service teachers. Formative-assessment-based interventions, in which teachers analyze students’ thought processes based on their erroneous test answers and then discuss whether similar misconceptions might occur in other units, could improve PCK scores (cf. An & Wu, 2012; Carpenter et al., 1989; Tirosh, 2000). Although it has been argued that PCK is necessary for effective formative assessment (Schildkamp et al., 2020; Xu & Brown, 2016), the possibility that formative assessments might promote PCK acquisition has been overlooked in earlier research. Since this study was a cross-sectional survey administered at one time point, the causal relationship between the two needs further investigation; however, this study suggests a new role for formative assessment in teacher learning.
When we examined associations with demographic variables such as years of teaching experience and gender, we did not find any association with PCK, unlike previous studies (Blömeke et al., 2008; Lee, 2010). A possible reason that years of teaching experience and gender did not affect PCK scores is that most teachers in Japan were recruited by an employment examination in which their CK and PCK are evaluated (OECD, 2005), and only those with a certain level of CK and PCK can become teachers in Japan. As it is known that selection weakens the correlation between the two variables, the lack of relationship between PCK and demographic variables in this study may be related to the Japanese teacher recruitment system. Another reason for the lack of influence of years of teaching experience is that there is no opportunity for in-service teachers in Japan to systematically learn PCK in schools. If in-service teachers were guaranteed the opportunity to acquire PCK in their professional training, their PCK scores would improve with more years of teaching experience. However, the actual results did not support this, which suggests that PCK is not automatically acquired with teaching experience. The results thus strongly suggest the need for elementary school teachers to systematically learn PCK in mathematics, either through training methods that have already been reported to be effective (Barnett, 1991; Dash et al., 2012; Peng, 2007) or through the formative-assessment-based methods suggested in this study.
Remaining Issues
Several issues remain to be addressed in this study. First, because this study was a cross-sectional survey at a single point in time, we could not clarify the detailed relationships among variables, including causal relationships. In this study, conceptions of teaching and learning and test utilization strategy were assumed to be the determinants of PCK, but it is also possible to theoretically assume the opposite causal relationship. In fact, Blömeke et al. (2014) reported from a longitudinal study of German pre-service mathematics teachers that PCK scores predicted subsequent belief scores, while belief scores did not predict subsequent PCK scores. While it is possible that beliefs influence the acquisition of PCK, it is also possible that PCK influences beliefs—that is, PCK and beliefs exist in a mutually influential feedback loop. As the participants in Blömeke et al. (2014) study were pre-service teachers, further research on in-service teachers that more elaborately clarifies the interrelationships among variables is expected.
Another issue is that, when PCK is measured by free writing, there is no golden standard for what statements should or should not be scored (Chick, 2012). In scoring knowledge of students in this study, we referred to previous studies (e.g., Isiksal & Cakiroglu, 2011; Jenkins, 2010; Lim-Teo et al., 2007) to define scoring criteria (see Appendix). However, some arbitrariness remains in the extent to which scoring is applied. For example, in the present study, we focused on students’ errors using superficial problem-solving strategies based on the keywords in the text, but we could have focused on other students’ difficulties using the same problem. Therefore, further research on a valid scoring system would be needed.
The third issue to be addressed is whether similar results can be obtained for other elements of PCK, such as knowledge of instructional representations, as the present study dealt with only a limited element of PCK, that is, knowledge of students. For example, a teacher with a strong traditional conception may view students as objects to be controlled and, therefore, may not provide opportunities for students to express their ideas in class (Stipek et al., 2001); as a result, they may not be able to acquire knowledge of students. In contrast, even if a teacher has a strong traditional conception, he or she must still give explanations about the content of the lesson; thus, traditional conception may not be relevant to knowledge of instructional representations. Therefore, even with the same beliefs, the possibility exists that the representations constructed by the teacher may differ depending on different elements of PCK. It is necessary to examine this possibility in the future by conducting a survey that measures both elements of PCK.
Conclusion
In conclusion, in this study, we administered a PCK test to in-service elementary school teachers in Japan to measure knowledge of students and examined the related factors. The results showed that demographic variables such as years of teaching experience and gender were not associated with PCK test scores, while psychological variables such as conceptions of teaching and learning and test utilization strategy were either positively or negatively associated. The results suggest that it is necessary to examine the relationship between psychological variables with strong potential for intervention to investigate potential strategies to increase teachers’ PCK. In particular, the findings of this study are significant in that they found associations with conceptions of teaching and learning and test utilization strategy, even in the case of in-service elementary school teachers, who have rarely been studied in the past. Further research is required to clarify the details of the mechanisms acting between these variables.
Footnotes
Appendix
PCK test items in this study.

| No. | Grade/area | Test item | Evaluation criteria |
|---|---|---|---|
| 1 | Sixth grade/geometry | The figure below shows the definition of an axial symmetry figure from a sixth-grade textbook. What do you think sixth-grade students might misunderstand about this summary? Please write your answers as specifically as you can and the reason why you think so. |
Scoring criteria: specifically states the misconceptions (false generalizations based on the information given) that the child may exhibit |
| Examples of correct answers: “They might think that there is always only one axis of symmetry,”“The axis of symmetry cannot be drawn diagonally.” | |||
| Examples of incorrect answers: “They can’t imagine the folded state.” | |||
| 2 | Third grade/numberand calculation | The figure below shows a summary of fractions in a third-grade textbook. What do you think third-grade students might misunderstand about this summary? Please write your answers as specifically as you can and the reason why you think so. |
Scoring criteria: specifically states the misconceptions (false generalizations based on the information given) that the child may exhibit |
| Examples of correct answers: “They don’t realize that the tape is 2/3 even when it is folded horizontally,”“They don’t understand the problem when only the right part is colored.” | |||
| Examples of incorrect answers: “Cannot correctly distinguish between the denominator and the numerator” | |||
| 3 | Fifth grade/function | Fifth-grade students who learned the definition of proportional relation wrote the following as a summary of the class. To check whether the student has really understood the content of this summary, I would like to give them some problems. What problems would you create? Please write your answers as specifically as you can and the reason why you think so. |
Scoring criteria: Questions are designed to assess students’ understanding by checking for misunderstandings and giving students application tasks rather than giving them examples similar to the given examples |
| Examples of correct answers: “Ask the students to judge whether something that doubles or triples on one side but does not double or triple on the other side is proportional or not,”“Ask the students to find things around them that are proportional.” | |||
| Examples of incorrect answers: Problems where the numbers are simply changed, or problems where the items (i.e., bricks) are simply changed | |||
| 4 | Fourth grade/geometry | Fourth-grade students who learned the definition of a trapezoid wrote the following as a summary of the class. To check whether the student has really understood the content of this summary, I would like to give him/her some problems. What problems would you create? Please write your answers as specifically as you can and the reason why you think so. |
Scoring criteria: Questions are designed to assess students’ understanding by checking for misunderstandings and giving them application tasks rather than giving them examples similar to the given examples |
| Example of a correct answer: “Present a trapezoid with a different orientation and ask if it is a trapezoid.” | |||
| Example of an incorrect answer: Problem asks students to reproduce the definition of a trapezoid | |||
| 5 | Third grade/numberand calculation | A child in third grade answered “703 g” for “58 + 45 + 600 = 703” to the following problem: “Forty-five balls weighing 58 grams each are placed in a basket weighing 600 grams. How many grams are they together?” What do you think is the cause of this child’s mistake? Please write your answers as specifically as you can and the reason why you think so. | Scoring criteria: Mentions that the student is using a superficial problem-solving strategy (the key word “together” suggests that the problem is additive) |
| Example of a correct answer: “The word ‘together’ makes him or her think of addition.” | |||
| Examples of incorrect answers: “Because they didn’t read the question carefully.” | |||
| 6 | Fifth grade/numberand calculation | A child in fifth grade answered “2375 yen” for “950 × 2.5 = 2375” to the following problem: “The price of a book is 2.5 times the price of a magazine, namely 950 yen. What is the price of a magazine?” What do you think is the cause of this child’s mistake? Please write your answers as specifically as: you can and the reason why you think so. | Scoring criteria: mentions that the student is using a superficial problem-solving strategy (the key word “times” suggests that the problem is multiplicative) |
| Example of a correct answer: “The word ‘times’ makes him or her think of multiplication.” | |||
| Examples of incorrect answers: “Because he or she doesn’t understand what the base number is.” |
Acknowledgements
We are grateful to Kaoru Koike, Masaya Iwamoto, Taisei Ohnishi, and Hinako Naruse for their help with data coding, and Rieko Shinogaya with translation check of questionnaire items.
Declaration of Conflicting Interests
The author(s) declared no potential conflicts of interest with respect to the research, authorship, and/or publication of this article.
Funding
The author(s) disclosed receipt of the following financial support for the research, authorship, and/or publication of this article: This work was supported by JSPS KAKENHI Grant Number 19H00616 and 19K21773.