
Abstract
Peer acceptance has been consistently linked with academic performance. Acceptance, however, is often a measure of overall peers’ impressions of a child, and not their own interest in being friends. Friendship nominations reflect a stronger, more persistent, peer endorsement than acceptance, and rejection nominations, similarly, reflect more direct negative feelings. In addition, most data on these relationships are from schools with children from middle class backgrounds who are predominantly White. This study focuses on friendship and rejection nominations among a sample of predominantly African American children (N = 221) from low socioeconomic backgrounds in a large city in the Northeastern United States. All students in 10 classrooms from Grades 3 to 5 (n = 123) and 6–8 (n = 98), completed friendship and rejection measures, as well as standardized academic achievement tests, each Spring for 2 years. Reading and math scores increased for both groups over time. Friend and rejection nominations increased over time for younger students but decreased in the older group. Among younger students, friend nominations in the first year were related to reading performance in the second year. However, there were no relations between social variables in Year 1 and standardized test scores in Year 2 within the older grade group. Thus, focusing on both social and academic involvement in the elementary years may help improve student performance.
Keywords
Acquiring skills to navigate peer relationships and to achieve academically in school are the cornerstones of the developmental tasks of early and middle childhood (Legkauskas & Magelinskaitė-Legkauskienė, 2019). The association between these two tasks have been investigated since at least the 1980s (e.g., Hartup, 1989) and has been consistently linked to each other in early and middle childhood (García Bacete et al., 2021). However, there are multiple ways of measuring peer relationships (Guo et al., 2018; Ladd et al., 1997), as well as academic achievement (e.g. grades vs. standardized tests; García Bacete et al., 2021). The definition of which type of peer relationship is assessed and which measure of achievement is examined has a substantial impact on the strength and persistence of the association between peer relationships and school achievement (Beazidou & Botsoglou, 2016; Kingery et al., 2011; Oberle & Schonert-Reichl, 2013). Given that the majority of studies on these variables is within a homogenous population of White, middle-class students, it is important to understand the potential of peer relationships to support academic achievement among understudied populations, which in this case is African American students in an urban, low-income school.
The majority of data supporting the association of peer relationships and achievement emerges from studies of classroom social acceptance and rejection (García Bacete et al., 2021). Acceptance reflects how well a group likes someone. To assess acceptance, one of three approaches are adopted: students are shown pictures of all classroom peers and link positive, negative, or neutral feelings toward each peer; teachers rate acceptance among students, or observers rate a behavior to indicate positive affect toward another student (Beazidou & Botsoglou, 2016). In contrast to acceptance, friendships reflect strong emotional ties among peers with relatively equal power (in contrast to parent-child or teacher-child relationships; Beazidou & Botsoglou, 2016). Friends seek each other out, adapt and coordinate their behavior patterns, and often have engaging interchanges, that provide both a positive sense of togetherness and/or conflict. Importantly, social acceptance and rejection have been linked to school achievement (Guo et al., 2018; Wentzel & Caldwell, 1997; Wentzel et al., 2021), with strong, but different rationales about how peer relationships build cognitive, emotional, and behavioral skills that lead to lifelong success (Ladd et al., 1997). Acceptance and rejection have also been linked to concepts of prosocial behaviors and social competence, as mediators of the association between acceptance or friendships and school achievement. In this study, we focus on friendships among students in Grades 3 to 8 to examine their impact on achievement.
Positive peer relationships, whether acceptance ratings more broadly, or friendships, more specifically, have been conceptually and operationally differentiated from measures of social rejection (Véronneau et al., 2010). Rejected peers have fewer opportunities for social interactions that elicit skills for confronting novel situations, less perspective taking, and fewer instances of coordinating actions with others (Ladd et al., 1997). Students who experience rejection often are at risk for victimization, feelings of insecurity, mistrust, and behaviors that are withdrawn or aggressive (Ladd et al., 1997). When examining peer relationships and school achievement, it is critical to assess both dimensions of friendships and rejections by peers.
The current literature has found developmental differences in the relationship between peer relationships and achievement. Yet, few studies have investigated this connection over time (Elias & Haynes, 2008; Wentzel & Caldwell, 1997). By adolescence, peer relationships appear to acquire increasing importance and have far more power on influencing adjustment (Elias & Haynes, 2008; Gremmen et al., 2019; Laninga-Wijnen et al., 2019). It is less clear if this is a consistent linear increase in the power of peer relationships from early to middle childhood. If so, we would expect that the relationships would be stronger in middle school (Grades 6–8) than in elementary school (e.g., Grades 3–5).
Given the long-term interest in children’s social relationships (Asher et al., 1979), it would be expected that the associations between peers and achievement would be well specified. Unfortunately, our understanding of this association continues to evolve. Most of the studies have utilized teachers’ evaluations (grades) as the measure of achievement (Chiekem, 2015; Wentzel et al., 2021). Since standardized tests are one measure of more global student academic achievement, they were used in this study to get a broad picture of student mastery of grade-level academic content. This is a particular problem among Black students, as there is substantial evidence of structural bias in teachers’ perceptions of low-income African American students (Copur-Gencturk et al., 2020; Merolla & Jackson, 2019). Given potential bias, this study uses standardized test scores of math and reading as the measure of school achievement.
Finally, most research on social relationships and school achievement are based on middle-class samples of predominantly White children (Deardorff et al., 2019). When the experiences of African American students are studied, it is often in the context of examining cross-ethnic relationships, acceptance, friendship, and achievement (e.g., Graham & Cohen, 1997; Risi et al., 2003). In this study we are examining the link between friendships, rejection, and academic achievement in a school with almost all African American and biracial children (85%) in a low-income neighborhood over 2 years across both elementary and middle-school aged students. The specific research questions guiding this study were:
Were children’s friendship and rejection nominations by peers significantly associated with concurrent academic achievement and academic achievement the following year?
Were there grade group differences in the associations between friendship/rejection nominations and academic achievement?
Was academic performance in Year 2 predicted by friendships/rejection nominations or academic performance in Year 1?
Materials and Methods
Participants
This study was completed as part of a whole school initiative to better understand the social involvement of students across grades three through eight in one urban elementary school (Grades K-8). Standardized test scores were only administered from third through eighth grade; therefore, we only included those grade levels in this study. However, in order to follow students over two consecutive years, students who were eighth-graders in the first year could not be included in the study as they graduated before the second-year assessment point. Thus, there were 10 classrooms in the school in Grades 3 through 7 (two classrooms per grade) that were recruited to be evaluated as part of this project. All students in the school completed the assessments as part of their normal school activities, and the university IRB and school approved a passive parental consent, which was distributed to all students in those classrooms. No parents chose to remove their child’s data from the project, so social and academic measures were collected for all available students, and missing data are a result of student attendance on the days of assessment and movement of students in and out of the school across the 2 years.
Due to the small sample size within each individual grade, students were grouped into elementary (third through fifth) and middle (sixth through eighth) school grade groups to explore developmental differences at these two distinct school levels. There were 221 student participants in total, with 123 students in the elementary group and 98 in the middle-school group. Given that data collection occurred in the naturalistic school environment, there is missing data for different measures at different time points; the social measures in Year 2 were those missing most student responses (n = 104).
Students identified predominantly as African American or biracial (85.0%), and 1.8% were White, with 13.2% missing information on ethnicity. The gender balance was 44.3% males and 54.3% female (1.4% missing) and was similar across grade groups. Across the two grade groups, students’ mean age was 9.6 years (SD = 1.0) for the elementary group and 12.3 years (SD = 0.7) for the middle-school group.
Procedures
At the end of each academic year, students in all grades were administered a friendship survey in the classroom by their teacher, with researcher support, to identify peer relationships and social involvement in each classroom. This survey took approximately 20 minutes and was administered in a group format, with boards that served as barriers between students so all responses were confidential. Individual assistance was provided to any students who needed additional help in reading and/or writing. Friendship surveys were then coded by the study’s principal investigator. Students also took standardized state assessments in reading and mathematics as part of their standard school practice.
Measures
Friendship survey
The friendship survey asked students to identify with whom they liked to hang out (friend nominations) and classmates with whom they did not like to hang out (rejection nominations). Children were instructed to nominate classmates as their friends using free recall to assess the salience of each student in the classroom. Children were allowed to nominate as many or as few children as they preferred (some children listed no classmates while others listed nearly all classmates as a friend).
State standardized academic test scores
Standardized test scores were administered in all schools within this state. The tests were used in Grades 3 through 8 to measure achievement levels in reading and mathematics relevant to each grade level, with higher scores indicating better achievement in each area. The content of the test was matched to state standards for the grade, so test scores represent how much students are mastering the content each year. Scores ranged from 800 to 1783: and were grouped by the state into four categories based on the distribution of scores across all students in the state taking the test each year: Below Basic, Basic, Proficient, and Advanced. For clearer analysis, student scores were collapsed into two categories to look at students who were successful in academic achievement (those achieving Basic or above) compared to those scoring Below Basic.
Data Analysis
First, the rates of students achieving Below Basic status on both reading and math standardized test scores were compared for the two grade groups using a χ2 test. Pearson product moment correlations were conducted among social and academic measures for each grade group. To examine grade differences in reading and math achievement, the mean differences were compared using a repeated measures analysis of variance (ANOVA). An analysis of covariance (ANCOVA) was conducted to examine grade differences on measures of friendship and rejection, controlling for class sizes and gender. In these analyses, time (Year 1 and 2) was a within-subjects factor, grade group status was entered as a between-subjects factor, and a time by grade group interaction was conducted. Finally, multiple linear regressions were conducted examining Year 2 achievement scores as a function of Year 1 achievement scores, with friendship and rejection nominations within each grade group. These regressions were also run controlling for class size and gender, but including those variables did not change the results, so the original regressions are reported.
Results
Friend and Rejection Nominations
Table 1 reports the mean number of friendship and rejection nominations and math and reading scores by grade group level and time, as well as the percent of students who scored within the Below Basic category in both reading and math in both years. Friend nominations did not vary by gender, F(1,76) = 0.24, p = .623, but there was a time by class size interaction, F(1,76) = 4.59, p = .035, η2 = .057, which means that friendship nominations varied by the number of students in the class each year. There was not a statistically significant time by grade level interaction, but the number of friend nominations did tend to increase over time for the lower grade levels, F(1,76) = 3.33, p = .072.
Friendship and Standardized Test Scores by Grade Group Over Time.

Statistically significant differences were found between grade groups in Year 1 (reading standardized test scores were significantly lower for students in Grades 3 to 5 relative to students in Grades 6 to 8; the percentage of students scoring Below Basic in reading scores was also significantly higher in the younger grade group than in the older).
Statistically significant differences were found between grade groups in Year 2 (more rejection nominations in earlier grades than in older grades in Year 2; lower reading standardized test scores in younger versus older grades; lower percentage of students achieving Below Basic math scores in younger versus older grades in Year 2).
Students in Grades 3 to 5 had statistically higher math standardized test scores in Year 2 versus Year 1.
Students in Grades 6 to 8 had statistically higher math standardized test scores in Year 2 versus Year 1.
There was not a statistically significant change in rejection nominations over time overall, F(1,76) = 0.68, p = .412, nor a gender, F(1,76) = 3.04, p = .083, or class size interaction, F(1,76) = 0.70, p = .406. There was, however, a statistically significant effect by grade group, F(1,76) = 8.12, p = .006, η2 = .096, with significantly higher rates of rejection in Year 2 for early grades relative to the older grade group.
Correlations Between Social Relationships and Standardized Test Scores
The correlation between friend and rejection nominations and reading and math test scores for each grade group for Years 1 and 2 are reported in Table 2. Children’s friend nominations in Year 1 were predictably correlated with friend nominations in Year 2, but they were only statistically significant for the younger grade group relative to the older grade group. Friend nominations in Year 1 were statistically related to reading achievement in Year 1 and 2 for the younger grade group, and reading and math in Year 1 and math in Year 2 for the older grade group. Among the older grade group only, rejection in Year 1 was statistically correlated with more friend nominations in Year 2. Reading and math test scores were positively correlated for both grade groups across both years. Among the younger grade group, higher reading scores in Year 1 were correlated with more friend nominations in Year 2. However, there were no relations between these two variables for the older grade group. Instead, within the older grade group, higher reading scores in Year 1 were correlated with higher numbers of rejection nominations in Year 2. Similarly, higher math scores in Year 1 were correlated with more rejection nominations in Year 2 for the older grade group. All other correlations between social and academic variables were not statistically significant.
Correlations Between Social Outcomes and Standardized Reading and Math Test Scores for 3rd to 5th Graders (Top Row) and 6th to 8th Graders (Bottom Row).

p < .05. **p < .01.
Reading and Math Scores
More students in grades three through five achieved Below Basic reading scores in Year 1 (63.3%) compared to the older grade group (39.3%). However, fewer younger students were Below Basic for math scores in Year 2 (17.7%) compared to older students (34.4%). Reading test scores increased over time for students in all grades, F(1,137) = 74.41, p < .001, η2 = .352. Furthermore, there was a statistically significant main effect for grade group, F(1,137) = 6.21, p = .014, η2 = .043, where students in the older grade group scored significantly higher in reading scores than those in the lower grade group. Math scores also increased statistically over time for the overall sample, F(1,137) = 36.92, p < .001, η2 = .212, but there was no effect of grade group for math.
Reading and math scores in Year 2
Tables 3 and 4 summarize the results of multiple regression analyses on standardized reading and math test scores in Year 2, on the basis of Year 1 friendship/rejection nominations and reading and math scores. Table 3 represents these relationships for the elementary school grade group, and Table 4 represents the middle school grade group. Within the elementary grade group, the overall regression for Year 2 reading test scores was statistically significant, F(3,75) = 39.10, p < .001; R2 = .620. We can explain 62% of the variability in Year 2 reading scores based on Year 1 reading scores (F = 9.74, p < .001) and friendships in Year 1 (F = 2.30, p = .024). The overall regression for Year 2 math test scores within the elementary grade group also was statistically significant, F(3,77) = 6.01, p < .001; R2 = .196. We can explain almost 20% of the variability in math scores in Year 2 by math scores in Year 1 (F = 3.80, p < .001), but not by ratings of their friend nor rejection nominations.
Regression Analyses With Standardized Test Scores in Year 2 for Elementary Grades (3rd–5th).

Note. R = .787, R2 = .620, Adjusted R2 = .604, SE of the estimate = 115.374. F(3,75) = 39.10, p < .001. R = .442, R2 = .196, Adjusted R2 = .163, SE of the estimate = 211.205. F(3,77) = 6.01, p < .001. *p < .05, **p < .01.
Regression Analyses With Standardized Test Scores in Year 2 for Middle Grades (6th–8th).
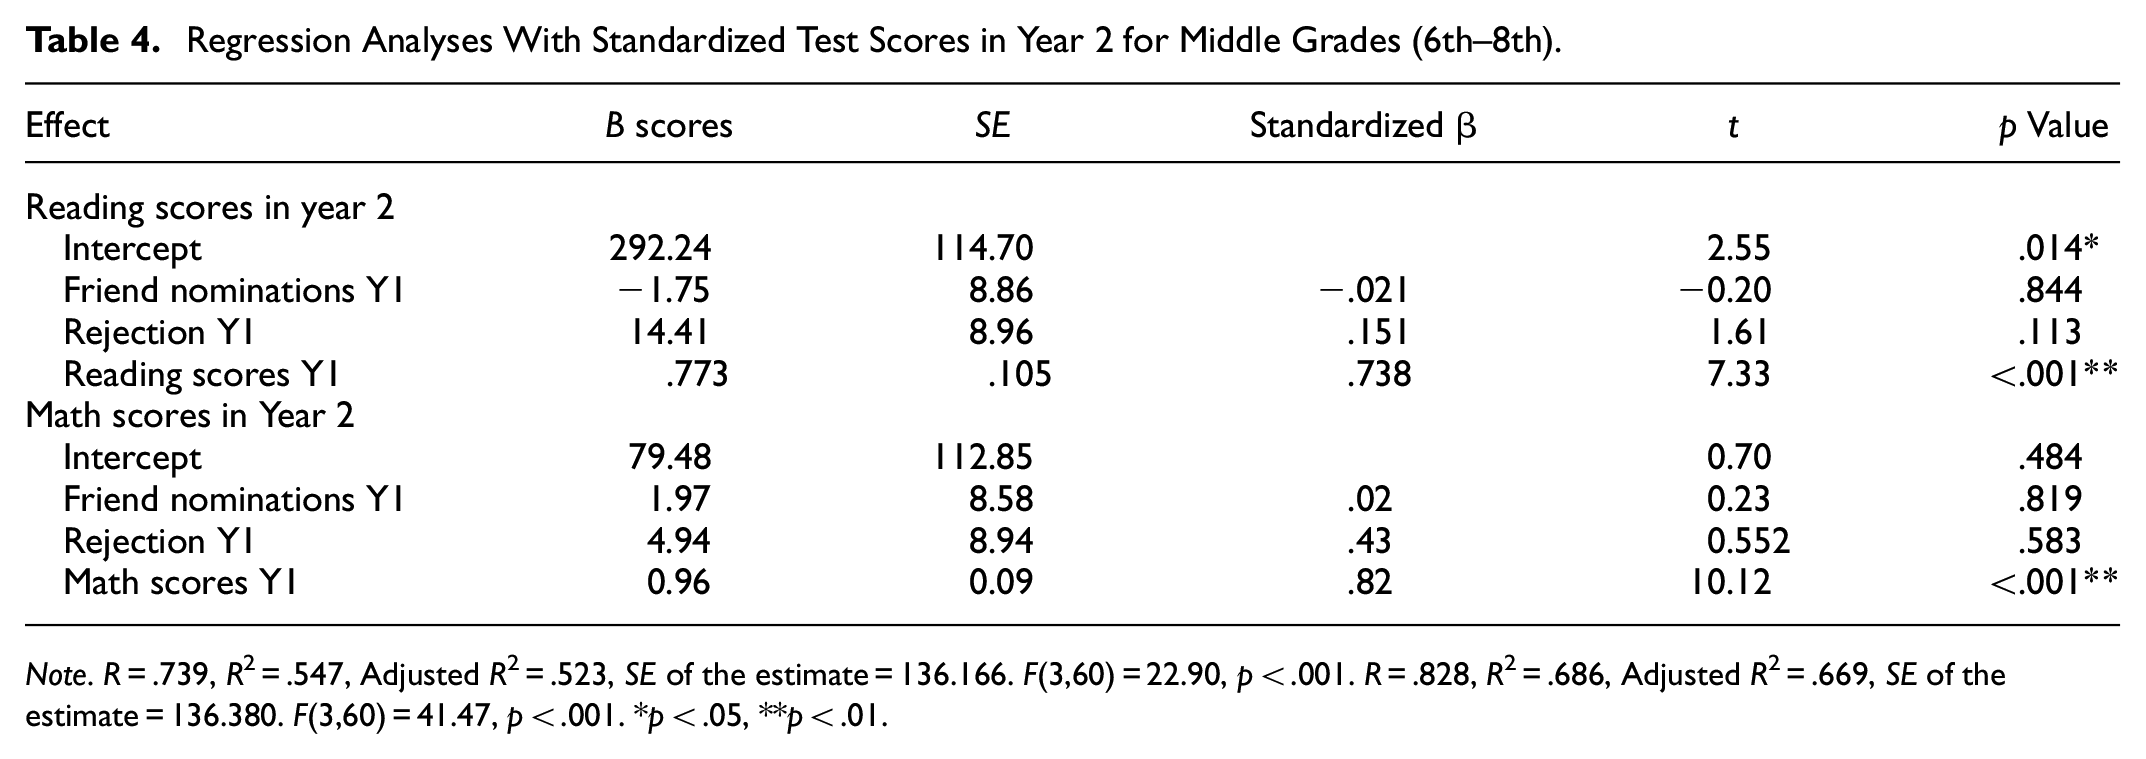
Note. R = .739, R2 = .547, Adjusted R2 = .523, SE of the estimate = 136.166. F(3,60) = 22.90, p < .001. R = .828, R2 = .686, Adjusted R2 = .669, SE of the estimate = 136.380. F(3,60) = 41.47, p < .001. *p < .05, **p < .01.
Within the middle school grade group, the overall regression for Year 2 reading test scores was statistically significant, F(3,60) = 22.901, p < .001; R2 = .547. We can explain 55% of the variability in Year 2 reading scores based on Year 1 reading scores, F = 7.33, p < .001, but not by friendship/rejection nominations. The overall regression for Year 2 math test scores within the middle school grade group was also statistically significant, F(3,60) = 41.47, p < .001; R2 = .686. We can explain almost 69% of the variability in math scores in Year 2 by math scores in Year 1 (F = 10.12, p < .001), but not by friendships/rejections from peers.
Discussion
Early achievement in elementary and middle school is critical for lifelong success. For example, Hernandez (2011), found that students who did not read proficiently by third grade were 4 times less likely to graduate by age 19 than students who read at grade level. Similarly, Duncan et al. (2007) revealed that mastering early math concepts was the strongest predictor of later academic success, followed by mastering language concepts. Given that peer relationships may be a strategy to enhance achievement, this study aimed to determine if the associations between peer friendships/rejections and standardized test scores were significant across two school years for students in Grades 3 to 8.
Overall, the associations between academic and social measures appeared to be different for each grade-group. In early grades, there were more associations between social and academic measures, with friendship nominations in the first year related to reading performance on standardized tests in the second year. However, in the middle school grades, the connection between social and academic variables was less apparent across time.
Among students in third to fifth grade, both friendship and rejection nominations increased over time. This was an expected developmental trend, as students are expanding their social networks and learning about themselves and their peer groups with age (Gifford-Smith & Brownell, 2003). There also was a direct inverse association between friendship and rejection nominations, where some students had a higher number of rejection nominations, while others had more friendship nominations.
Within the early grades, achievement measures (i.e. reading and math scores) also increased over time. Yet, there was a wide range of student performance on these tests, with 17.7 to 63.3% performing in the Below Basic category on the achievement tests at different times. Improvements from Year 1 to Year 2 in achievement scores were encouraging. Students clearly appear to be improving as a result of instruction over time. Examining the predictors of academic achievement scores in Year 2 also support the role of instruction in improving scores. Academic scores in Year 2 were predicted by academic scores in Year 1 in both reading and math.
Reading scores in Year 1 were correlated with friend nominations in Year 2, though. In the regression analysis, reading scores in Year 2 were also related to friend nominations in Year 1, but only for the elementary grade group. A connection was found between friend/rejection nominations and academic measures in Grades 3 to 5 that was not sustained in Grades 6 to 8.
In the older grade group, friend and rejection nominations both decreased over time, which would be expected, developmentally, from middle-school students who are forming stronger, but smaller cliques of friends and not paying as much attention to those who are not in their own friend group (Gifford-Smith & Brownell, 2003). In fact, higher rejection in Year 1 was correlated with more friend nominations in Year 2, so there is clearly a shift in friendships within this grade group over the 2 years.
Reading and math scores for the older group increased over time similarly to those of the younger grade group, with fewer students performing in the Below Basic range in Year 2 than in Year 1. Students were clearly benefitting from instruction and improving in their test scores. Students in the older grade group also performed statistically better than younger students in reading in Year 1 and math in Year 2, so their increased exposure to the curriculum and test-taking practice over time may have helped them perform better on these standardized tests.
There were unexpected relations between academic test scores and rejection among this group, however, where higher reading and math scores in Year 1 were correlated with more rejection nominations in Year 2. Although there is evidence that rejection often is associated with poorer academic performance (Arslan, 2016; Greenman et al., 2009; Wentzel, 2017), there also is literature to suggest that peer belonging may impact academic motivation (Goodenow & Grady, 2010) and that academic focus is a byproduct of the school climate (Goddard et al., 2000). There may be an increased social value in not performing well; however, given the correlational nature of this exploration, this finding may only reflect a shifting student population across the 2 years, without any direct causal implications.
In elementary school, there is still lots of forming and changing of social and academic skills (Sørlie et al., 2021). The connection between friendship nominations in Year 1 and higher reading scores in Year 2 may reflect a growing social and academic identity during this time. This suggests that it may be important to focus on social involvement as well as academic skills to promote high-achieving, socially successful students. The fact that this correlation existed amongst elementary-aged students but not middle-school students also suggests that this focus on social skills should occur earlier with all students, while these social and academic skills are forming.
Limitations
This study occurred in a public-school setting with naturally occurring missing data between Year 1 and Year 2 for students who changed schools or were absent on evaluation days. While this could not be controlled, the missing data may leave gaps in our full understanding of the sample and the connections between variables over time. This school, in particular, had many students who were not performing well on standardized tests. In future studies, it would be helpful to include schools with more high-achieving students to see if the same relations with friendship/rejection indices exist. It would also be important to examine more deeply the causal connections between social and academic measures, and whether positive social development among children can build confidence toward educational resiliency over time. This study does, however, reflect the best efforts to gather information from a naturalistic setting and examine the utility of social and academic indices to predict academic performance over time.
The sample in this study was students from one urban public school and does not represent all urban students. Additional studies should look at these social indices to see whether students experiencing academic challenges may be identified earlier by peers. In addition, this study only examined students in third through eighth grade. Students in earlier and later grades are likely to have different social relationships because of their developmental stage, and the relations between social and academic measures may be more prominent or distinct (especially within older samples of high-school students).
Conclusion
There were minimal relations between social and academic scores among students in older, middle-school grades, but there was a more substantial connection between friend nominations and academic scores among elementary-aged students. Older students may have established separation between their social and academic identities, whereas younger students may still be establishing their skills and involvement in both areas. Increased teacher focus on both academic and social areas among elementary-aged children may help promote a classroom culture of positive friendships and learning.
Footnotes
Declaration of Conflicting Interests
The author(s) declared no potential conflicts of interest with respect to the research, authorship, and/or publication of this article.
Funding
The author(s) received no financial support for the research, authorship, and/or publication of this article.
Data Availability Statement
The data that support the findings of this study are available on request from the corresponding author, ERF. The data are not publicly available as they contain information that could compromise the privacy of research participants.