
Abstract
The study compares the standardized test performance of “chess kids” versus their peers. The comparison of score gains to non-chess peers (same grade and same academic percentile) attempts to eliminate the chicken-and-egg issue that often muddles this topic, that is, does chess make kids smarter or do smart kids simply prefer chess. The data indeed confirm that chess players are generally of higher academic standing (chess kids are smart), but more importantly it statistically shows that learning chess increases a student’s academic performance (chess makes them smarter). The evaluation then digs deeper, by comparing kids who have learned perhaps a little chess (coming to chess club only) versus those that are more serious and play in U.S. Chess Federation (USCF)-rated tournaments. A variety of comparisons are made which show that the benefits of chess are strongly tied to “learning” the game; the more you learn, the more you benefit. Kids who come only to chess club receive a small (5%-10%) benefit in Math, whereas kids who play in rated tournaments gain substantially in Math (30%-50%) and significantly in Reading (10%-20%). The benefits also continue to grow as kids play more tournaments and/or increase their USCF chess rating.
When the question is posed “does chess makes kids smarter,” it is often hampered by a serious chicken-and-egg dilemma—does chess makes kids smart or do smart kids simply play chess? Indeed, kids who enjoy chess are probably more likely to be naturally “smart” (e.g., intelligent, sharp, logical, creative, etc.). Kids who participate in “voluntary” chess activities might be more likely to have parents that are more concerned with their child’s education and enrichment (a loose generalization of course). Hence, if one simply takes the average grades and/or standardized test scores of a chess player versus the average student, it could be expected that the chess players will have better results.
There are numerous studies and essays that have investigated the effect of chess on children (U.S. Chess Federation [USCF], 2006), and the overwhelming majority claim that chess provides significant benefits. Many of them are qualitative or anecdotal, and often promoted by chess advocates, but that does not necessarily mean that they should be disregarded—those who have witnessed the academic progression of serious chess kids over time do not need a statistical study to convince them of the benefits. Past studies have shown positive chess benefits as a whole, but there is no single study that provides overwhelming evidence on its own or fait accompli. A summary review paper by Bart (2014) provides an excellent listing of the most pertinent statistical studies. Bart concludes that overall the studies provide evidence that chess training has positive cognitive and education effects, but more rigorous research is needed to determine the extent to which learning chess benefits kids.
This study has four attributes that create compelling data and conclusive results. Large sample sizes (thousands of data points to create statistically significant results), direct peer comparison (students in the same school/grade in the same academic percentile), observational/verifiable data (e.g., not possible to influence or fudge), and measured levels of chess learning (e.g., tournaments played, rating increase). The latter, measure of learning, is perhaps the most important. Practical controlled experiments do not allow the ability to perform much more than an hour a week of passive chess training to students; so it is hard to know how much chess these kids are really learning.
Method
The basic approach of this observational study is to measure the increase in a chess student’s standardized test scores as compared with their peers (grade and pretest percentile rank). The study uses the test scores from a single elementary school, Aspen Elementary School in Los Alamos, New Mexico, extending over a period from 2007 to 2014. The standardized test scores used are New Mexico Standards Based Assessments (SBA) Measures of Academic Progress (MAP) scores; the MAP tests are generated by the Northwest Evaluation Association (NWEA). MAP scores are recorded three times a year—labeled as the Fall, Winter, and Spring trimesters. All of the analysis in the study was performed with Excel, and several Visual Basic macros were written to consolidate, evaluate, and format the data.
Study Groups
In this study, students are binned into three groups depending on their activities during the time interval prior to a given test score:
Non-chess—students who did not participate in chess club or play in a USCF tournament during the test interval;
Club-only—students who came to chess club and recorded at least one “ladder” game (a semi-formal club game) during a specific trimester, but did not play in a USCF-rated tournament.
USCF player—students who played in a tournament rated by the USCF, as recorded in the USCF online database.
Data Sets and Sources
The data for this study comprises four distinct sets:
The SBA MAP test scores for Aspen Elementary. These data are listed as a function of student ID number (SID) and includes all MAP scores from Spring 2007 to Spring 2014. There is a gap in the data from Spring 2012 to Fall 2013, as the Los Alamos school district did not utilize MAP testing for the 2012/2013 school year.
A Listing of school IDs for all chess players. To protect identities, the MAP test data are listed by student ID number only. To correlate data to a student, the school possesses a separate file that links student names with SID. Using this file, we compiled a new list that contained the SID of the chess players along with their USCF ID, which was then used to discriminate their MAP scores from the non-chess population.
The USCF Database. The USCF database includes every “rated” chess game played in the United States since 1991. The chess record was downloaded for all Aspen students that played in a USCF-rated tournament from 2007 to 2014.
The Aspen Chess Club Database. This is an informal database compiled by volunteers who ran the chess club. This database includes the chess “ladder” for 7 years from Fall 2007 to Spring 2014. The ladder ranks the players in chess club based on the number of points they accumulate over the school year, which can be obtained by playing games and/or completing lessons. These data are in large part unverifiable, but it is also not pertinent to any of the major conclusions reached in this study.
Nature of the Data
This study covers only one elementary school. This is a positive, perhaps a necessity, in terms of trying to discriminate the effects of chess, because all other factors are the same for each student—teachers, school system, community, and so on. This “uniformity” makes it reasonable to assume that external factors are similar for all kids within a peer group (grade and percentile).
The opportunity to perform this study was a result of the thriving Aspen Chess Club (from 50 to 75 kids per year) and the large number that took chess seriously enough to play in rated tournaments on their own accord. The latter may be an important factor for this study. There are times when rated tournaments are provided for kids as part of a school program, or are enabled by funding (entry fee and USCF membership) and/or transportation provided by the school or coach. Our experience and logic indicates that the kids who play in voluntary competitive tournaments are also the kids that are the most serious about learning chess (they study/learn in preparation for the tournaments, learn by playing at the tournaments, and are strongly motivated to improve in the days following the competition); of course, there are individual exceptions to this generalization. Within the Aspen Chess Club, there was a significant distinction, in terms of learning chess, between kids who played in rated tournaments and those who simply came on Thursday afternoons (some of the latter showed a genuine, albeit small interest in the game, whereas others were what we referred to as “day-care” members). The point is that being in a chess club alone does not automatically correlate to learning chess.
Overall, the size of the database evaluated is impressive. There are more than 12,000 total recorded MAP scores in the period evaluated (2007-2014), 6,123 scores in Math and 6,242 scores in Reading. The non-chess group is the largest (5,512 Math scores and 5,628 Reading scores) and can accurately be portrayed as the “control group.” Fortunately, there are enough students in the two chess groups, club-only and USCF player, to yield statistically significant results.
Table 1 shows the breakdown of how many unique students accounted for the Math scores (which is essentially the same breakdown for the Reading scores).
Number of Students in Dataset.

Note. USCF = U.S. Chess Federation; MAP = Measures of Academic Progress.
The first row of Table 1 is mostly irrelevant for this study because the variable in question is the change in MAP score (so there must be at least two data points). The number of students that took at least two MAP tests indicates how many data points might be available for a trimester-based point gain. The number of students that took at least four MAP tests generally indicates how many data points might be available for a year-over-year point gain. There are some exceptions where kids missed tests or MAP tests were not offered, causing a >1 trimester gap between tests, and in those cases scores were interpolated across the gap. The bottom line of Table 1 is that ~20% of all Aspen kids participated in chess club at some point, and ~10% of Aspen kids played in a USCF-rated tournament (69/526 or 13% of those attending Aspen for >1 year)—this allows for statistically powerful comparisons.
The percentile ranking within Aspen School of chess kids versus non-chess kids is plotted in Figure 1.

Percentile comparison of chess/non-chess kids within the Aspen school population.
One of the most notable conclusions from Figure 1 is that there is indeed truth to the second half of the chicken-and-egg dilemma “smart kids enjoy chess,” because even the kindergarten chess kids have a higher academic percentile rating. It is highly unlikely that chess could instantaneously change kindergarteners from 48% to 71%.
The most interesting feature of Figure 1 is the consistent rise of USCF players in Math year to year. This probably makes a strong case that the chess kids are progressing faster in Math than the others, but there could still be a chick-and-egg component; that is, do only the exceptionally bright kids continue on with tournament chess in the latter grades, whereas the others drop out? This is why a true peer-to-peer comparison is needed. Another observation of Figure 1 is that the club-only kids place in a significantly higher percentile than the non-chess kids, but their relative percentile is not changing year to year; this might indicate that they are not improving relative to their peers.
Treatment of Error
As part the MAP test data, the NWEA provides an expected error for every individual test score. The error quoted by the NWEA is the expected standard deviation for that particular student on that particular test, which the NWEA continuously evaluates for accuracy and pertinence (Wang, McCall, Jiao, & Harris, 2013). In this study, these individual standard deviations are propagated to calculate the estimated standard deviation of the averaged (mean) study results. The equations below are used to calculate test score gain, the mean test score gain, and the standard deviation of the mean:


where s is the test score, s0 is the test score for the same student from the previous time interval, g is the gain in test score, σ is the standard deviation, and n is the number of test scores in any specific bin or sample.
All of the errors listed on the tables of this study are calculated in the manner shown in Equation 3. Likewise, the error bars shown on bar charts represent this same standard deviation. Considering the large number of data points and the fidelity of the individual error estimates, it should be reasonable to assume a relatively normal distribution, with 1-sigma being equal to the standard deviation. In this scenario, a 1-sigma difference between scores provides 68% confidence against a null hypothesis, 2-sigma 95%, 3-sigma 99.7%, and so on.
For some of the results, an analysis of variance (ANOVA) was performed to provide an alternative metric to quantify the statistical validity of the results, that is, an alternative method that did not rely on the errors quoted by the NWEA. In all of these cases, the ANOVA separated the score gains of non-chess, chess-club-only, and USCF players into three groups, thus providing 2 degrees of freedom in the “numerator.” Other alternative analyses used linear regression as a separate method to differentiate the data, by creating curve fits of the entire data set. There may be questions concerning the validity of each statistical method as it specifically applies to these data, but in general all three of the approaches used, namely, (a) normalized confidence intervals based on standard deviation, (b) ANOVA, and (c) linear regression, indicated statistically significant results in one form or another.
Scoring Biases
Three major biases were found to have an impact on the expected point gain of a student: a trimester bias, a grade bias, and a percentile bias; the charts in Figure 2 display these biases.

Raw point gain by trimester, percentile, and grade.
Trimester bias
Test score gains are not uniform for each individual trimester. The biggest factor is probably the lack of math progression over the summer (and some case regression), and Winter may be slightly larger than Spring because of a quick regain of knowledge lost over the summer. Another factor could be that the number of days between tests is not uniform either—the smallest time gap is usually Winter-to-Spring. If the relative population of score groups changes from semester to semester, it will bias any data sets that average or combine the sum of gains across trimesters. Club-only kids are particularly affected by this bias, as there is no chess club in the summer; thus, by definition, no club-only kids associated with the Fall data.
Grade bias
The MAP scoring system is not linear with grade level—point gains are much larger in younger grades, notably kindergarten and first. This might be a combination of younger kids being able to absorb information quicker and a headroom effect (i.e., how much potential room for improvement a kid has until they have mastered the content of the test). Two data points in Figure 2 buck this trend. First graders gain more than the kindergarteners and the sixth graders outscore the fifth graders. The higher gains of the first grade might be because first graders are subjected to a more serious learning environment and their academic day is longer. The higher gains of sixth graders might be because the curriculum and the focus of the kids might be increased in anticipation of the move to middle school. Regardless of the reasons for the bias, the grade bias generally reduces the school-averaged score gain of chess kids because there are relatively few in kindergarten and first grade.
Academic percentile bias
The database clearly shows that students in the higher percentiles gain fewer points, and vice versa. This may be attributed to a sort of see-saw effect due to students occasionally overachieving and/or underachieving, although if this was a dominant factor there would be no difference between the gains in the middle two quartiles (which Figure 2 refutes). More likely, the reason for the bias is that points are easier to gain at the lower end of the knowledge spectrum (i.e., more headroom for improvement), similar to the fact that lower grades outgain upper grades. Regardless of the reason, there is a marked difference in points gained as a function of starting percentile. This bias significantly reduces the school-averaged score gain of chess kids because they tend to be in the higher percentiles. Note that the percentile is the academic standing of the kids at the beginning of the time interval; therefore, the kids are grouped as peers going into the test period, and then their gains can be compared to determine the impact of chess.
Overall, because of these biases shown in Figure 2, the best way to fairly compare chess players versus their peers is to measure their score increase relative to others in the same semester, grade, and percentile.
Chess Kid Performance Compared With Peers
To generate the net gain versus peers, each student’s score increase is compared directly with the average score increase of the coincident peer group (subtracting the latter from the former). The peer group is defined as students in the same grade, the same quartile (prior to test), over the same time period (a specific trimester or year). There may still be some biases within the quartiles, but when the number of academic peer groups was increased (e.g., to 10) it reduced the sample sizes and provided poor statistical comparison. An alternate case was run with peer groups of 0% to 50%, 50% to 75%, 75% to 90%, and 90% to 100%. This case produced higher gains versus peers than the standard quartiles (perhaps, chess kids are weighted toward the higher end of each quartile), but it also provided more error and we feared it might appear as if the percentile bins were “cherry picked”—therefore, we stuck with the standard 25% bins.
Year-Over-Year Comparison
A year-over-year comparison takes out some of the non-uniformities of the trimester-based data, which has pros and cons. The pros are that the non-uniformity of scoring between the various trimesters is eliminated, and club-only kids are allowed a valid comparison. The cons are that the potential impact of chess on “near-term” ability is lost. If a kid were to benefit from learning chess during only one trimester over a full year, this effect is then smeared out (i.e., the benefit is watered down). If a kid plays in chess club for 1 month, the algorithm assigns him or her to the group for the full year. Likewise, a kid that plays in one rated tourney in a year is assigned the same status as the one that played in all three trimesters. Another positive attribute of the 1-year results is that they help eliminate the impact of spurious single tests (e.g., a sick or depressed kid) and possible see-sawing of kids back and forth between the percentile groups.
Table 2 shows the relative score increase of the three primary groups versus their coincident peer group (again, the peer group consists of non-chess kids in the identical grade and quartile—in this instance, the trimester is irrelevant because all score gains are measured over a year). In Table 2, and all subsequent tables, the gain of the non-chess group is zero because those are the scores that define the control/peer group, but they are listed to show the relative numbers in each group.
Yearly Net Gain Versus Peers.
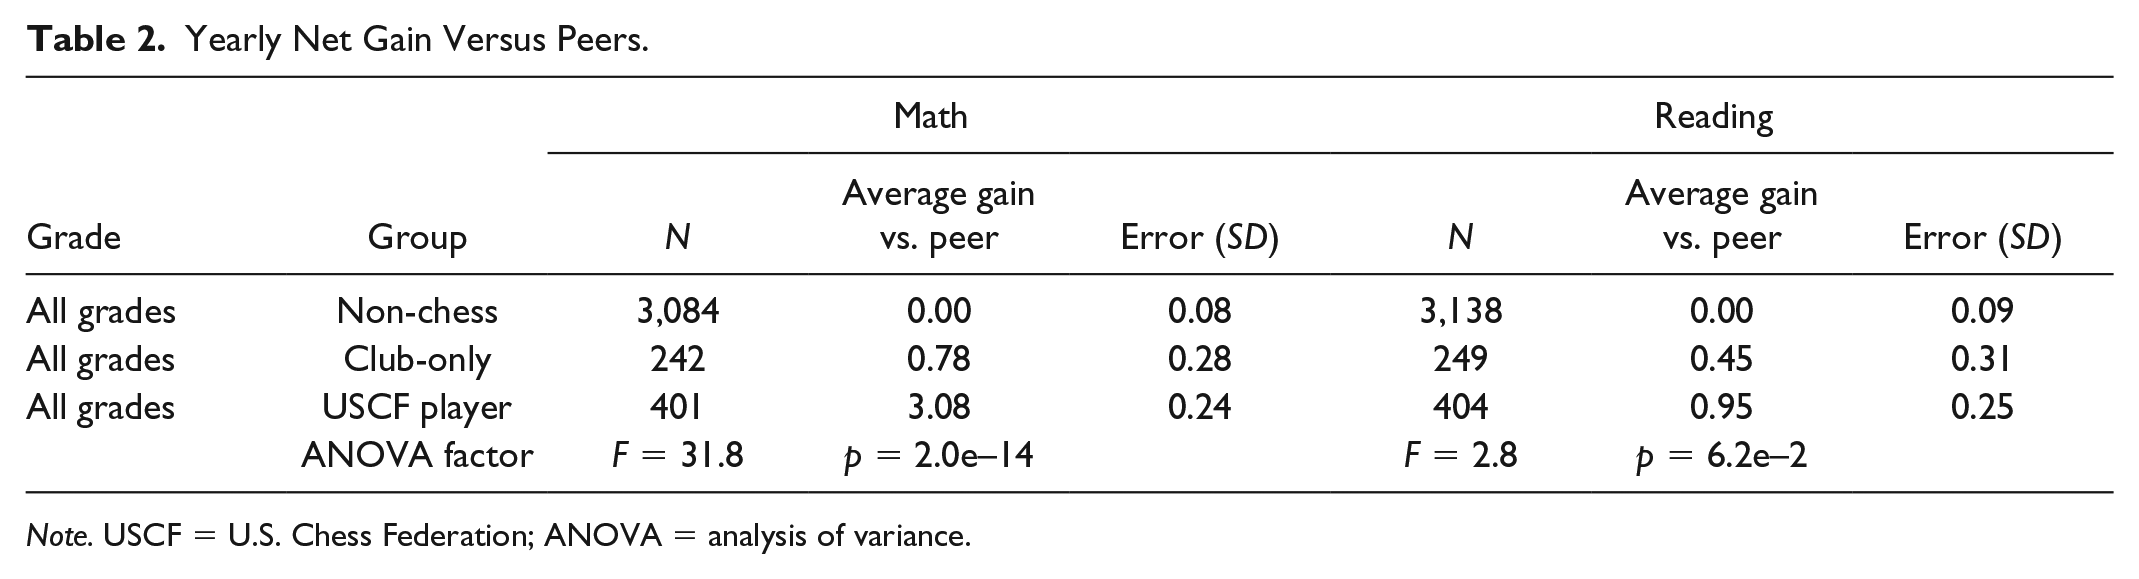
Note. USCF = U.S. Chess Federation; ANOVA = analysis of variance.
Table 2 provides a clear, statistically significant result—USCF players substantially increase their Math scores relative to their academic peers. There is also strong evidence that the USCF players receive a benefit in Reading scores because the gain is more than three times the standard deviation, otherwise referred to as a 3-sigma gain, which provides >99% confidence that there is at least a small benefit. The club-only kids also receive a small boost in Math scores at ~3-sigma or ~99% confidence, but the gains are very small as compared with the USCF players. The Reading gains of club-only kids are only ~1-sigma, or there is an approximately 70% chance of benefit. The ANOVA values also confirm the same conclusions.
Figure 3 displays the same data as Table 2 in a different format—here the gains of the group members and the coincident peers are plotted, and the net gain is put in terms of percentage.
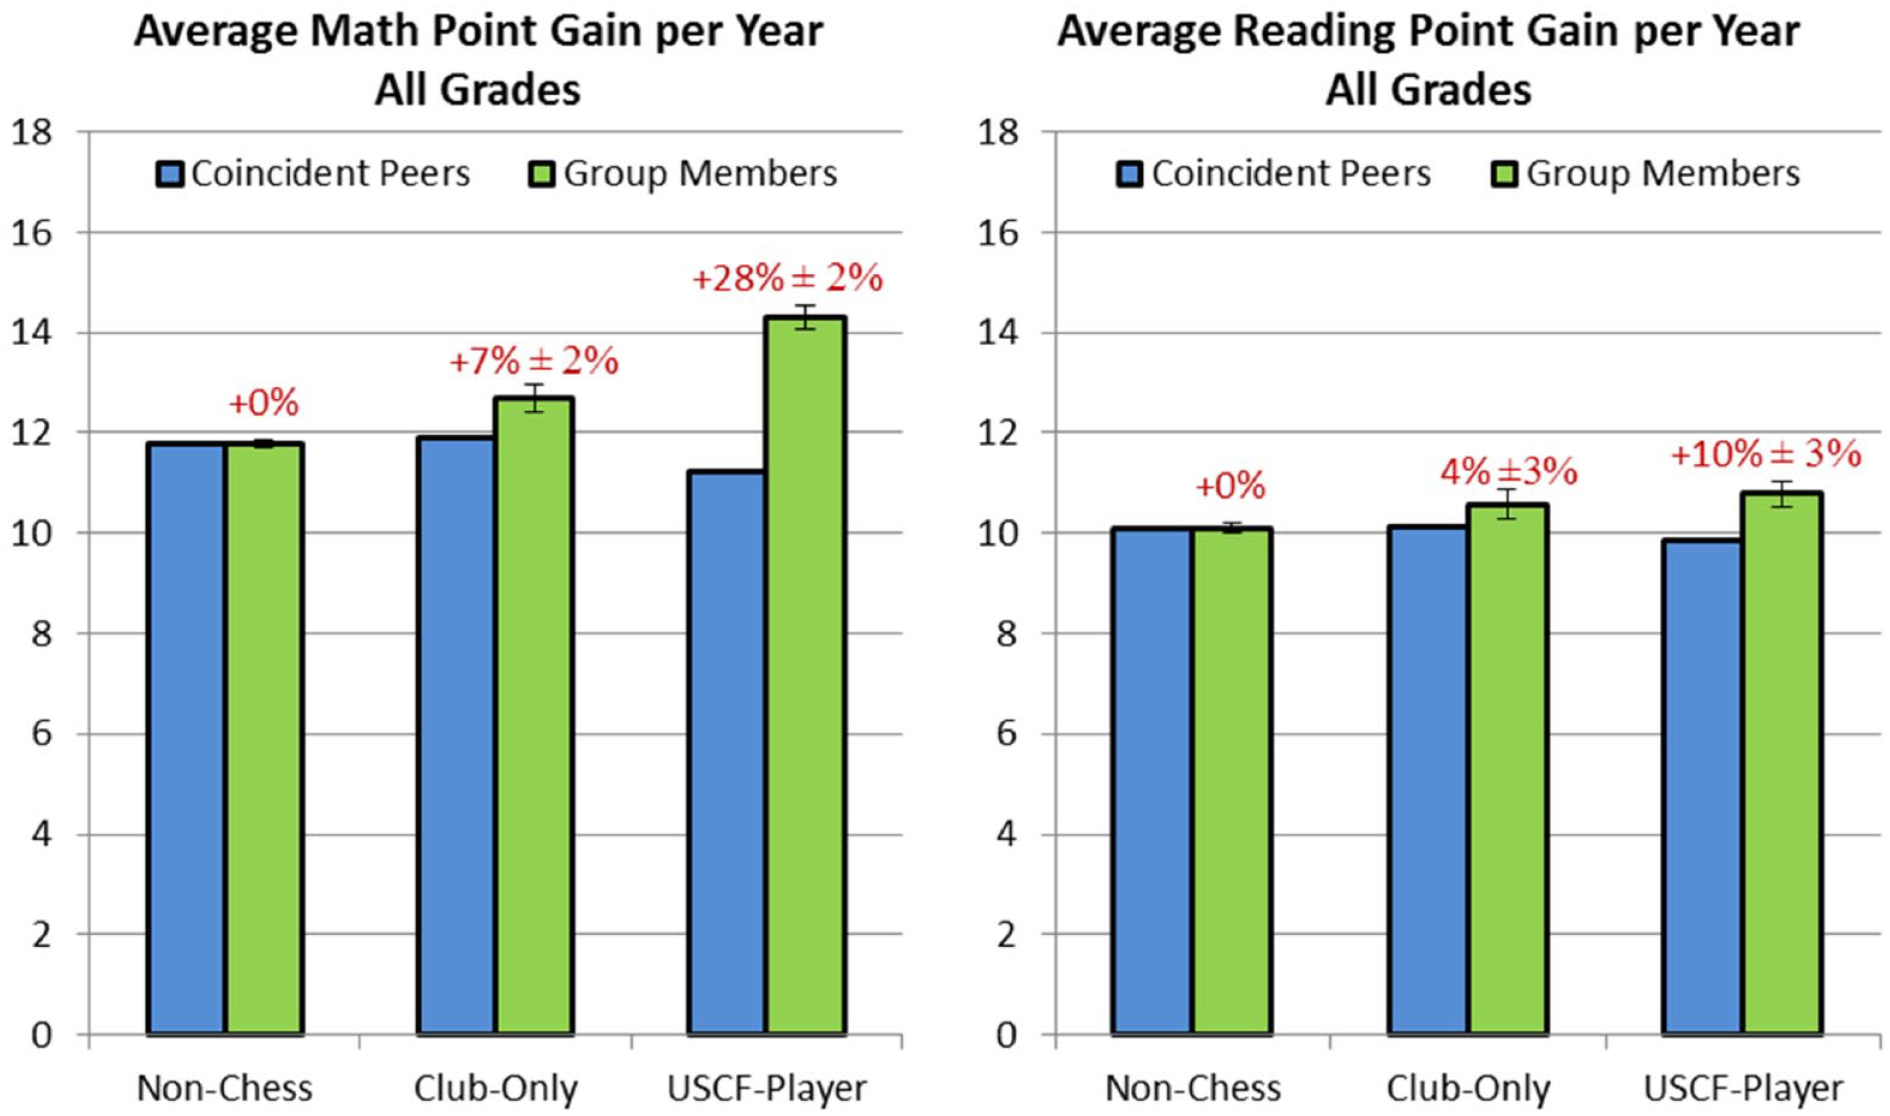
Yearly point gain versus peers.
The USCF player peer group contains mostly higher percentile kids, which is why the coincident peer average is much lower. Club-only kids are of younger ages than the average school population, and thus the coincident peer average is slightly higher. These factors are consistent with the scoring biases represented in Figure 2. Labels above the bars indicate the percent increase in score gains—for example, USCF players increased their Math scores 28% more than non-chess players (or by a factor of 1.28). This 28% gain corresponds to the 3.08-point gain listed in Table 2, that is, the extra 3.08 points increased their gains 28% beyond their peers.
Effect of grade/age
We now ask if the data might indicate that some kids benefit from chess more than the others, either based on their grade or their academic percentile ranking. Table 3 separates the kids into primary ages (G1-G3) and elementary ages (G4-G6).
Yearly Net Gain Versus Peers by Grade.
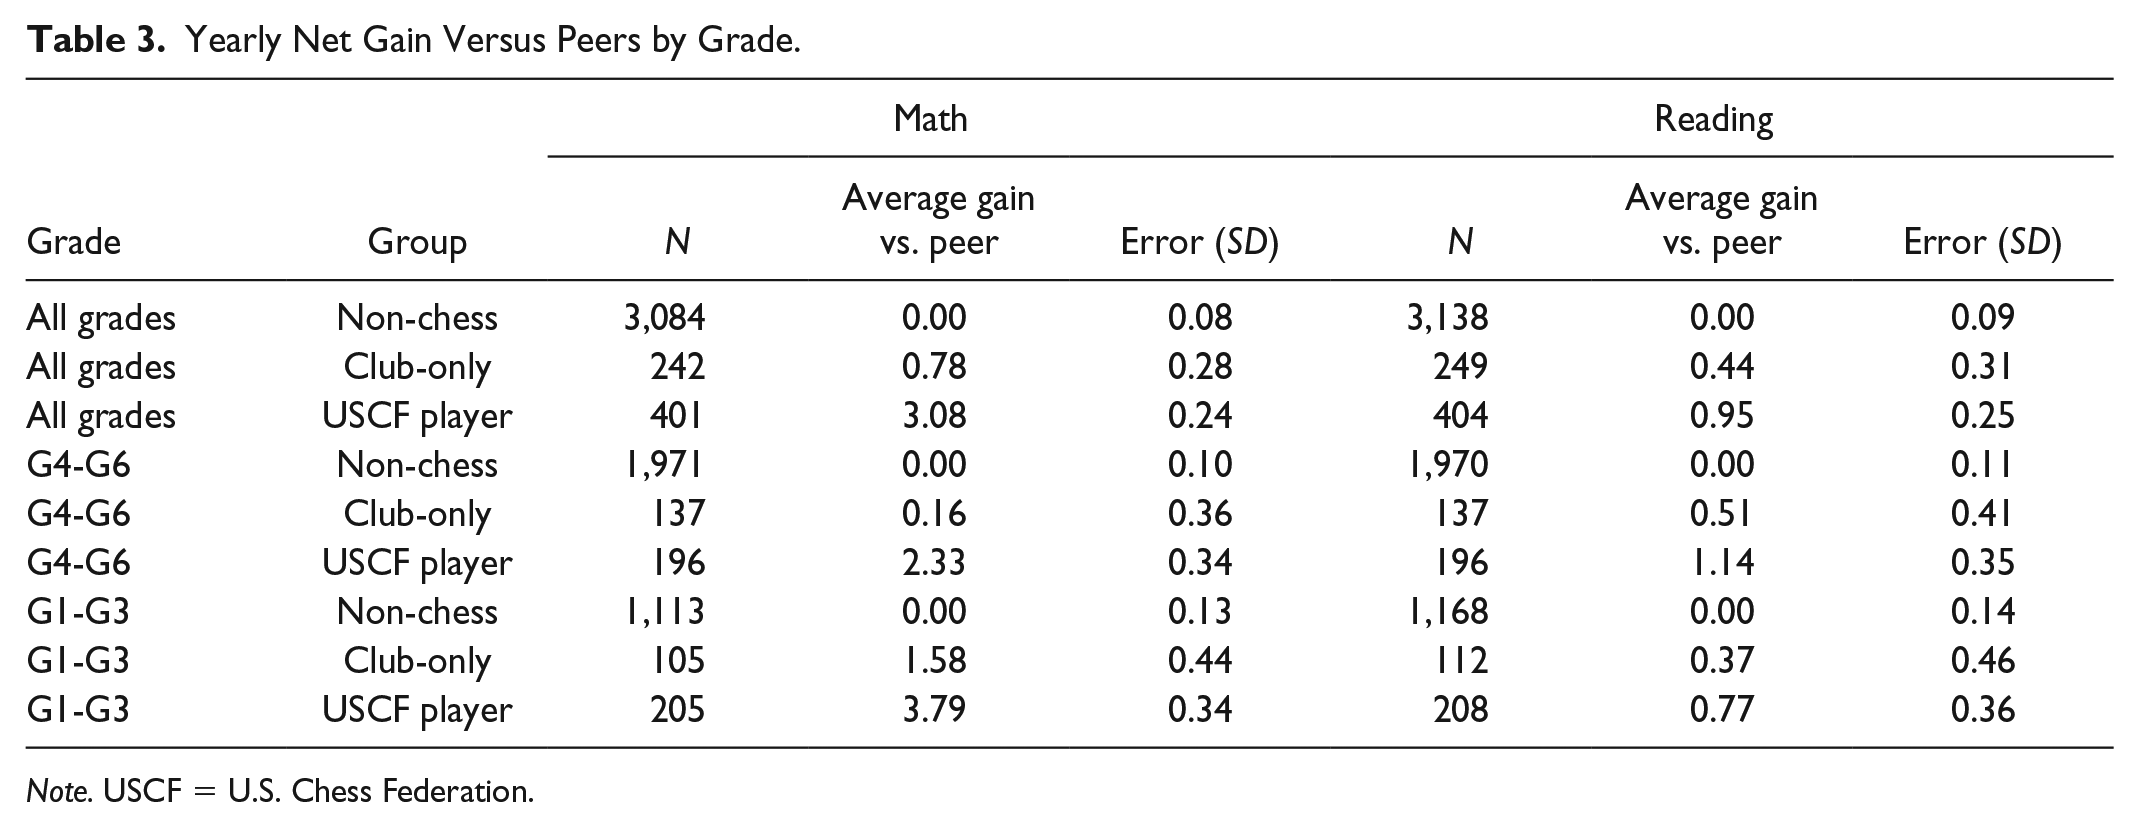
Note. USCF = U.S. Chess Federation.
The results in Table 3 indicate a stronger Math benefit to younger grades. Note that there are no kindergarten results in the 1-year comparison because there would be no results to compare from 1 year prior.
All of the charts in Figures 4 and 5 are kept to the same scale to demonstrate the difference in gains between the younger and older age groups. When point gains are calculated in terms of percent gain, then the apparent benefit to younger grades mostly disappears. In Figure 4, the 2.33-point gain for G4-G6 translates to a 27% gain, whereas the 3.79-point gain for G1-G3 becomes a 28% gain in Figure 5. The differences between grades are slightly more for the Reading and club-only scores, but they are not too far past 1-sigma of the difference, so it is hard to make any significant conclusions.

Yearly point gain of G4-G6 kids versus their coincident peers.

Yearly point gain of K-G3 kids versus their coincident peers.
Effect of academic percentile
Table 4 shows the net gains of non-chess, club-only, and USCF player groups as a function of their academic percentile.
Yearly Net Gain Versus Peers by Academic Percentile.
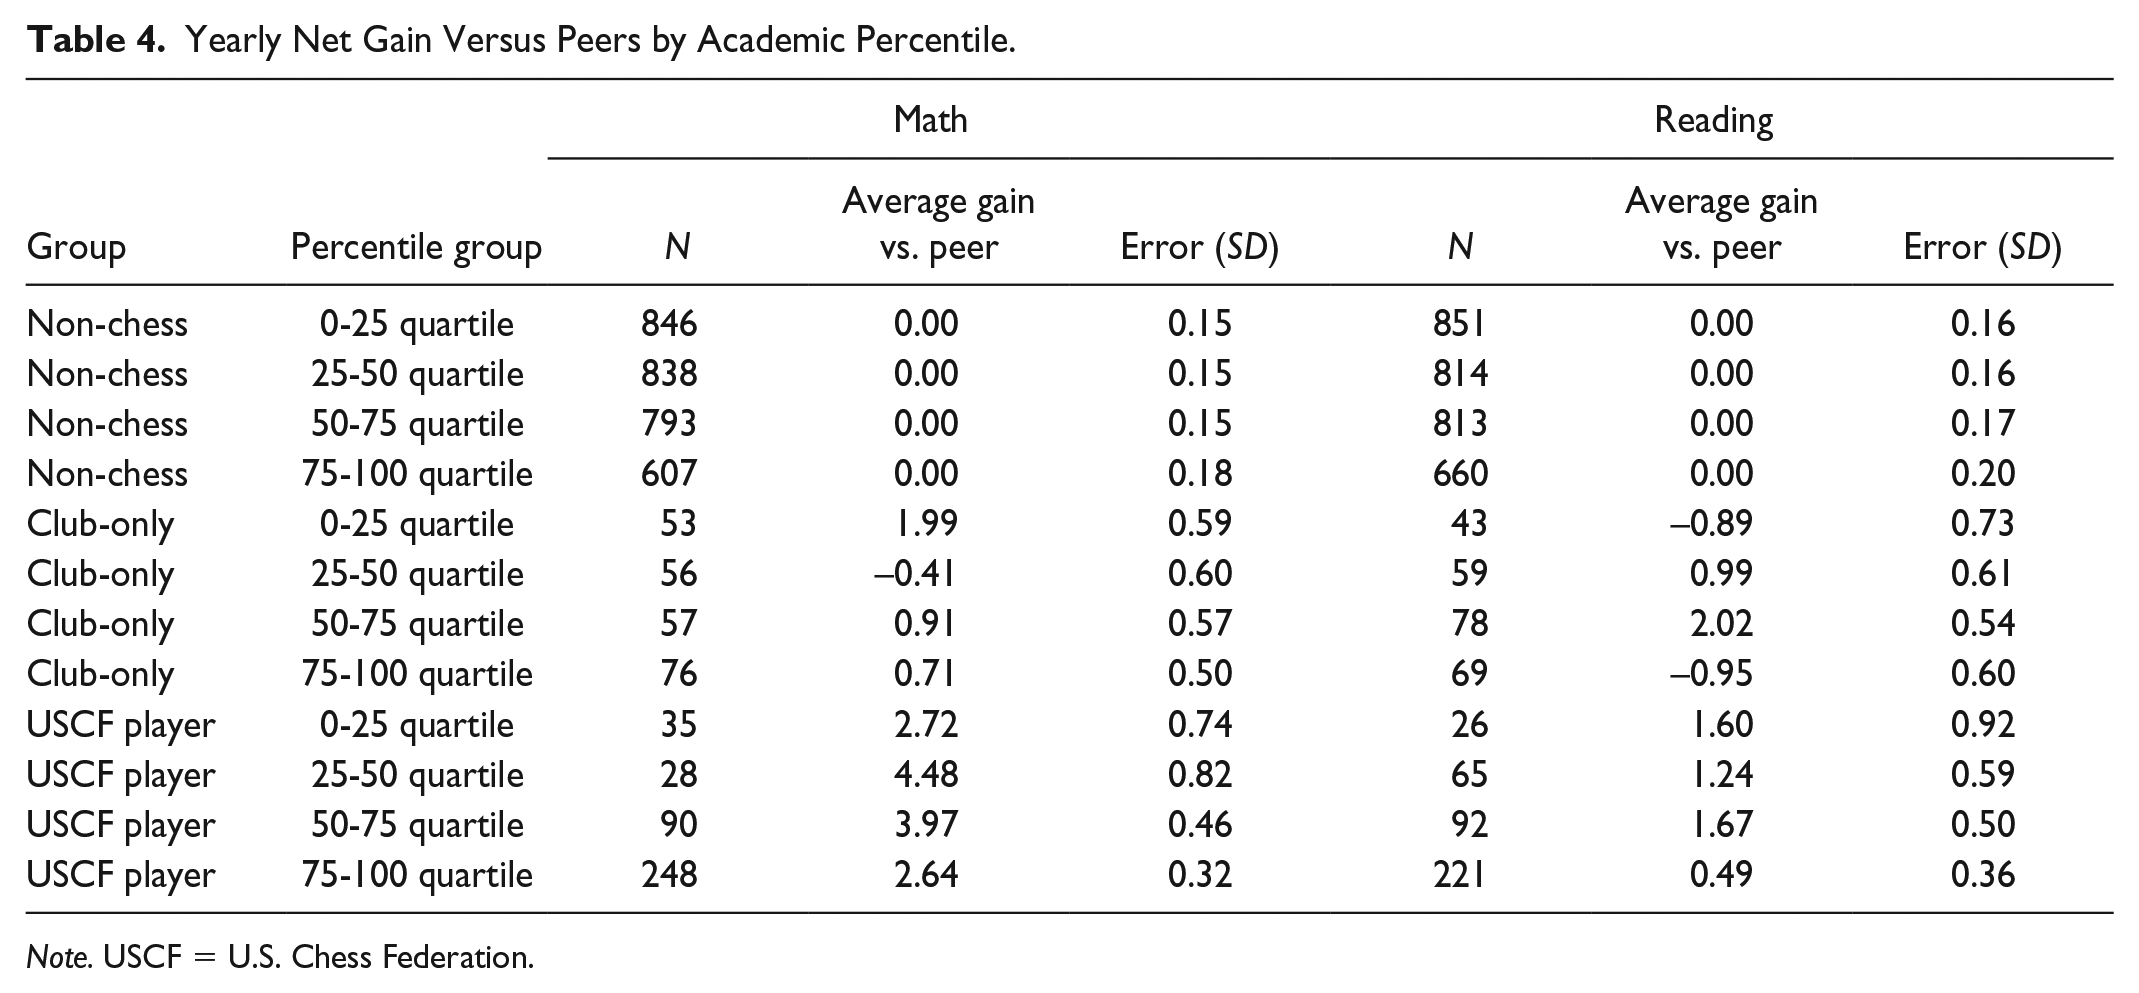
Note. USCF = U.S. Chess Federation.
From Table 4, it can be seen that the population of the club-only kids is modestly weighted toward the higher percentiles, whereas the population in the USCF player group is heavily weighted toward the top quartile. For the USCF kids, it is difficult to say with certainty if the benefits of chess are stronger on higher or lower percentile kids, but there appears that there could be more benefit to the middle quartiles (25%-75%).
The gains in Figure 6 clearly show the previously established “percentile bias,” in which the lower percentile kids gain more points on average than the higher percentile kids. The increase in Math gain is relatively consistent across the quartiles, whereas there still appears to be a slight bias toward the central population (25%-75%). The Reading gains also show a preference toward the central population, but variations of 1- or 2-sigma could change that conclusion significantly. The only thing that appears certain is that chess does not preferentially benefit gifted kids, and if anything the “general population” benefits the most.

Yearly point gain versus peers by academic percentile.
Trimester-to-Trimester Gain Comparison
As discussed earlier, the year-over-year data provide a somewhat watered-down representation of potential gains because a kid playing in only one trimester during the year sees his or her benefit spread over the entire year. The drawback of trimester-based gains is the non-uniformity of gains in the Fall, Winter, and Spring, plus club-only kids “fall back” into the non-chess group over the summer (Fall trimester), which might skew the statistics.
Table 5 contains trimester point gains for Math and Reading averaged over all trimesters, grades, and percentiles. Again, the key difference between Table 5 (trimester) and Table 2 (year over year) is that the trimester approach tallies “chess kids” if they participated in that specific trimester— the year-over-year approach tallies a chess kid if he or she played in any of the three trimesters during the year. Thus, the trimester approach should yield more discriminating results, but with more relative error because the trimester gains will be smaller than yearly gains.
Trimester Net Gain Versus Peers.

Note. USCF = U.S. Chess Federation; ANOVA = analysis of variance.
In the trimester format, the gain per interval is smaller, but if extrapolated to full-year gains they are far greater. The USCF player trimester-based Math gain is 1.82 points, compared with 3.08 points for year-over-year results. The majority of USCF tourney kids only played in one or two trimesters of a given year, so if they benefit only the semesters they play it makes sense that the 1-year result might only be ~1.5 times higher. Surprisingly, the 1.10-point Reading gain in Table 5 (trimester) is larger than the 0.95-point gain in Table 2 (1-year). The only explanation for this, other than poor statistics, would be if kids happened to regress during non-chess periods (i.e., they lose some of the benefit they had gained when they had learned earlier). Examining the error in the results (1-year = 0.95 ± 0.25 and 1-trimester = 1.10 ± 0.28), if the 1-year value happens to be 1-sigma low and the 1-trimester value is 1-sigma high, the “corrected” values would be 1-year = 1.20 and 1-trimester = 0.88; this provides a ratio closer to what might be expected. Although statistics could help explain this strange result (1-trimester gains > 1-year gains), it must be kept in mind that the 1-trimester gains and 1-year gains are not independent of each other. All of the 1-year gains are composed of trimester gains; however, not all trimester gains contribute to 1-year gains (e.g., kids with only 1 year of data). Trimester data could also be more suspect to error because of not dampening out the see-saw effect, for example, when a student has a particularly good/bad test for whatever reason (mood, health, luck, etc.) and reverts to the norm on the next test—this is one reason why we generally prefer the 1-year interval.
The chess-club-only results in Table 5 show small gains similar to those in Table 2 (but not highly statistically significant). The year-over-year club-only kids saw a Math increase of 0.78 points, which is in line with a trimester Math gain of 0.37 points. Similarly, the year-over-year Reading increase in Table 2 of 0.44 points is in line with a trimester Reading gain of 0.28 points. Despite the relatively large errors, these numbers appear to be very “well behaved,” in contrast with the USCF player Reading gains.
Given that the year-over-year Math gains were significantly positive (almost 3-sigma), and the trimesters were positive (even if only 1-sigma), it can still be concluded that club-only kids benefited Math. In Reading, the 1-year gains were positive by ~1.5-sigma and the trimester gains were positive by ~1-sigma, which is not highly convincing evidence because the two results are not totally independent. However, because USCF kids saw substantial benefit in Math and a smaller benefit in Reading, it is reasonable to conclude that as club-only kids saw a small benefit in Math they also saw a smaller benefit in Reading.
The data from Table 5 are plotted as percent gain in Figure 7.
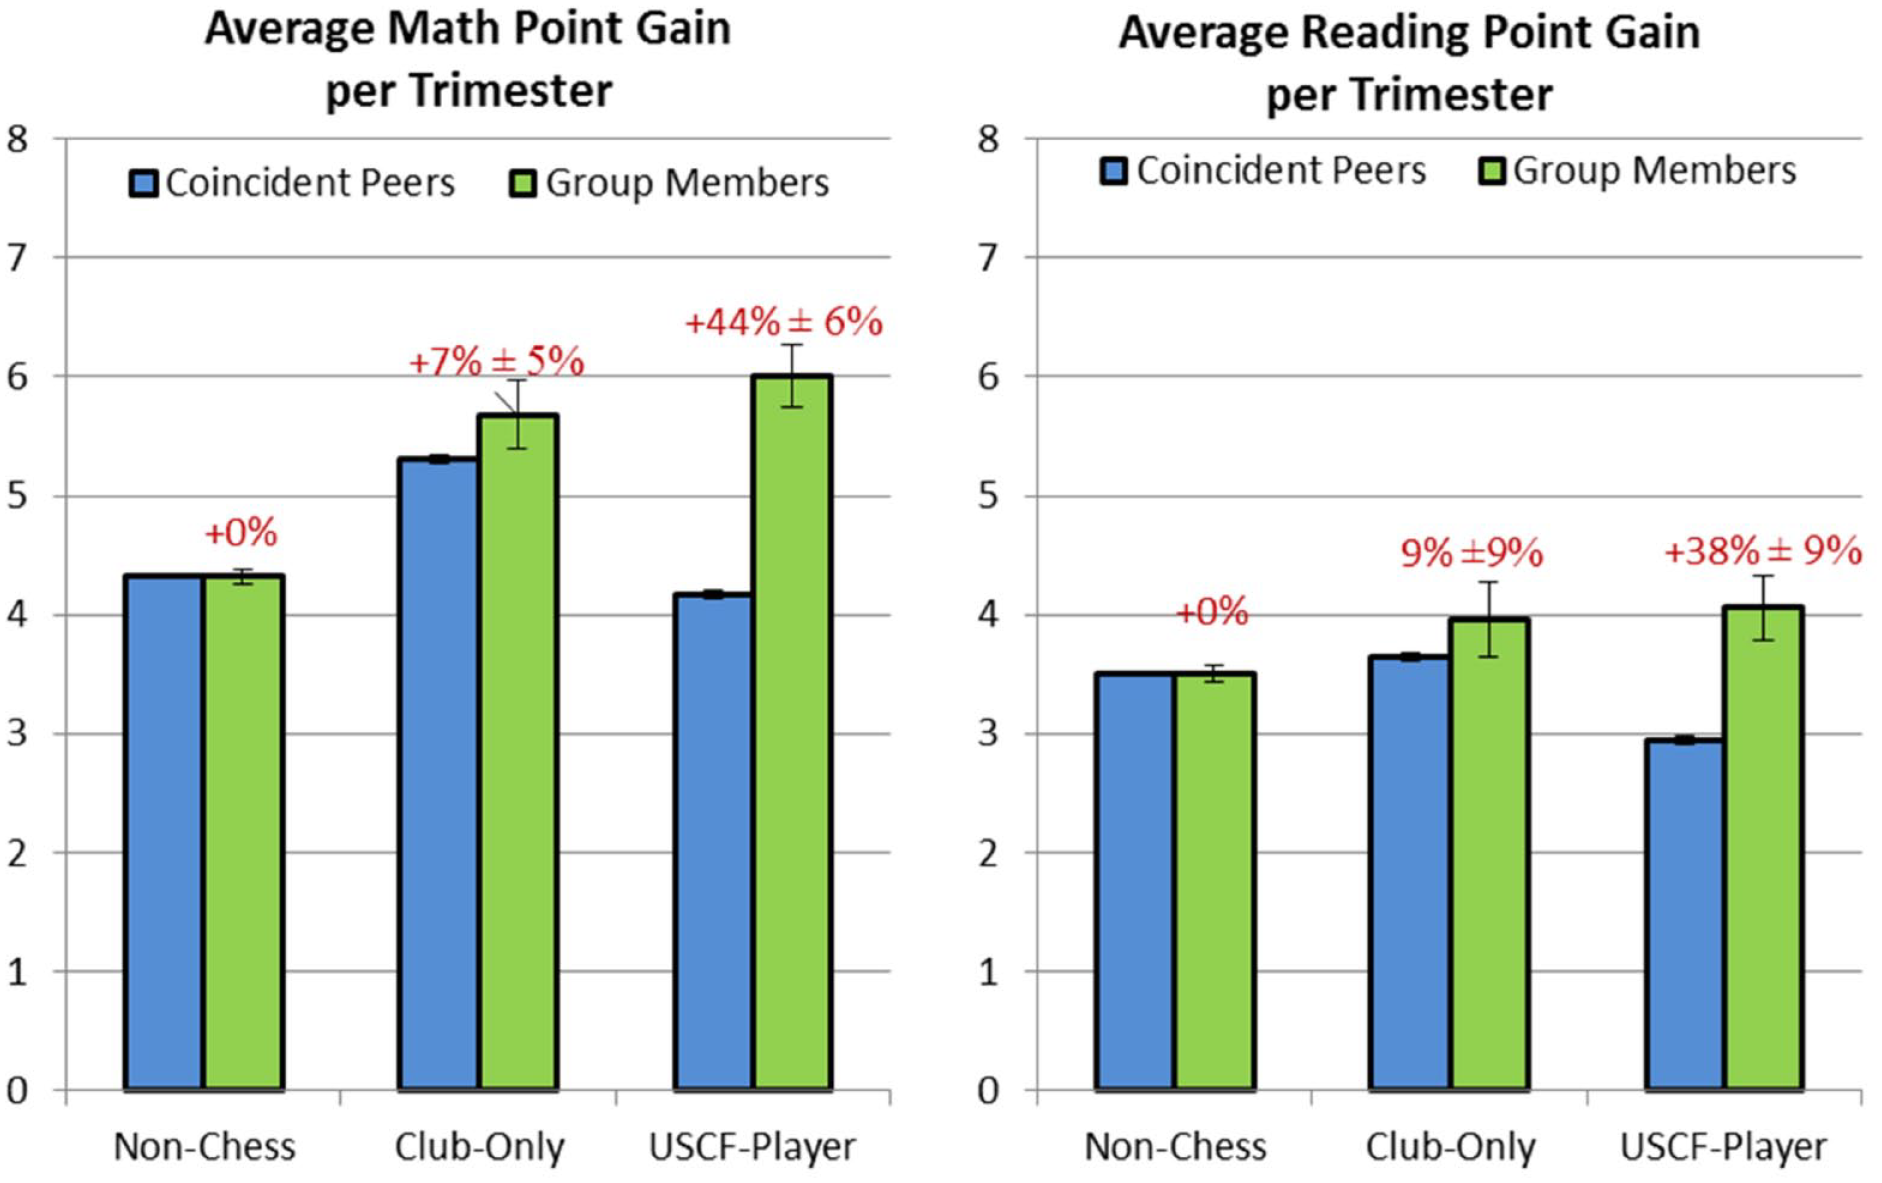
Trimester point gain versus peers.
As expected, the trimester percent increases are greater than the year-over-year percent increases. The Math increase for USCF players went from 28% to 44% and the Reading increase went from 10% to 38% (noting that the standard deviation is even larger in the trimester case and must be combined with the year-over-year error to compare cases). The Reading percent increase is also a factor of the very small denominator (coincident peer score). There are actually some peer groups in the highest grades/percentile where the trimester peer gain is negative. This is another reason why we generally prefer 1-year gains over trimester gains and could be a reason why point gain is a better indication “benefit” than percent gain.
Effect of grade/age
The breakdown of trimester net gains by age group is listed in Table 6.
Trimester Net Gain Versus Peers by Grade.

Note. USCF = U.S. Chess Federation.
In the trimester-based analysis, the percent increase in the G4-G6 population is larger than that in the K-G3 population; however, a large portion of this difference is because of the small G4-G6 peer group increases (i.e., the lower denominator as discussed above; see Figures 8 and 9). The very large 127% increase in G4-G6 Reading has a standard deviation of 38%, so it could be misrepresented if the data point is an “outlier.”

Trimester point gain versus peers for G4-G6.

Trimester point gain versus peers for K-G3.
Again, it is not clear whether the percent gain is a better metric than simple point gain, for example, if a point gain represents a byte of brainpower, then the actual increment would be more important than the percentage gain. Also, in general, only the very serious chess players continue to play rated tournaments in the fifth and sixth grades; this is shown to be important in a later section (which might explain why G4-G6 might be benefiting more).
Effect of academic percentile
Table 7 shows the net trimester gains of the non-chess, club-only, and USCF player groups as a function of their academic percentile.
Trimester Net Gain Versus Peers by Academic Percentile.

Note. USCF = U.S. Chess Federation.
In Table 7, the number of samples in the chess groups is smaller than that in Table 4 because a chess kid that plays only one trimester can cause three 1-year intervals. Although the gains may be more concentrated in this format, the general result is the same as discussed for Table 4—the center quartiles appear to benefit more than the top and bottom quartiles.
The percent gains are larger on Figure 10 than on Figure 6, but note that the errors are rather large on this plot as well. Overall, it once again appears that the middle groups receive a little more benefit, but all groups gain significantly.

Trimester point gain versus peers by academic percentile.
Test Score Gains as a Function of Tournaments Played
The previous sections show that the kids who are serious about and learn chess (play in rated tournaments) substantially increase their MAP scores. This leads to a follow-on question—is there a correlation between the number of tournaments played and an increase in MAP scores? We modified our methodology to separate kids that played more than five USCF tournaments from those that played ≤5 over the course of a year, and the results are shown in Table 8.
Yearly Score Gain Versus Peers, Separating Those who Played in More Than Five Rated Tourneys.

Note. USCF = U.S. Chess Federation.
It can be seen from Table 8 that kids who play in lots of (>5) rated chess tournaments in 1 year gain significantly more points (4.27-point gain vs. peers) than those who play in relatively few (2.25-point gain vs. peers). This is consistent with the overall conclusion of the previous sections. If learning chess (playing in rated tournaments) improves Math scores, then it would follow that the more you learn chess (more tournaments) the more your Math scores would improve. The gains in Reading in Table 8 remain small to modest for all classes of chess player.
In Figure 11, USCF rate ≤ 5 tourneys means that a kid played between 1 and 5 rated tournaments during the time period, and USCF > 5 tourneys means that he or she played in more than five. The percent gains on both charts show that the benefit that chess kids obtain versus their academic peers is a function of their level of chess involvement (which we contend correlates well with chess learning). The drop in peer scores from left to right is because the most serious kids are in the higher percentiles and it was shown previously that the average gains in the peer group are lower.

Yearly point gain versus peers by tournaments played.
Figure 12 displays the 1-year score gains as a function of tournaments played.

Yearly point gain versus peers by tournaments played.
There is a striking visual difference between Math and Reading in Figure 12. There is a significant increase in Math gains with the number of tournaments played, whereas there is perhaps a small increase with the Reading gains; nearly every Reading score is within 1-sigma of zero, and all are within 2-sigma. The error bars get larger with the number of tournaments because fewer and fewer kids played that many tournaments; for example, only one kid played 27 tournaments in a year and that specific data point yielded a standard deviation of ~4.5. Note that the poor Reading performance of the 27-tournament kid, perhaps his or her reading list included King’s Indian and Queens Gambit Declined instead of Ivanhoe and Animal Farm.
The best way to develop a correlation between test score gains and tournaments played is to plot every individual score and curve fit the data, which is done as shown in Figure 13 (note that each of the scatter charts includes all groups, including chess-club-only, who by definition have zero tournaments played).

Linear curve fit of yearly point gain versus peers by tournaments played.
The data points in Figure 13 represent all of the data used to produce (see Table 2-4 and 8), except that each individual gain is plotted as a function of how many rated tournaments a kid played during the year. There is a lot of scatter in the data points; however, an upward trend in Math score is clearly visible, whereas Reading is rather flat. The curve is a linear regression fit of all data points, including all of the non-chess and chess club data points (i.e., zero tourneys played). The key statistical parameters of the curve fit are shown at the bottom of the charts, where the line is expressed as y = mx + b. The factor R2 is of little use because its purpose is to represent how much of the data variability can be accounted for by the curve fit, and opposed to fluctuations about a horizontal line drawn through the center (mean) of the data. For the Reading data, the curve fit is very close to a straight line drawn through the center, and thus R2 is ~0—all of the variability is within the data points themselves, described by σ y = 7.92.
The key variables that validate the curve fit are standard deviation of slope and intercept. In the Reading data, the standard deviation of the slope (0.050) is greater than the slope itself (0.012), and thus there is clearly no significant trend established. For the Math data, the standard deviation of the slope (0.047) is far less than the slope (0.428), and thus a clear positive trend is established. The slight positive offset of the y-intercept might indicate that the biggest gains probably result from the first few tournaments played.
Another important value of Figure 13 (and the scatter plots below) is the magnitude of σ
y
. This study relies on the errors provided in the MAP data, and σ
y
provides a metric for comparison. The MAP scores have average error of ~3.5, and thus the standard deviation of a MAP score gain, σMAP, would be (3.52 + 3.52)0.5 = ~5. σ
y
must also combine the relatively small standard deviation of the peer average (~0.5) and more importantly the standard deviation of gains about the peer average (σpeer). This assumption would lead to
Figure 13 utilizes a linear regression of all data points, but there are many options to statistically curve fit the data, such as ignoring the zero points, forcing the curve to intersect the y-axis at zero, or using non-linear curve fits. Several of these options were evaluated, yet they all create the same outcome—there is a strong correlation between the number of USCF tournaments played and the increase in Math test scores. These alternative curve fits also indicate that the gain per tournament is slightly larger at the low end of the scale (i.e., the gain from the first tournament played is slightly larger than the gain from second tournament played, and so on). The parabolic curve fits are shown in Figure 14.

Parabolic curve fit of yearly point gain versus peers by tournaments played.
The parabolic curves do indeed show a higher positive slope in the smaller number of tournaments and a drop-off when >10 tournaments are played—although the curves are actually relatively close to linear and do not increase R2 by much. The intercepts are still >0, whereas the slope (x-term) near the origin is slightly steeper.
For novices, chess can generally be played merely on the mental (cognitive, reasoning, etc.) ability gained from experience; however, as a player begins to approach expert status (>1,500 USCF rating), chess becomes more a game of long-term memory, strategy, and nuance (some might even say art). In the latter case, exercising and improving one’s logical/critical thinking can no longer provide the gains that it did previously. This could explain the drop-off in scores for the most serious, highest rated players—they have received most of the mental gains that chess has to offer (or they could just be playing so much chess that they are neglecting other forms of learning!).
We believe that the reasoning above fits well overall the results of this study, that is, that chess greatly improves the mathematical ability, but gains in Reading are modest. As players learn chess and try to improve, they learn to think more analytically and precisely, which is the ethos of mathematics. Players also improve short-term memory and how to compartmentalize thoughts, which helps both Math and Reading. One of the simplest ways to generalize the differences between math/science and reading/liberal arts is that the former is rooted in objective thought, whereas the latter requires more subjective thought. Learning chess in the early stages is indeed very objective (cause-and-effect, sequential logic, tactics, etc.), whereas in the expert/master domain it is rather subjective (strategic). The tail-off in gains with the most serious and advanced players (those who have played >15 tournaments) might actually be attributed to this, even though the sample size is small.
Test Score Gains as a Function of USCF Rating Change
Another metric of how much chess a kid has learned is their USCF rating. The USCF provides an official rating for a player, based on their performance versus their opponents, which rather accurately represents how well someone plays chess. If a player’s rating increases over the course of a year, it is reasonably safe to assume that they learned more chess.
Table 9 splits the USCF player population into two groups: those whose USCF rating rose more than 200 points over a year and those whose rating rose less than 200 points (or perhaps declined).
Yearly Point Gain Versus Peers, Separated by USCF Rating Change.
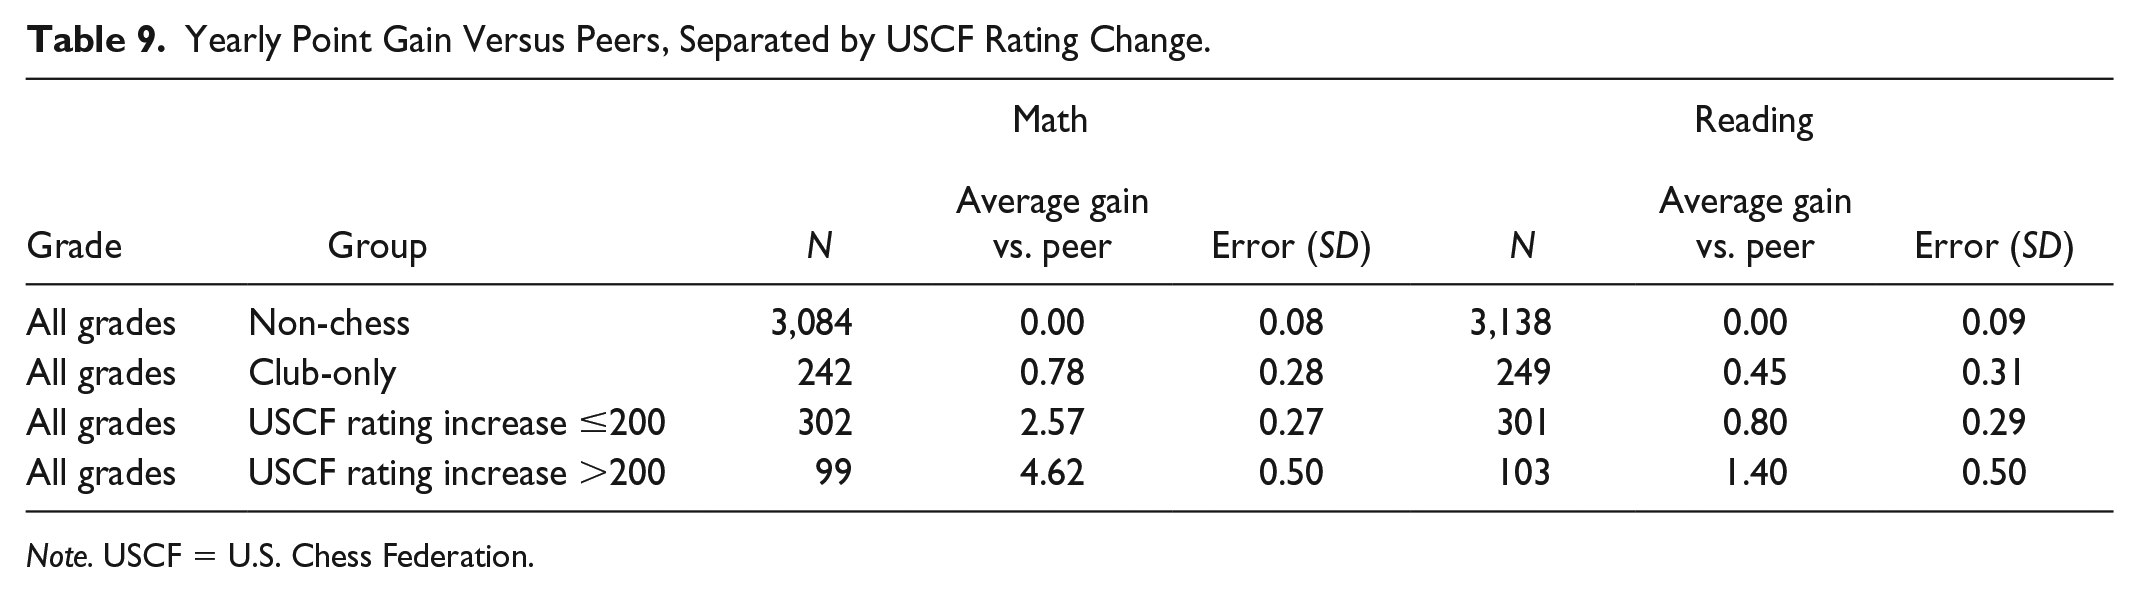
Note. USCF = U.S. Chess Federation.
A 200-point increase in USCF rating over 1 year is a rather significant move and is the range in which the USCF generally delineates classes of players. It can be seen from Table 9 that ~25% of the tournament-playing kids achieved this 200-point gain metric (99 of 403). The Math gains once again show that learning chess increases MAP test scores; the kids who come to chess club only benefited a modest increase (+0.78) and the majority of kids who play in tournaments obtained a very significant increase (+2.57), whereas the kids who make great strides in chess-playing ability (i.e., learn more chess) see a substantial increase (+4.62). As usual, the Reading results are less pronounced, but the trend still exists (albeit not significantly above the standard deviation).
It is probably no coincidence that Table 9 looks a bit like Table 8 because a kid who plays in five USCF tournaments in a year is more likely to be a kid that gained 200 rating points. This also coincides with the assertion that playing in rated tournaments is a metric that represents learning chess.
The peer comparison chart is shown in Figure 15.

Yearly point gain versus peers by rating change.
In Figure 15, USCF rate < 200 means that a kid played in at least one rated USCF tournament over the time period, and his or her rating rose <200 points or it fell, and USCF >200 means that their rating rose >200 points. The percent gains on both charts are once again telling. The benefit that chess kids obtain versus their academic peers is a function of their level of chess learning.
A scatter plot of MAP gains versus USCF rating change is shown in Figure 16.

Linear curve fit of yearly point gain versus peers by USCF rating increase.
Figure 16 compares similarly to Figure 13. The slope of increase in Math, 0.0126 MAP points per USCF rating point, is many times greater than the standard deviation of 0.0017. Reading shows once again a modest upward trend, with a slope of about the same value as the standard deviation. USCF rating decreases, that is, negative values on the x-axis, were included, but they are probably not a good representation of learning (implied negative learning). On the negative portion Math plot, there appear to be more squares above the curve fit than below, so even the kids whose rating went down may have learned some chess. If these “rating decrease” points were left off the chart, then the upward slope in Math gains would be even greater.
Figure 17 shows the parabolic curve fit of the same data in Figure 16. Just as shown in Figure 14, the gains in MAP scores per “unit of learning” are greater at smaller levels of learning (lower rating increase).

Parabolic curve fit of yearly point gain versus peers by USCF rating increase.
Impact of Early Tournaments
The results in Table 10 show the gains of students based on where they are in their chess “career,” including the gains of those who played in their first rated game and the gains of kids who were playing in the first through fifth rated games. These data are based on trimester-based gains, which should allow the benefit to newer players to be more distinct.
Trimester Score Gain Versus Peers, Early “Career” Impact.

Note. USCF = U.S. Chess Federation.
The data in Table 10 show a significantly larger Math gain for players that took a MAP test after their first rated tournament. In many cases, they may have also played in their second or even third tournament during this time interval. The Reading data are not as conclusive, improving most the first five tourneys, but decreasing for the very first one (note the larger error for that case). Note that there are only 46 data points in the first-time group, whereas it can be seen from Table 1 that 75 kids played in USCF tournaments with at least two MAP scores. This difference is based on kids who played in a rated tournament before their first MAP test, some of them played prekindergarten, but most of the difference is because MAP testing was not always given to kindergarten or first grade. The results in Table 10 are again consistent with the idea that club-only kids do not take learning chess seriously, whereas the USCF players put in the effort and get the competitive experience to improve their mental abilities.
Summary of Results
Data Characterization
There are more than 12,000 test scores in the database, accounted for by 854 unique students. This study evaluates the gain in score over a time interval; thus, a student must at least have two test scores. In this category, there were 793 students, 140 who participated in chess club and 78 who played in rated USCF tournaments. The USCF tournament history of each student was downloaded from the USCF website, which includes when tournaments were played and their changes in rating.
Data Biases
The data in Figure 2 represent three biases that were uncovered in the MAP point gain data, which put into question the validity of a simple binning approach: (a) The point gains are much smaller in the Fall test (which includes the summer break) than the “academic” trimesters of Winter and Spring; (b) the point gains are substantially smaller for kids in the higher academic quartiles (50%-75% and 75%-100%) than the lower academic quartiles (0%-25% and 25%-50%); (c) the point gains are much smaller for higher grades than for lower grades. Chess-club-only kids tend to be younger and USCF tourney kids tend to be older, whereas all chess kids lean toward the higher academic quartiles; also, chess club does not meet over the summer. To obtain any valid conclusions, these biases required that the gains in kids’ scores be directly compared with their peers (same grade, quartile, and time interval).
1-Year Gain Versus Peers
The year-over-year gains in test scores of chess kids are shown in Table 2 and Figure 3. The gains of USCF players were 26% ± 2% in Math and 8% ± 3% in Reading. The gains for chess-club-only kids were 6% ± 2% in Math and 3% ± 3% in Reading. The 1-year interval scores provide the best sample sizes for the chess-playing kids because a kid is counted as a USCF player even if he or she played in only one trimester during that interval. These scores provide the lowest standard deviation, but they likely “water down” the effects of learning chess, because kids are most likely to learn chess in the week before, during, and after their tournaments (any chess parent is familiar with this).
Trimester Gain Versus Peers
The trimester-based gains in Table 5 and Figure 7 are the best method to focus in on the benefits of chess, although with a risk of higher variability than the 1-year intervals. The gains of USCF players were 44% ± 6% in Math and 37% ± 9% in Reading. The gains for chess-club-only kids were 7% ± 5% in Math and 8% ± 8% in Reading. In addition to a smaller sample size as compared with the 1-year gains, the standard deviations are higher because the gain in one trimester is smaller, which makes the error a larger percent of the score.
Impact of Age/Grade Level
The year-over-year and trimester results were broken down by grade levels and plotted in terms of K-G3 and G4-G6 as shown in Tables 3 and 6 and Figures 4, 5, 8, and 9. In terms of point gain, K-G3 was higher than G4-G6 in both cases, but in terms of percent gain K-G3 was slightly higher for 1-year results, whereas G4-G6 was higher for trimester results. The overall comparison of all the grade-specific data indicates that there is no preferable benefit to learning chess in one grade versus another. However, as most kids started in the K-G3 age group, this means that the benefit did not tail off in the latter grades. Therefore, it follows that a kid who started chess at a younger age received more net benefit. The cumulative benefit to USCF players in Math is also visible in Figure 1.
Impact of Academic Standing
The gain versus peers was subdivided by academic quartile (0%-25%, 25%-50%, etc.) in Tables 4 and 7 and Figures 6 and 10. In terms of point gains, the most benefit was seen in the middle quartiles and the least benefit was seen in the top quartile. In terms of percent gains, the most benefit was still seen in the middle quartiles and the least benefit was seen in the bottom quartile. It is debatable as to which parameter is more important, raw point gain versus peers or percent increase in gain versus peers. The overall comparison of all the quartile-specific data shows higher benefit to the middle quartiles (25%-75%), but still impressive benefits to the bottom (0%-25%) and top (75%-100%) quartiles.
Impact of Commitment
It can be seen from Table 8 and Figure 11 that kids who play in five or more USCF tournaments in a year gain 41% ± 4% in Math and 13% ± 4% in Reading, which is significantly higher than the USCF group-average 1-year gain. It can be seen from Table 9 and Figure 15 that kids who increase their USCF rating by >200 points in 1 year gain 44% ± 5% in Math and 15% ± 5% in Reading, which is also significantly higher than the USCF group-average 1-year gain.
Impact of Experience
It can be seen from Table 10 that kids early in their chess “career” benefited more than the average USCF player. A significant increase was found for the first-time players, but the sample size is rather small. A modest increase was found when the tally included players in any of their first five tournaments, which has a much larger sample size. In conjunction with other data, particularly the scatter plots, it can be reasonably concluded that there is more benefit to players in the first tournaments than in their latter tournaments (but not a substantial difference).
Scatter Plots
Several scatter plots (see Figures 13, 14, 16, and 17) chart the bulk data versus USCF tournaments played and USCF rating increase/decrease. These charts showed a clear, statistically significant positive trend in Math for the kids who played/learned more chess (and a small increase in Reading). The curve fits indicate that more benefit is gained in the first few tournaments played, but continues to increase from there on. The correlation between the “tournaments played” and “rating increase” plots helps establish the assertion that “playing in tournaments” can be interchanged with “learning chess.”
Error
Every score gain presented in this report is accompanied by a calculated standard deviation, based on benchmarked score errors provided by the NWEA. In many cases, the difference in gains among the groups is much greater than the standard deviations of each gain, which indicates that the results are statistically significant. The hypothesis that chess increases Math MAP scores is virtually certain because in Tables 2 and 5 the gains of the USCF group were more than six times that of the combined standard deviation of the USCF and non-chess group averages. Also, in Figures 13 and 16, the slope of the score gains was more than six times the calculated standard deviation of the slope. These results place the probability of the null hypothesis (no effect of chess) at essentially zero. In some cases, ANOVA parameters were calculated as a secondary means of confirming the statistical significance of the results. Overall, the statistics and trends presented by the data were consistent with the individual score errors provided by NWEA, and the scatter plot analyses helped confirm this (see discussion of Figure 13). However, despite our attempts to removes biases and correctly propagate error, there still could be unaccounted variables/error affecting this study.
Conclusion
The numerical results of this study clearly indicate that kids who played in USCF-rated chess tournaments saw substantial improvements in their Math test scores and a modest improvement in Reading scores. Alternatively, the results were unimpressive for kids that attended chess club only. Perhaps, the most important takeaway of this study is that the benefits of chess are highly reliant on how serious a kid is about learning chess. Not only did USCF tourney kids outperform club-only kids, but the kids who played in numerous USCF tournaments outperformed kids who played in only a few tournaments. Also, kids who significantly improved their USCF chess rating (perhaps the best measure of “chess learned”) outperformed kids with smaller rating increases.
The following bullets summarize the key findings of this study. The ranges of gains stated below are based on all of the findings, but are most heavily weighted on the trimester gains versus peers, which provide the most discriminating results.
Kids who attended chess club, but did not attend rated tournaments had an approximately 5% to 10% increase in their Math scores versus their peers and no statistical difference from their peers in Reading.
Kids who played in USCF-rated tournaments saw an approximately 30% to 50% increase in their Math scores versus their peers and an approximately 10% to 30% increase in their Reading scores.
Benefits were highly dependent on the level of chess participation/learning—greater gains with more tournaments played and/or a larger USCF rating increase.
The most significant benefit was for the first-time USCF players (i.e., the difference between chess-club-only and first tournament played), but gains continued steadily with more tournaments played.
There was no significant difference between ages/grades in terms of immediate chess benefit, but the cumulative benefit was higher for kids who start younger.
There was a slightly greater benefit shown for the average student (25%-75%), but still impressive benefits to the bottom (0%-25%) and top (75%-100%) quartiles.
Various comparisons showed a Math score increase more than six times the standard deviation of the results, which provides virtual certainty that there is a positive correlation between learning chess and test scores.
Informal Recommendation
Parents and educators should carefully consider the importance of learning chess, as opposed to merely being taught or exposed to chess. Our findings indicate that sending a child to chess club or teaching chess as part of a curriculum may not by itself create any positive impact. The goal of the parent or educator should be to spark an interest within the child to learn the game of chess, which can be done via chess club or class, but just as easily at home or during recess, then encourage the child to attend a competitive/rated tournament—most tournaments have a beginner section that will have other first-time players. From our experience, these tournaments are what drive kids to become serious about chess and ultimately learn it. Some parents are often afraid of exposing their child too early (on fear of them having a bad/losing experience), but for most kids their first tournament experience is the same whether they win or lose; they either become hooked and want to continue learning chess and playing in tournaments, or they are not interested and they should hence move on to another activity.
One of the significant attributes of this study is that the participation in USCF tournaments was not mandatory or even promoted as a school activity. From our experience, it is exceedingly rare (and unwise) for a parent to spend an entire Saturday dragging an unwilling kid to one of these individual rated tournaments (i.e., one not related to a school team or run as part of a school curriculum). On the contrary, the majority of kids who play at these tournaments have to coerce their parents to bring them because those kids genuinely love playing at the tournaments. Their genuine interest, plus the explicit competition of the tournaments (the thrill of victory and the agony of defeat), drives them to truly learn the game of chess.
Finally, it is very important to note that a chess coach or instructor is never needed during this entire process—the game can easily be learned independently via computer (from beginner to advanced), or a parent/child can learn the game jointly to an adequate level at home over the board. The important thing is to at least give a child the opportunity to find out if they want to spend time learning chess or not—the mechanism of how they learn chess is the easy part.
Footnotes
Declaration of Conflicting Interests
The author(s) declared no potential conflicts of interest with respect to the research, authorship, and/or publication of this article.
Funding
The author(s) received no financial support for the research, authorship, and/or publication of this article.