
Abstract
The present study examined the longitudinal measurement invariance of the Korean version of the Center for Epidemiological Studies-Depression (CES-D) scale. For this purpose, two datasets from the Korean Welfare Panel Study were analyzed. Study 1 examined the data from the first four waves to determine the scale’s short-term longitudinal invariance. Study 2 extracted data every 3 years up to the 10th year, beginning with the first wave (waves 1, 4, 7, and 10) to examine the scale’s long-term longitudinal invariance. We analyzed 10,098 cases in Study 1 and 7,077 cases in Study 2. The results of Study 1 revealed that the scale had strict or residual measurement invariance, whereas the results of Study 2 indicated that the scale had strong or scalar measurement invariance. Overall, the Korean version of the CES-D-11 scale was shown to be a valid measure of depression that can be used to evaluate symptom changes over time.
Depression is a major social issue that not only affects the interpersonal relationships and overall quality of life of individuals, but also potentially leads to suicide in many cases. The total number of people with depression is estimated to exceed 300 million worldwide, and depression has been ranked the single largest contributor to global disability (World Health Organization [WHO], 2017). Depression is the leading contributor to deaths by suicide, with close to 800,000 deaths per year worldwide (WHO, 2019). According to a meta-analysis that evaluated the aggregate prevalence of depression in multiple countries between 1994 and 2014, it was estimated that 10.8% of the people in the world are affected by depression at some point in their lives (Lim et al., 2018). A recent study by Liu et al. (2020) reported that the number of incident cases of depression worldwide has increased from 172 million in 1990 to 258 million in 2017, representing an alarming increase of 49.86%.
Similar to many nations, the negative effects of depression are also evident in Korea. Epidemiological surveys on mental health conducted every 5 years by the Ministry of Health & Welfare of Korea (2021) have reported that the prevalence of depression has increased gradually in Korea (2001: 4.0%; 2011: 6.7%; and 2021: 7.7%). In addition, Korea has been ranked top among the Organisation for Economic Cooperation and Development (OECD) countries in terms of suicide rates for over a decade (OECD, 2021).
Owing to the seriousness of depression, the early detection and treatment of risk groups are of significant importance. For the early detection and treatment of depression, an accurate evaluation of the existence and severity of depressive symptoms must be performed. Therefore, researchers and clinicians have dedicated much attention to the development of robust testing tools to measure depression accurately and quickly. Consequently, various measures of depression have been developed. The Center for Epidemiological Studies-Depression Scale (CES-D), a self-reported measure comprising 20 items, is one of the most widely used scales worldwide for measuring the degree of depression in the general population (Hann et al., 1999; Perreira et al., 2005; Vilagut et al., 2016).
While the full version of the CES-D scale has been frequently used in both research and clinical settings, its length (20 items) poses problems in large-scale survey research, where several measurements are usually incorporated (Boey, 1999). Thus, researchers have attempted to develop abbreviated versions of the CES-D scale to reduce the participants’ response burden (Carpenter et al., 1998). As a result, several abbreviated versions have been developed, including 5-item (Shrout & Yager, 1989), 8-item (Karim et al., 2015), 9-item (Santor & Coyne, 1997), 10-item (Andresen et al., 1994; Cole et al., 2004; Kohout et al., 1993; Meadows et al., 2006), 11-item (Kohout et al., 1993), and 12-item (Poulin et al., 2005) versions.
Among these abbreviated versions, the CES-D-11 is the most commonly used tool to measure depression in Korea. Hence, it is not surprising that many studies in Korea have attempted to examine the measurement properties of the CES-D-11. Overall, studies conducted in Korea on this scale can be divided into two broad categories. The first category of studies is related to identifying the factor structure of the scale. For example, Gweon (2009) and Kim and Kim (2008) reported that the four-factor model of depressed affect, positive affect, somatic complaints, and interpersonal problems presented by the original author (Radloff, 1977) were the most suitable. Conversely, Lee and Kang (2009) found that the most suitable scale was the five-factor model of depressed affect, interpersonal relationships, positive affect, slow activity, and physical condition. More recently, Hoe et al. (2015) investigated both the 4- and 5-factor models and recommended the use of the former, as it is consistent with the original authors’ suggestion. The second category of studies on the CES-D-11 is related to measurement invariance. For instance, Hoe et al. (2015) investigated whether the measure is invariant across gender and age groups, and deduced that factor mean invariance was supported for gender and scalar invariance across age groups.
Based on the above review of studies conducted in Korea, there is some evidence that the Korean version of the four-factor CES-D-11 is a valid measure suitable for use across gender and some age groups. However, the longitudinal invariance of the Korean version of this scale has received limited attention despite the fact that it is important to examine the presence (or absence) of such invariance when an instrument is administered in a longitudinal study that tracks changes over time. Moreover, previous studies have emphasized that it is not possible to determine whether temporal changes in a construct are due to actual changes or changes in the structure, or measurement of the construct over time without verifying longitudinal measurement invariance (Esnaola et al., 2019; Liu & West, 2018). Nevertheless, evidence of measurement invariance over time in the Korean version of the CES-D-11 is scarce in the existing literature.
Therefore, to bridge this gap in the literature, this research aims to examine the longitudinal measurement invariance of the Korean version of the CES-D-11 across time points to determine whether the scale has satisfactory properties for longitudinal comparisons and whether it can be effectively used to examine symptom changes across multiple time points. For this purpose, both short- and long-term longitudinal invariance were examined using two datasets. In Study 1, short-term longitudinal invariance was examined using baseline and second, third, and fourth follow-up data. In Study 2, long-term longitudinal invariance was examined using baseline and 4th, 7th, and 10th follow-up data.
Methods
Participants
The current study was conducted using data from the Korean Welfare Panel Study (KoWePS), which included data from nationally representative sample of South Korean households. Households were selected using a stratified multistage probability sampling design, and data on household members aged 18 years or above were collected annually through face-to-face interviews, beginning in 2006.
The KoWePS extraction frame includes 230,000 enumeration districts excluding islands and special facilities from 90% of the Korean census population as of 2005. In the first stage, a total of 517 enumeration districts were sampled using 90% of the population census data. In the second stage, a total of 3,500 households with less than 60% of the median income and 3,500 households with more than 60% of the median income were extracted. Finally, panel households were selected using the stratified double extraction method totaling 7,000 households. For the purpose of this study, data for all household members from the baseline (2006) to the 10th survey year (2015) were included in the survey.
Measure
The CES-D-11 was included in the KoWePS to measure symptoms associated with depression experienced over the previous week, with four response options: (0) Rarely or none of the time (<1 day); (1) Some or a little of the time (2–3 days); (2) Occasionally or a moderate amount of time (4–5 days); and (3) Most or all of the time (6–7 days).
The psychometric properties of the CES-D-11 have been reported in the literature. Cronbach’s alphas for the 11 items ranged from .71 to .87 (Carpenter et al., 1998; Gellis, 2010; Kohout et al., 1993). Considering that a criterion of .70 to .90 is proposed as a measure of good internal consistency (Nunnally & Bernstein, 1994), the scale’s reliability was found to be satisfactory. The CES-D-11 scale has a high correlation of .95 on the 20-item scale (Kohout et al., 1993) and retains almost (87%) of the variance of the CES-D-20 (Covinsky et al., 2010). In addition, factor analytic studies have indicated that the two scales capture the same dimensions of depression with similar precision, including depressed affect, positive affect, somatic complaints, and interpersonal problems (Gellis, 2010; Kohout et al., 1993).
The measurement translation procedures and measurement properties, including the reliability and validity of the Korean version of the CES-D-11 scale have been reported in detail by Cho and Kim (1998). The authors translated and back-translated the scale twice to derive the final version. The final version’s reliability assessed by Cronbach’s α was .893 and the authors reported that the scale had a strong concurrent and good discriminant validity.
Analysis Plan
In this study, the data analysis was conducted using the following steps. First, based on previous studies that reported the factor structure of the CES-D-11 scale (Hoe et al., 2015; Kohout et al., 1993), confirmatory factor analysis was performed for each time point. Second, data were consecutively analyzed from the first to fourth waves in Study 1 to examine short-term longitudinal invariance. Third, long-term longitudinal invariance of the scale was examined in Study 2. Beginning with the first wave, data were extracted every 3 years up to the 10th year (waves 1, 4, 7, and 10).
A configural or form invariance model was initially estimated, with the loadings and thresholds being freely estimated. Next, a metric or weak invariance model was estimated, in which the factor loadings were constrained to be equal across time points. Then, a scalar or strong invariance model was estimated, in which the loadings and thresholds were constrained to be equal across time points. Finally, in addition to factor structure, loadings, and thresholds, a uniqueness or strict invariance model was estimated, in which residual variances were constrained to be equal across time points (Liu et al., 2017; Marsh et al., 2018; Meredith, 1993; Richardson, et al., 2020; Widaman et al., 2010; Winter & Depaoli, 2020).
A total of four goodness-of-fit indices were used during the data analysis, namely the Tucker-Lewis index (TLI), comparative fit index (CFI), root mean square error of approximation (RMSEA), and standardized root mean square residual (SRMR). In general, a CFI and TLI >0.95, and an RMSEA and SRMR <0.08 indicate that the four indices had a good fit with the data (Hu & Bentler, 1999; Kline, 2005).
To evaluate the invariance at each level, a chi-square difference test was computed but not used, as the chi-square test is sensitive to minor parameter changes in large samples. Instead, based on the recommendation by Chen (2007) for model comparisons, the cut-off values of ΔCFI <0.01, ∆SRMR <0.01, and ΔRMSEA <0.015 were used to test the configural, metric, scalar, and uniqueness invariance.
All of the data analyses in this study used the Jamovi 1.2.2 (The Jamovi Project, 2019) and Mplus 8.4 (Muthén & Muthén, 2019) programs. As the CES-D-11 items were measured with ordinal categories, the estimator of weighted least squares with mean and variance adjusted (WLSMV) was used in the latter program. Given the ordinal nature of the items, they were analyzed using polychoric correlations via WLSMV.
A list-wise deletion was employed to address the missing data in the data analyses. The final sample size was 10,098 in Study 1 and 7,077 in Study 2, which were large enough for the estimation.
Results
Demographic Characteristics
Participants’ demographic characteristics are presented in Table 1. In Study 1, 56.6% of the participants were female, and the Mage was 51 years (SD = 16.8; range = 18–99). In addition, the majority of the participants were married (69.6%), and more than 54% had a high school education or higher. In Study 2, the mean age was 50.9 years (SD = 15.7; range = 18–99), while 58.3% of the sample were women. Moreover, approximately two-thirds (72.2%) of the participants were married, and more than half of the sample (53.2%) had a high school education or higher.
Demographic Characteristics of the Study Sample.

Psychometric Properties of the CES-D-11
The CES-D-11 scale items with their factor structure and psychometric properties are presented in Table 2. The scale consists of four factors including depressed affect (three items), positive affect (two items), somatic complaints (four items), and interpersonal problems (two items).
Scale Items, Factors, and Reliabilities of the Scale.

The reliability of the scale was assessed using Cronbach’s alpha and McDonald’s omega coefficient. The McDonald’s omega coefficient ranged from .864 to .894, and Cronbach’s alpha ranged from .852 to .887, indicating that the scale has satisfactory internal consistency.
The floor and ceiling effects of the scale were calculated as the percentage of participants who reported the lowest score of 0 or highest score of 3 for each of the 11 items. Floor and ceiling effects were considered present if more than 15% of the participants had either the lowest possible score (floor effect) or the highest possible score (ceiling effect; Terwee et al., 2007). As shown in Table 2, there were no ceiling effects for the CES-D-11 throughout the study periods. However, all items showed floor effects ranging between 43% and 96%. Considering that the sample of this study was not a clinical population but the general public, one possible explanation for the presence of floor effects is that only a limited number of participants had depressive symptoms.
Confirmatory Factor Analysis of the Baseline Model
Before examining the longitudinal measurement invariance, it is important to establish a baseline model that fits well with the data across time points (Byrne & Watkins, 2003; Sass, 2011). Although one study reported that the Korean version of the CES-D-11 consists of a 5-factor model (Lee & Kang, 2009), other studies (Gweon, 2009; Hoe et al., 2015; Kim & Kim, 2008) concluded that the scale is suitable as a 4-factor model, consistent with the original author’s suggestion (Kohout et al., 1993). Thus, the 4-factor model was adopted in the current study as a baseline and tested to ascertain that it fits well with the data across time points.
As presented in Table 3, the CFI and TLI values were greater than the cut-off point of 0.95, while the SRMR and RMSEA values were less than the cut-off point of 0.08, indicating that the baseline model matched well with the data at all time points. This also allowed for further investigation of the longitudinal measurement invariance.
Confirmatory Factor Analysis of the Baseline Model at Each Time Point.

Descriptive Statistics
Table 4 presents the descriptive statistics of the factor scores at the baseline and follow-up periods in this study. The mean of the depressed affect ranged from 0.92 to 1.55, positive affect ranged from 0.8 to 1.65, somatic complaints ranged from 1.72 to 2.63, and interpersonal problems ranged from 0.09 to 0.24. The medians and inter-quartile range (Q1–Q3) were also reported to describe the distribution of each factor. The median scores for the depressed affect ranged from 0 to 1 (Q1–Q3, 0–3), positive affect ranged from 0 to 1 (Q1–Q3, 0–3), somatic complaints ranged from 1 to 2 (Q1–Q3, 0–4), and interpersonal problems ranged from 0 to 1 (Q1–Q3, 0–1).
Descriptive Statistics of the Factor Scores at Each Time Point.

In addition, Cronbach’s alphas, which were calculated for each factor throughout the time points showed that they were all within satisfactory levels; that is, they ranged from .705 to .848, except for positive affect at time 7 (.636).
Table 5 presents the correlation coefficients of the factor scores over time. The correlation coefficients of the factors ranged from r = .06 to .78 and they were all statistically significant. Because of the large sample size, the statistical significance of the correlations may not have a practical implication. Thus, Fisher’s Z transformed effect sizes were calculated to examine the magnitude of the relationship between the variables. The effect sizes ranged from .01 to 1.01, and the average effect size was 2.91, according to Cohen (1988), which corresponds to a medium effect size.
Correlation Coefficients Among the Factor Scores at Each Time Point.
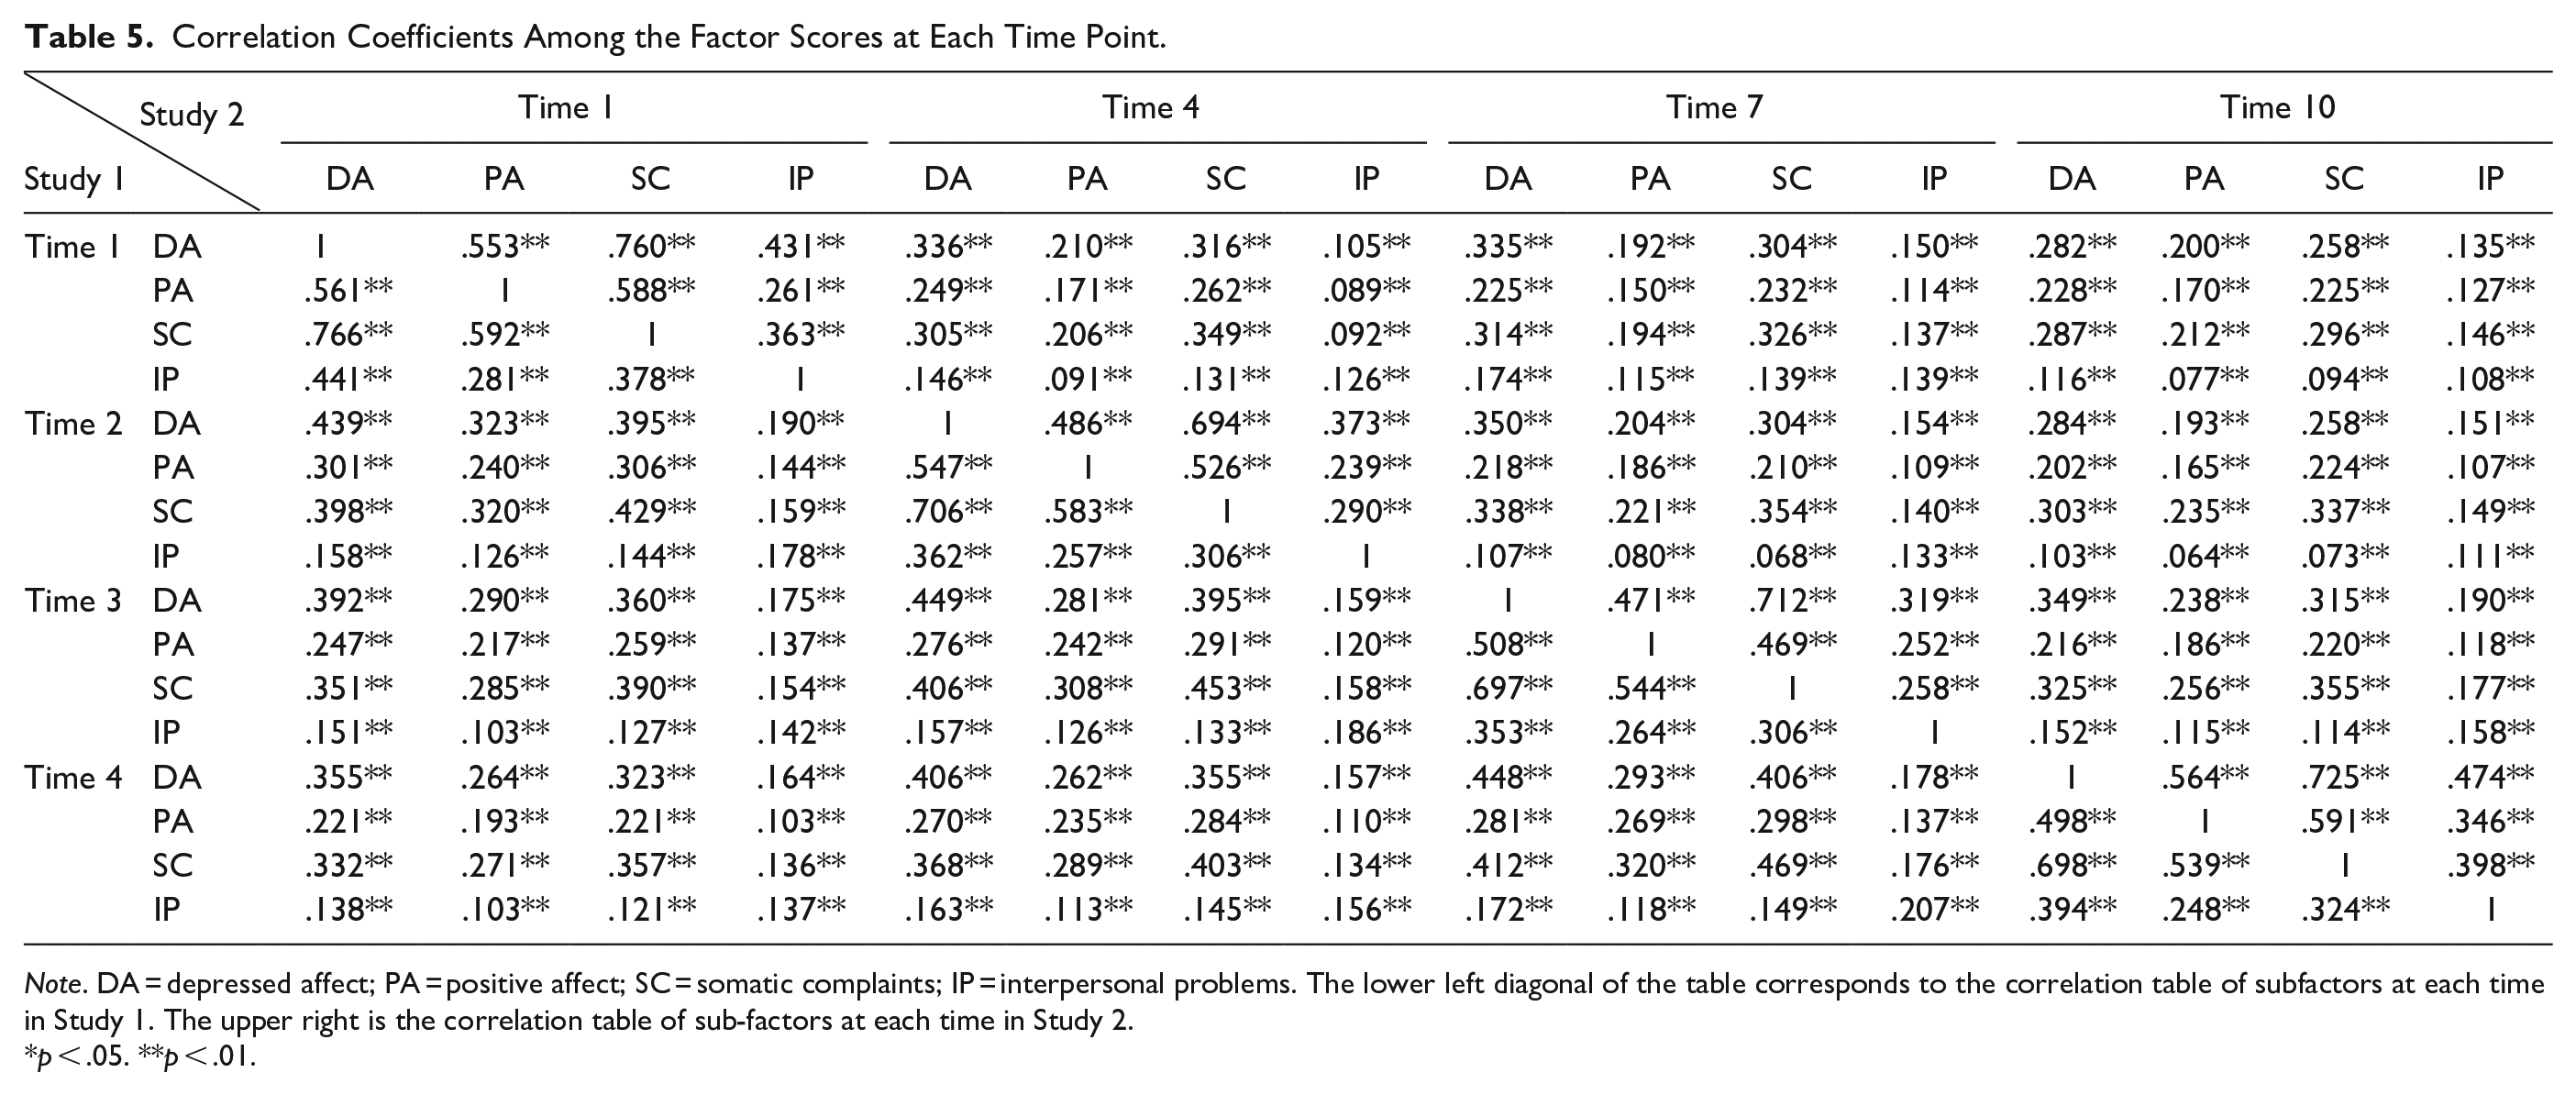
Note. DA = depressed affect; PA = positive affect; SC = somatic complaints; IP = interpersonal problems. The lower left diagonal of the table corresponds to the correlation table of subfactors at each time in Study 1. The upper right is the correlation table of sub-factors at each time in Study 2.
p < .05. **p < .01.
Longitudinal Measurement Invariance
The baseline model used in this study is shown in Figure 1. The responses to the 11 CES-D items within each measurement occasion were regressed on four common factors. The common factors were allowed to correlate across time intervals, and the residuals of the same response variables were allowed to correlate across time intervals simultaneously. In subsequent analyses, the models were specified by progressively constraining additional parameters (factor loadings, item thresholds, and residual variances) to remain equal across time.

Initial model used for the test of longitudinal invariance.
The results of Study 1, which examined the short-term longitudinal invariance of the CES-D-11, are present in Table 6. The baseline model of configural invariance was acceptable (CFI = 0.976; TLI = 0.967; RMSEA = 0.017). Next, the metric invariance model fit was adequate (CFI = 0.974; TLI = 0.967; RMSEA = 0.026), whereas the differences in CFI and RMSEA between the configural and metric invariance models were negligible (ΔCFI = −0.001; ΔRMSEA = −0.001). The scalar invariance model provided a satisfactory fit (CFI = 0.973; TLI = 0.967; RMSEA = 0.026), whereas the changes in CFI and RMSEA were negligible (ΔCFI = −0.001; ΔRMSEA = 0). Finally, the residual invariance model was shown to adequately fit the data (CFI = 0.969; TLI = 0.963; RMSEA = 0.027), with negligible differences in CFI and RMSEA between the strong and strict invariance models (ΔCFI = −0.004; ΔRMSEA = 0.001). Based on these findings, the residual invariance of the CES-D-11 scores across time was supported. Overall, the results of Study 1 suggest that the four-factor model of the CES-D-11 had strict invariance over the 4-year period.
Fit Indices and Model Comparison.

In Study 2, the long-term longitudinal measurement in-variance was examined over a 10-year period. The findings are presented in Table 6.
The baseline model of configural invariance was acceptable (CFI = 0.970; TLI = 0.960; RMSEA = 0.028). Next, the metric invariance model fit was adequate (CFI = 0.968; TLI = 0.959; RMSEA = 0.021), whereas the differences in CFI and RMSEA between the configural and metric invariance models were negligible (ΔCFI = −0.002; ΔRMSEA = 0.001). The scalar invariance model provided a satisfactory fit (CFI = 0.964; TLI = 0.955; RMSEA = 0.022), whereas the changes in CFI and RMSEA were negligible (ΔCFI = −0.004; ΔRMSEA = 0.001). Finally, the residual invariance model was shown to adequately fit the data (CFI = 0.932; TLI = 0.919; RMSEA = 0.040). However, the model comparison fit indices indicated that the difference in CFI (i.e., ΔCFI = −0.032) exceeded the cut-off value of <0.01, failing to support the residual invariance model. Overall, the results of Study 2 indicated that the four-factor model of the CES-D-11 had scalar-level invariance over a 10-year period.
Discussion and Conclusion
This study presents a number of pertinent findings based on the results. First, the baseline model of the Korean version of the CES-D-11 scale, whose factor structure has been verified in previous studies, was tested to determine whether it adequately fits the data. The examination of the fit indices indicated that the baseline model matched well with the data at all time points in this study. Second, the results of Study 1, which examined short-term longitudinal measurement invariance, indicate that the strict invariance model holds true. Third, the results of Study 2, which examined long-term longitudinal measurement invariance, indicate that the longitudinal invariance model holds up to the scalar level.
Although an increasing number of longitudinal studies have evaluated the changes in the CES-D-11 scale (Chung & Kim, 2021; Jo & Choi, 2019; Lee, 2021; S. Lee & Park, 2021), only a few studies have systematically tested the assumption of temporal invariance. This is problematic since even if any changes over time are observed in the underlying construct, it is difficult to determine whether the changes are real or due to changes in the scale’s psychometric properties without evidence of measurement invariance. To the best of our knowledge, this is the first study to examine the longitudinal measurement invariance of the Korean version of the CES-D-11 scale using a large representative sample.
A strict level of invariance is ideal because it provides confidence that the group mean differences in the scale scores are driven by real group differences and not by other factors. However, achieving residual invariance can be difficult (Chen, 2007) and many researchers suggest that meeting scalar level invariance is considered sufficient to meaningfully compare factors or observed means (Bowen & Masa, 2015; Marsh et al., 2018; Richardson et al, 2020; Seddig & Leitgöb, 2018). The overall results from both the short- and long-term investigations in this study indicated that the Korean version of the CES-D-11 scale had scalar-level invariance over time.
Therefore, it can be concluded that the Korean version of the CES-D-11 is a valid measure for assessing both short- and long-term depressive symptoms over time. The results of this study also indicate that any observed changes in scale scores over time can be interpreted as actual changes.
The present study provides relevant implications for future research since the data used in this study were collected using the probability sampling method, and the sample size was sufficiently large to make a valid generalization. Thus, the findings of this study can be generalized to the Korean population. In addition, this study simultaneously investigated both the short- and long-term invariance of the Korean version of the CES-D-11. Previous studies on longitudinal invariance were generally short-term, thus limiting the generalizability of the findings over a longer time interval. However, this study confirmed that the scale could be used to track symptom changes in depression for up to 10 years.
Although the present study reveals important findings, it has a few limitations. First, the study participants were predominantly recruited from the general community. Hence, future research should evaluate scale scores in clinical samples. Second, one of the primary methodological issues in longitudinal studies is attrition. This study was not exempt from this issue. For example, in the baseline model, the number of people who responded to depression was 13,774; however, this number decreased to 7,077 in the 10th year (dropout rate of approximately 48%). At this time, it is unknown whether the participants who remained in this study differed significantly from those who dropped out. As missing cases cause problems in longitudinal studies, additional analyses were conducted to examine the impact of the missing data. The missing data were imputed and complete datasets were created using the expectation-maximization (EM) algorithm. The newly created datasets were analyzed, and the results were compared with those of the present study (data not shown). In Study 1, the missing imputed data showed a strong level of invariance whereas a strict level of invariance was observed in the present study. In Study 2, the same level of strong invariance was observed for both datasets. Taken together, it appears that missing data did have some impact; however, it was not strong enough to influence the overall conclusion of this study, considering that a scalar or strong invariance is considered sufficient.
In terms of future research directions, it has been well reported in the existing literature that the ways of expressing depressive symptoms vary by culture and country. For example, it is possible that the floor effects observed throughout the items in this study might be related to the Eastern collectivistic cultures, where the expression of depressed affect is more likely to be devalued (Zhang et al., 2011). In contrast, studies on self-esteem suggest a tendency for people from collectivist cultures to exhibit a neutral response bias and avoid the extreme ends of rating scales (Schmitt & Allik, 2005). Future research needs to identify the specific variables or mechanisms associated with the complex interplay between culture and the items of rating scales.
Footnotes
Declaration of Conflicting Interests
The author(s) declared no potential conflicts of interest with respect to the research, authorship, and/or publication of this article.
Funding
The author(s) received no financial support for the research, authorship, and/or publication of this article.