
Abstract
The primary aim of this study is to develop a valid and reliable measurement tool that assesses teachers’ perceptions of digital transformation. A total of 828 teachers working in public schools in 2 provinces located in the eastern and southern regions of Turkey participated in the study. The construct validity of the scale was tested using exploratory and confirmatory factor analyses (EFA and CFA). According to the EFA results, the scale has a single-factor structure that explains 67.73% of the total variance. The CFA results indicated acceptable fit indices for the single-factor Digital Transformation Scale (DTS). Criterion validity was evaluated using the 21st Century Technology Literacy Skills Scale (TLSS) and the Resistance to Change Scale (RCS), and it was found that the DTS has a positive relationship with the TCTS and a negative relationship with the RCS. Reliability assessments were conducted by calculating the Cronbach’s alpha internal consistency coefficient, test-retest method, and composite reliability values across three different samples, all of which exceeded threshold values. The test-retest analysis confirmed the stability of the scale, while the composite reliability analysis supported its reliability. Item analysis was performed using the “top and bottom 27% rule” and corrected item-total correlations, with both analyses yielding positive results. Additionally, measurement invariance for gender and age variables was established, and the values indicated that measurement invariance was achieved. It was confirmed that the scale provides reliable comparisons between gender and age groups. All these findings support the Digital Transformation Scale as a valid and reliable measurement tool.
Introduction
As a result of technological advancements, digital transformation has become a fundamental aspect of daily life. Digital transformation is progressing every day, and significant steps are being taken in many sectors to understand, interpret, and implement this change (Yildiz, 2022).
Educational institutions have also been profoundly impacted by this transformation, and the widespread use of digital technologies has become inevitable (Smirani & Boulahia, 2022). Digital devices such as computers, interactive whiteboards, tablets, smartphones, augmented reality, robots, virtual reality, and 3D printing are being systematically and extensively used in educational processes and teacher training (Luo et al., 2021). Moreover, software and smart devices have increasingly permeated in classrooms, with significant investments being made in the development of digital services such as learning management systems, educational platforms, and synchronous/asynchronous communication tools (Smirani & Boulahia, 2022). In Turkey, efforts have been made to implement digital transformation in education through technology policies. With the introduction of the Movement to Enhance Opportunities and Improve Technology (FATİH) Project in 2010, interactive whiteboards, tablets, and computers began to be used in classrooms. The Education Information Network (EBA), initially developed for providing digital educational materials through the FATİH Project, became a remote education platform after the Covid-19 pandemic, and education delivery shifted to this platform. Additionally, e-book and e-content platforms were created (Aydin & Atasoy, 2023; Ceylan et al., 2024; Tekin & Polat, 2014). These developments place a significant demand on teachers to integrate technologies into learning environments and enhance their technological skills. They are also expected to enrich educational processes, improve students’ learning experiences, and guide them in acquiring digital competencies (Iivari et al., 2020; Koral Gümüşoğlu & Akay, 2017; Smirani & Boulahia, 2022; Yildiz Durak, 2019; Yureva et al., 2020). In other words, teachers are expected to lead the digital transformation process. Teachers’ adaptation to this transformation process is crucial for both themselves and their students (Yildiz, 2022). There is a need for a reliable and valid measurement tool that can assess teachers’ approaches and competencies toward digital transformation. When examining the relevant literature, scales aimed at assessing the overall level of digital transformation at the organizational level (Agostino & Costantini, 2022; Kontić & Vidicki, 2018; Lin et al., 2024) are well-documented. At the individual level, scales related to digital transformation focus on businesses (Lin et al., 2024; Nadeem et al., 2018; Sağlam, 2021). Pettersson et al. (2024) developed a scale focused on digitalization, digitization, and digital transformation in the context of sociocultural change in schools and education. In Turkey, adaptation studies have been conducted to determine the level of digital transformation in businesses (Sağlam, 2021).
Despite the existence of scales measuring teachers’ digital competencies (Ghomi & Redecker, 2019; Yilmaz Ergül & Taşar, 2023), digital literacy (Erkam Sulak, 2019; Küslü, 2022), self-assessment of technology competencies (Christensen & Knezek, 2017), and technology integration (Alpaslan et al., 2021; Horzum et al., 2014; Su et al., 2017; A. Y. Wang, 2022), no scale assessing perceptions of digital transformation appears to exist. In this context, the aim of the study is to develop a Digital Transformation Scale (DTS) that assesses teachers’ perceptions of digital transformation and to conduct validity and reliability studies. The Unified Theory of Acceptance and Use of Technology (UTAUT), developed by Venkatesh et al. (2003), was used in the scale development process to explain and predict technology acceptance and use.
Unified Theory of Acceptance and Use of Technology (UTAUT)
In the literature, many theories and models explain and predict the use of technology by individuals (Teo & Noyes, 2014). The UTAUT model, proposed by Venkatesh et al. (2003), provides a comprehensive framework for understanding technology acceptance and usage. This model synthesizes eight established theories: the Theory of Reasoned Action, Technology Acceptance Model, Motivational Model, Theory of Planned Behavior, Combined Technology Acceptance Model, Computer Usage Model, Innovation Diffusion Theory, and Social Cognitive Theory. UTAUT was designed to integrate the strengths of these models, focusing on four key components: performance expectancy, effort expectancy, social influence, and facilitating conditions (Venkatesh et al., 2003). Performance expectancy refers to the belief that using technology will enhance an individual’s job performance and is regarded as the strongest predictor of behavioral intention. Effort expectancy is the perceived ease of using technology. Social influence pertains to the extent to which individuals perceive that significant others encourage the use of a particular technology. Facilitating conditions involve the availability of resources and support for using the technology (Teo & Noyes, 2014; Venkatesh et al., 2003). The model’s ability to consider a wide range of variables to explain technology use is regarded as one of its most distinguishing features (Yildiz Durak, 2019), and it is widely used (Bajunaied et al., 2023). A review of the literature shows that this model has been employed to guide organizations in their digital transformations and has proven successful in identifying variables influencing digital transformation (Hewavitharana et al., 2021; Jayawardena et al., 2023; Tolkun & Tekin, 2022). For this reason, the UTAUT model was used as the foundation for generating the items in this study’s scale.
Digital Transformation in Education
Digital transformation refers to the process of enhancing an entity by implementing substantial changes to its features through the integration of information, communication, and connectivity technologies (Vial, 2021). In the context of educational institutions, digital transformation involves the integration of technological innovations into educational processes and the role these innovations play in improving the quality of education (AL-Ali & Marks, 2022; Mahlow & Hediger, 2019). Digital transformation, with its multidimensional structure, is a combination of both technological and non-technological antecedents (Jayawardena et al., 2023). Therefore, before implementing digital transformation in an institution, the key components that require attention must be assessed (Hewavitharana et al., 2021). The Unified Theory of Acceptance and Use of Technology is utilized to manage institutions’ digital transformation processes. When examining the impact of the model’s key determinants on digital transformation:
Gender and Age in Digital Transformation: Measurement Invariance
In the social and behavioral sciences, self-report surveys are frequently used to assess various aspects of human behavior. These surveys consist of items developed to measure an underlying construct in order to track individuals over time or compare different groups (van de Schoot et al., 2012). For these constructs to be compared across groups, the survey must function similarly in each group, meaning that measurement invariance must be established (D’Urso et al., 2022). Through measurement invariance, researchers aim to determine whether a scale exhibits the same measurement properties across two or more samples (Fischer & Karl, 2019). In this study, measurement invariance analyses were conducted. Digital transformation has altered the ways people live, work, and interact. Gender and age play a role in how individuals perceive, apply, and experience this transformation (Genz & Schnabel, 2023; Kim et al., 2021; Larsson & Viitaoja, 2019; Tran Van Hai, 2022). Similarly, Venkatesh et al. (2003) note that gender and age act as moderating factors in technology usage. In this study, participants were categorized by age based on Prensky’s (2001) distinction between digital natives and digital immigrants. Prensky (2001) defines individuals born after 1985 as digital natives and those born earlier as digital immigrants. The terms digital natives and digital immigrants are popular in the literature. A search using the keywords “Digital Natives” and “Digital Immigrants” revealed 369 publications in the Web of Science database and 399 publications in the Scopus database. A search using only the keyword “Digital Natives” found 2,173 publications in the Web of Science database and 807 in the Scopus database (as of September 2024).
In areas such as digital transformation, which are rapidly changing and influenced by demographic factors, ensuring measurement invariance across gender and age is considered essential for obtaining meaningful results. Moreover, establishing measurement invariance across gender and age allows for reliable comparisons of the impact of the factors predicted by the Unified Theory of Acceptance and Use of Technology on different demographic groups.
Method
In this study, the process of scale development and validation was based on Schwab (1980). The scale was developed using a three-step procedure: (1) item development, (2) content validation, and (3) construct validation (Schwab, 1980). In the first step, the study’s target population (teachers) and the purpose (assessing perceptions of digital transformation) were defined, and while generating the items, UTAUT was adopted as the guiding theoretical framework. The content of the digital transformation scale to be measured was designed, and the initial form was created. For content validation, expert evaluation was sought. For construct validation, exploratory factor analysis (EFA) and confirmatory factor analysis (CFA) were conducted. The process followed is shown in Figure 1.

Scale development process.
Development of Scale Items
When developing a scale, the items should not be randomly selected but based on a solid theoretical framework. The theoretical structure defines which traits or behaviors the scale aims to measure (Mumford et al., 1996). In this study, the UTAUT, which considers multiple variables to evaluate technology usage, is still widely used, and has proven successful in identifying the variables that influence digital transformation. UTAUT was considered the most appropriate model for this research (Bajunaied et al., 2023; Hewavitharana et al., 2021; Jayawardena et al., 2023; Rejali et al., 2023; Strzelecki, 2024; Tolkun & Tekin, 2022; Yildiz Durak, 2019). A comprehensive literature review was conducted, and items were generated using a deductive approach for each component of the theory—performance expectancy, behavioral intention, social influence, and facilitating conditions (Hinkin, 1995). This step is considered crucial for establishing the structural validity of the measurement tool (Mumford et al., 1996).
While developing the scale items, care was taken to express them in simple terms that even participants unfamiliar with technology could understand and to ensure that the items were related to participants’ real-world experiences (Jang et al., 2022). Several considerations were taken into account during item preparation: ensuring high validity (directly measuring the behavior in question) and clarity for participants. In line with these criteria, a pool of 12 items was prepared.
Content Validity
To ensure that the scale reflects the intended structure (Morgado et al., 2017), the draft items were presented to three experts familiar with the UTAUT. Based on their recommendations, feedback from five academics specializing in educational sciences was also sought, with particular emphasis on including an expert in measurement and evaluation. Experts were asked to evaluate each of the candidate items in the item pool. Several techniques are commonly used to assess content validity, with two of the most widely accepted being the Davis and Lawshe techniques. The Davis Technique focuses on determining the content validity index (CVI) based on expert evaluations. In this method, experts rate the scale items as either “appropriate” or “inappropriate.” Items are typically scored on a scale from 1 to 4 (1: Definitely inappropriate, 2: inappropriate, 3: appropriate, and 4: definitely appropriate). An acceptable CVI value is generally 0.80 or higher, meaning that at least 80% of the experts find the item appropriate, indicating that the item has sufficient content validity (Davis, 1992).
The Lawshe Technique is another structured approach to assessing content validity. Lawshe’s content validity ratio (CVR) formula is used for this purpose. In this technique, experts are asked to evaluate each item as “essential,”“useful but not essential,” or “not essential.” The CVR value is calculated based on the proportion of experts who mark the item as “essential.” The CVR calculation formula is as follows:

A positive CVR value indicates that the item is deemed “essential” by the experts. In the Lawshe Technique, as the number of experts increases, the minimum acceptable CVR value decreases. However, as a general rule, a CVR value of 0.50 or higher is considered sufficient for content validity (Lawshe, 1975). Based on expert feedback, two items were removed from the draft form following the application of these content validity techniques. For the remaining items, the CVI value calculated using the Davis technique was 0.90. Additionally, the CVR value calculated using the Lawshe Technique was found to be greater than 0.50.
Based on the feedback from the experts and the techniques used, the final version of the items was reviewed by a linguist. At this stage, the linguist evaluated the items in terms of grammatical rules. The final version was then prepared for the preliminary pilot testing phase.
Preliminary Application
A preliminary pilot study of the scale, which was developed based on expert opinions and reviewed by a linguist, was conducted with a participant group of 43 individuals representing the target population. During this application, participants were encouraged to openly express any difficulties or misunderstandings they encountered. At the end of the pilot study, the findings were evaluated with the experts who contributed to the scale development process, and based on their recommendations, one item that posed issues in terms of “comprehensibility” was removed from the scale. As a result of these steps, a new version of the scale consisting of a total of nine items was prepared and made ready for implementation.
Data Collection Process
In the study, participants were asked to read and provide consent through an informed voluntary consent form, which was conducted within the school environment. The researchers thoroughly explained the purpose of the study, its implementation method, confidentiality principles, and the voluntary nature of participation. After these explanations, data were collected from the teachers who agreed to participate in the study. Forms, including the Personal Information Form, the Digital Transformation Scale, the 21st Century Technology Literacy Skills Scale, and the Resistance to Change Scale, were distributed to the teachers. Some forms were collected on the same day, while others were retrieved from the schools by the researchers a few days later, and the participants were thanked for their contributions.
Data Analysis
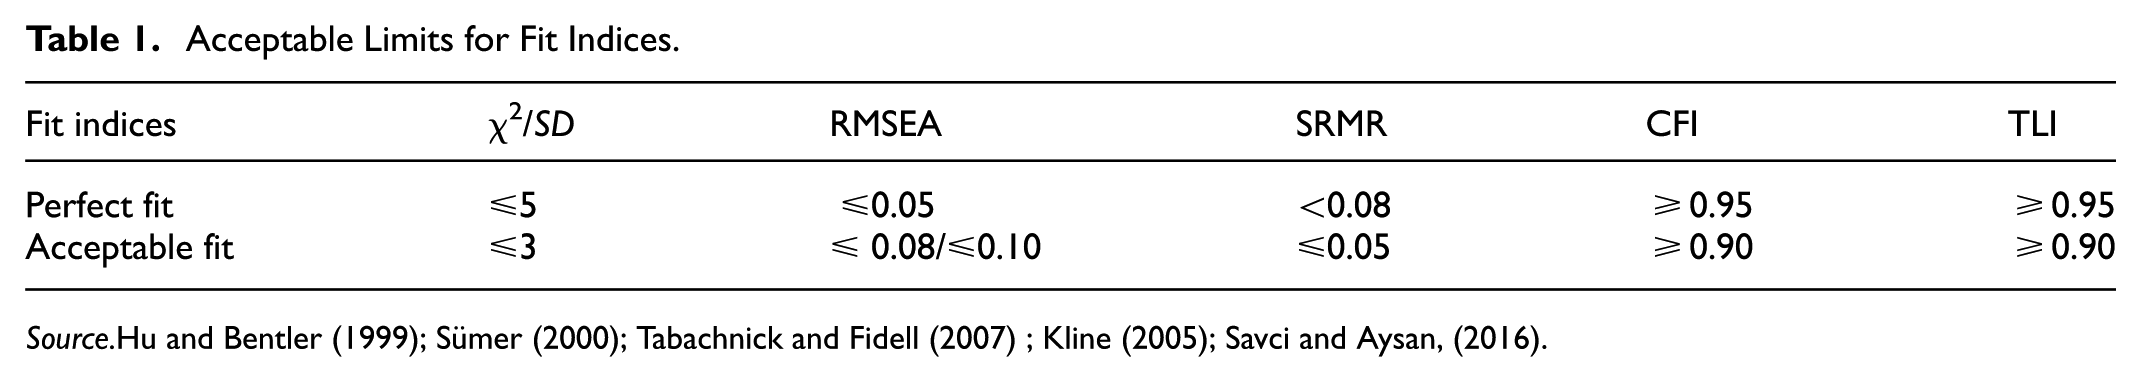
The draft scale was examined for construct validity using Exploratory Factor Analysis (EFA) and Confirmatory Factor Analysis (CFA). During the EFA, the principal axis factoring method, which is commonly used in factor analysis, was preferred (de Winter & Dodou, 2012; Tabachnick & Fidell, 2007). When determining the cutoff point for factor loadings, various approaches in the literature were considered, and the generally recommended loading value of 0.40 was adopted (Field, 2009; Hair et al., 2010; Tabachnick & Fidell, 2007). Items with a loading value above 0.30 and a difference of less than 0.10 in loading values across two factors were considered cross-loading items and were removed from the scale (Hair et al., 2010; Worthington & Whittaker, 2006). Additionally, since it was assumed that the factors were correlated, the promax method, one of the oblique rotation techniques, was used in the EFA (Grieder & Steiner, 2021). Based on the CFA results, values such as chi-square goodness of fit (χ2/df), goodness of fit index (GFI), root mean square error of approximation (RMSEA), comparative fit index (CFI), and standardized root mean square residual (SRMR) were calculated to evaluate the model’s fit (Çokluk et al., 2010). Acceptable limits are presented in Table 1.
Acceptable Limits for Fit Indices.
In this study, the average variance extracted (AVE) and composite reliability (CR) values, as recommended by Fornell and Larcker (1981), were calculated to determine convergent validity. The AVE value is expected to be at least 0.50, and the CR value should be higher than the AVE value (Fornell & Larcker, 1981). Additionally, to assess the reliability of the scale, Cronbach’s alpha internal consistency coefficient and test-retest reliability values were calculated (DeVellis, 2017).
Furthermore, measurement invariance was conducted to determine whether the scale measures the same construct across different demographic groups. Measurement invariance is typically assessed by examining changes in χ2 (Byrne et al., 1989). Additionally, it is recommended to calculate the Tucker-Lewis Index (TLI), root mean square error of approximation (RMSEA), standardized root mean square residual (SRMR), and Comparative Fit Index (CFI) values (Cheung & Rensvold, 2002; Vandenberg & Lance, 2000; van de Schoot et al., 2012). The threshold for ΔCFI and ΔTLI is at least 0.01, and for ΔRMSEA and ΔSRMR, the threshold is 0.015 (Chen, 2007; Cheung & Rensvold, 2002). In this study, we aimed to determine whether the digital transformation scale demonstrated measurement invariance across gender (male and female) and age (below 40 and above 40) categories. The age categorization was made according to Prensky’s (2001) distinction between digital natives and digital immigrants. Based on the balanced number of participants, they were divided into two groups: digital natives under the age of 40 (n = 117) and digital immigrants over the age of 40 (n = 127). To ensure invariance, the chi-square difference test was used along with the ΔCFI, ΔTLI, ΔRMSEA, and ΔSRMR criteria.
Study Group
To ensure the validity and reliability of the scale, data were collected from a sufficiently large and appropriate sample representing the target group. During the scale development process, five different study groups were involved: Pilot Study, EFA, CFA, Criterion Validity, and Test-Retest samples. When reviewing the relevant literature on sample size in scale development, some authors suggest that a minimum sample size of 200 is recommended (Hair et al., 2010; P. Kline, 1994), while others propose determining the sample size based on the number of items. It is generally accepted that there should be at least 10 participants per item, but an ideal participant-to-item ratio is recommended to be 15 or 20 (Clark & Watson, 1995; DeVellis, 2017). In this context, a pilot study was initially conducted with 43 teachers working in eastern Turkey. For Exploratory Factor Analysis (EFA), data were collected from 214 teachers in the same region, while Confirmatory Factor Analysis (CFA) was conducted with 211 teachers working in a city in southeastern Turkey. Additionally, the criterion validity of the digital transformation scale was assessed with a randomly selected sample of 244 teachers from both cities. The test-retest reliability of the digital transformation scale was evaluated with 116 teachers over a 3-week interval. In conclusion, the scale development process involved a total of 828 teachers working in different cities. Demographic information about the study group is presented in Table 2.
Demographic Information of the Study Group.
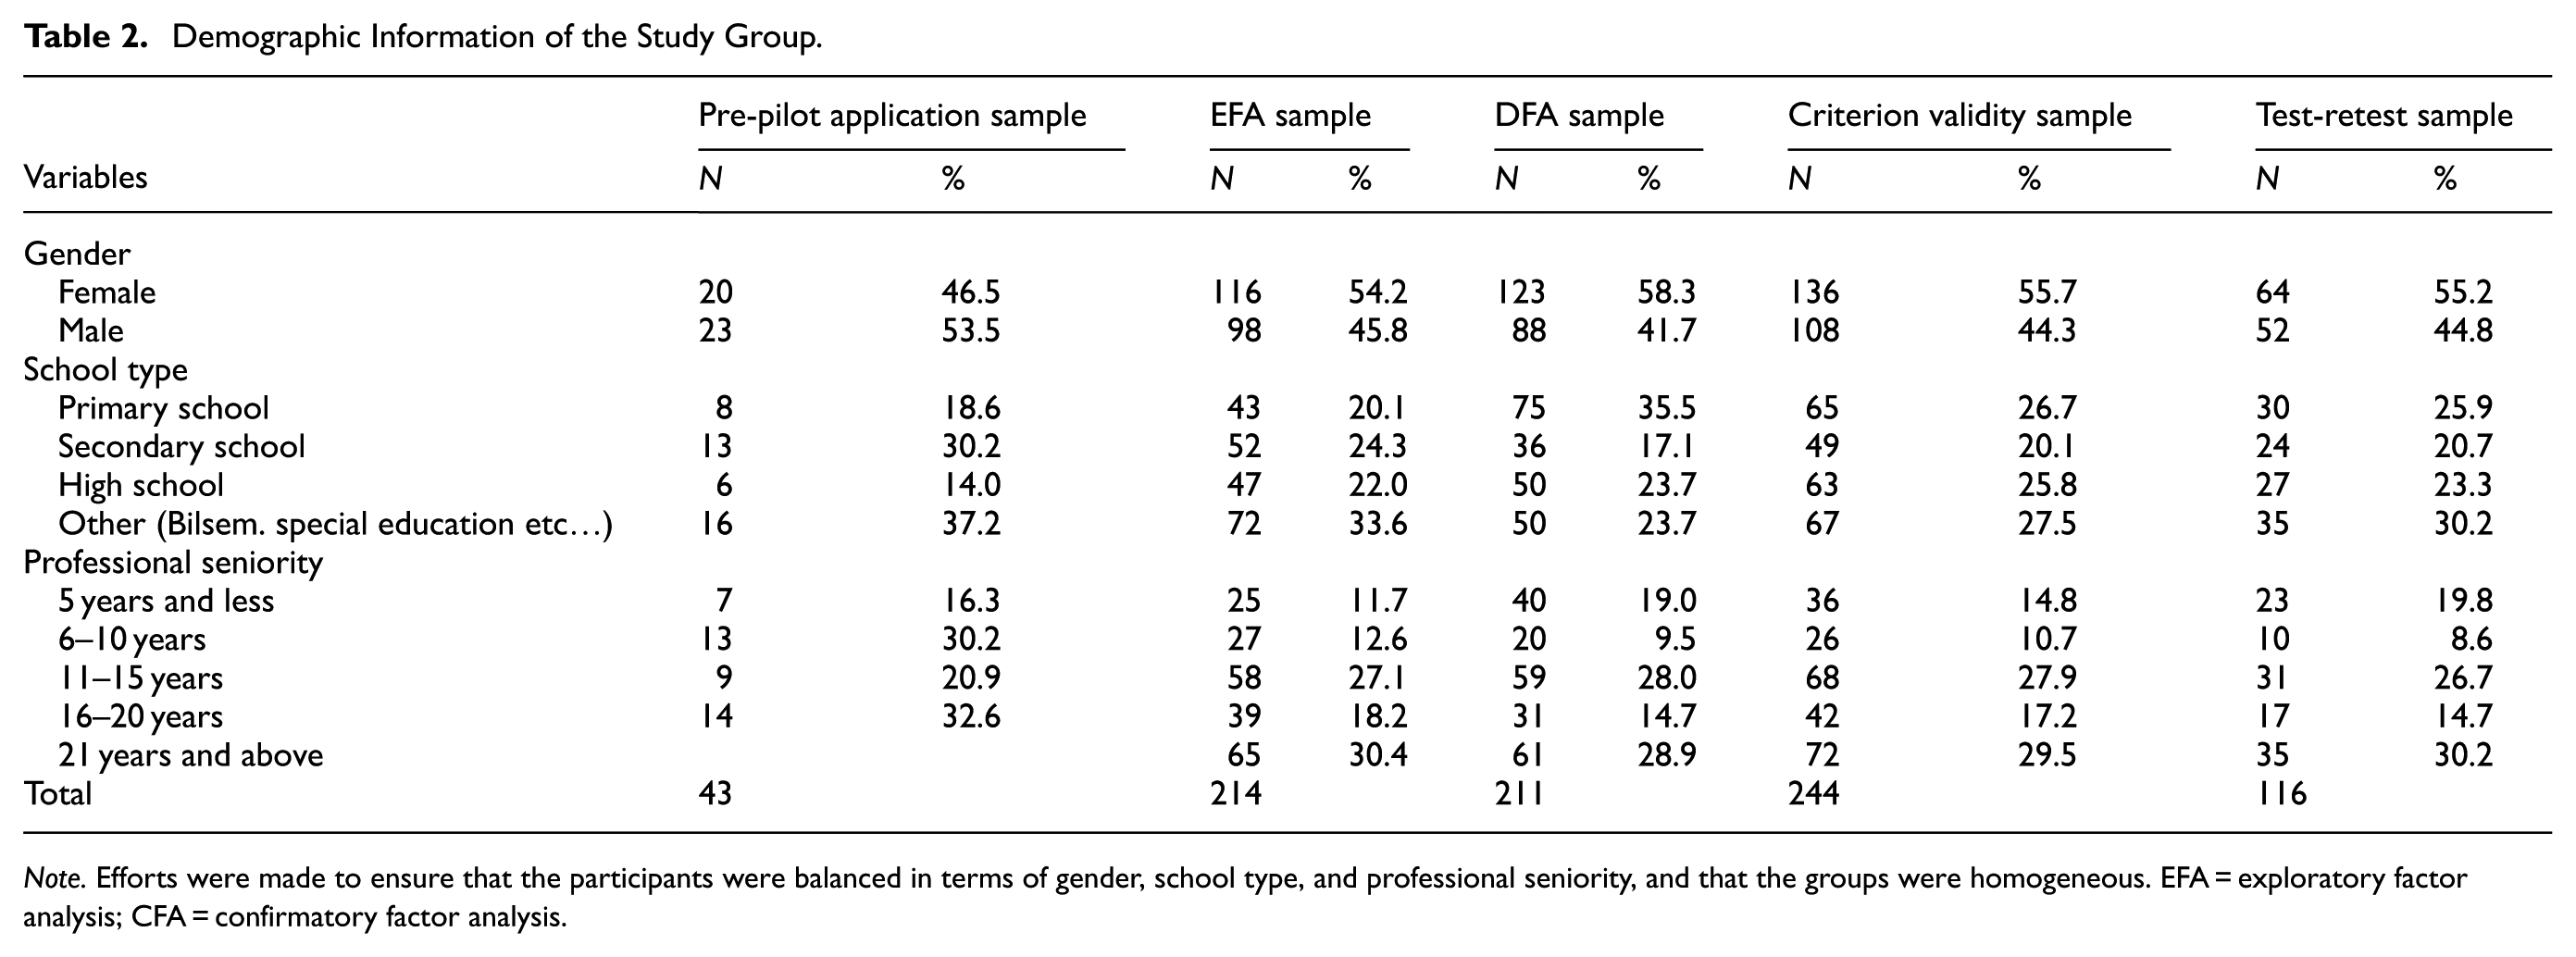
Note. Efforts were made to ensure that the participants were balanced in terms of gender, school type, and professional seniority, and that the groups were homogeneous. EFA = exploratory factor analysis; CFA = confirmatory factor analysis.
Data Collection Instruments
In this study, data were collected using the 21st Century Technology Literacy Skills Scale (TLSS), Resistance to Change Scale (RCS), Digital Transformation Scale (DTS), and Personal Information Form.
Findings
Construct Validity
Exploratory Factor Analysis (EFA)
Factor analysis is one of the most commonly used techniques in scale development studies to achieve construct validity (Çokluk et al., 2010). In this study, EFA was conducted with data obtained from 214 teachers working in eastern Turkey. Before conducting factor analysis, the suitability of the data for factor analysis was assessed using the Kaiser-Meyer-Olkin (KMO) test and Bartlett’s Test of Sphericity. The results showed a KMO value of 0.910, and for Bartlett’s test, χ2 = 1235.442 (p < .000). A KMO value above 0.90 and significant results from Bartlett’s test indicate that the data are suitable for EFA (Çokluk et al., 2010; Field, 2009; Tabachnick & Fidell, 2007).
Using principal component analysis, EFA was conducted on eight items. In EFA, it is important to reveal relationships between items with as few factors as possible. In this context, factors with eigenvalues of 1 or higher should be considered (Hutcheson & Sofroniou, 1999). Additionally, an item’s factor loading must be 0.40 or higher, and the difference between the factor loading on its respective factor and other factors should be 0.10 or greater (Büyüköztürk, 2012). According to these criteria, the item loadings were deemed appropriate, but item nine loaded on multiple factors, with a difference in loadings less than 0.10. Therefore, this item was excluded from the analysis. As a result, the remaining eight items were found to form a single-factor structure, which met the specified criteria. The results of the EFA are presented in Table 3.
EFA Results for the Digital Transformation Scale.

The factor loadings of the items ranged from 0.730 to 0.874, indicating that the items represent the scale well (Field, 2009; Hair et al., 2010; Tabachnick & Fidell, 2007). As shown in Table 3, the eigenvalue of the one-factor structure was 5.419, explaining 67.73% of the total variance. It is expected that the total variance explained exceeds 30%, and a higher variance explained indicates a better representation of the construct (Büyüköztürk, 2012; Comrey & Lee, 1992; Çokluk et al., 2010; Savcı et al., 2018; Tavşancıl, 2010). Therefore, the scale is considered to measure digital transformation effectively.
A scree plot is used to determine the number of factors in the scale. The plot shows factor eigenvalues, and the point where the plot begins to flatten indicates the number of factors (Cattell, 1966).
The scree plot for the Digital Transformation Scale is presented in Figure 2.
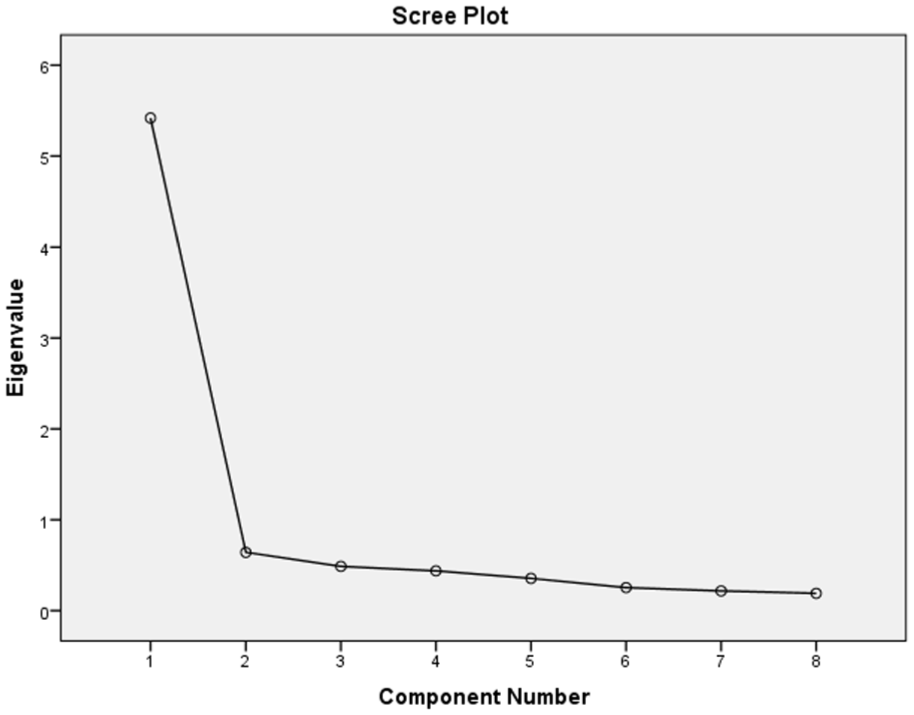
Scree plot for the digital transformation scale.
The scree plot shows that the graph flattens after 1, confirming that the scale is one-dimensional (Cattell, 1966).
Confirmatory Factor Analysis (CFA)
The one-dimensional structure revealed by EFA was tested using CFA with data collected from 206 teachers (Figure 3).

CFA results for the digital transformation scale.
The CFA results confirmed that the eight-item, one-dimensional model of the Digital Transformation Scale had good fit indices (χ2 = 64.304, df = 19, χ2/df = 3.384, RMSEA = 0.078, SRMR = 0.03, CFI = 0.95, TLI = 0.93), as shown in Figure 3. The factor loadings of the items ranged from 0.656 to 0.848, and they were statistically significant (Buyukozturk, 2012).
Criterion Validity
The criterion validity of the Digital Transformation Scale was evaluated using the 21st Century Technology Literacy Skills Scale and the Resistance to Change Scale. Data were collected from a sample of 244 teachers for this analysis. Correlation analysis was conducted with the collected data. The results of the criterion validity are presented in Table 4.
Criterion Validity Correlations for the Digital Transformation Scale.
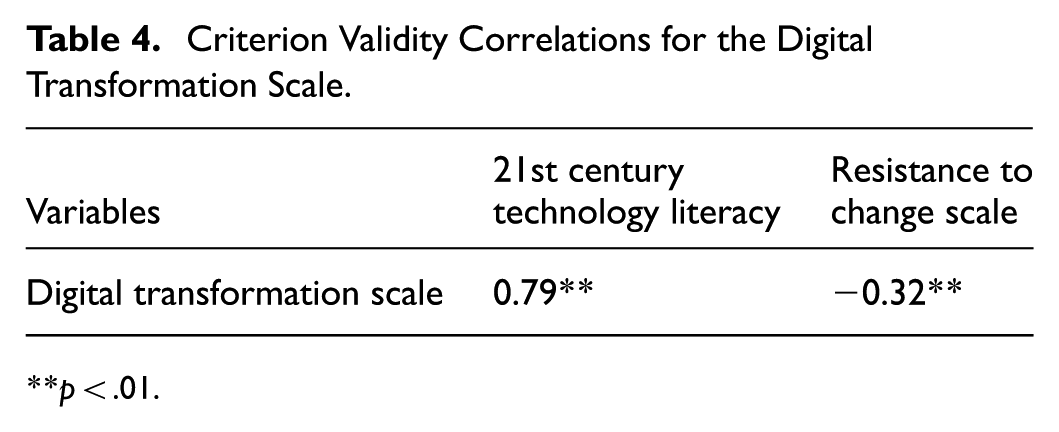
p < .01.
The analysis in Table 4 shows that there was a positive correlation between the Digital Transformation Scale and the 21st Century Technology Literacy Skills Scale (r = .79, p < .01), and a negative correlation with the Resistance to Change Scale (r = −.32, p < .01).
Reliability
The reliability of the Digital Transformation Scale was assessed using Cronbach’s alpha internal consistency coefficient and test-retest reliability. The reliability studies were conducted across three different samples (Table 5).
Reliability Values of the Digital Transformation Scale.

p <.01.
In the sample used for Exploratory Factor Analysis (EFA), the Cronbach’s α internal consistency reliability coefficient was determined to be .93. For the Confirmatory Factor Analysis (CFA) sample, this coefficient was found to be .91. Additionally, for the sample used in the criterion validity analysis, the Cronbach’s α value was recorded as .92. As presented in Table 5, these results indicate that the reliability coefficients calculated for all three samples were at a high level. Furthermore, to evaluate whether the digital transformation scale yielded consistent results over time, the test-retest method was applied. The test-retest analysis was conducted with 102 teachers from the CFA sample, with data collected at 3-week intervals. The correlation between the two administrations was found to be .73. Additionally, the composite reliability (CR) of the developed scale was calculated to be 0.92, and the average variance extracted (AVE) for convergent validity was determined to be 0.59. These findings support the reliability of the scale.
Item Analysis
The item-total correlation value was calculated for each item in the scale. Item-total correlations of .40 and above are considered satisfactory (Aday & Cornelius, 2006). Items with values above this threshold are considered to have excellent discriminatory power. A positive correlation indicates that items are consistently related to other items within the same scale. The discriminatory power of DTS items was evaluated using the top and bottom 27% rule and corrected item-total correlation coefficients. In the EFA sample, correlation coefficients ranged from .61 to .75, and the 27% difference ranged from 9.01 to 6.41 (t-values; p < .001). In the CFA sample, these values were 0.58 to 0.67 and 8.14 to 6.27, respectively; in the criterion validity sample, they were 0.60 to 0.68 and 8.71 to 6.35 (t-values; p < .001). The results are presented in Table 6.
Item Analysis.

p <,001.
Based on these results, it can be concluded that the items in the scale adequately reflect the overall structure of the test.
Measurement Invariance
The categories determined by gender and age variables were evaluated across four levels of measurement invariance: configural, metric, scalar, and strict. The results are presented in Table 7.
Measurement Model Results.

p >,01.
Tests for gender invariance yielded the following fit statistics for the different models: The configural model had χ2 (36) = 94.673, CFI = 0.947, TLI = 0.917, RMSEA = 0.094, and SRMR = 0.041. For the metric model, the values were χ2 (43) = 101.092, p=.491, CFI = 0.947, TLI = 0.931, RMSEA = 0.085, and SRMR = 0.076, indicating invariance. Similarly, the scalar model showed χ2 (50) = 111.385, p=.271, CFI = 0.944, TLI = 0.938, RMSEA = 0.081, and SRMR = 0.081, confirming invariance. Lastly, the strict model displayed χ2 (58) = 131.214, p=.172, CFI = 0.934, TLI = 0.936, RMSEA = 0.085, and SRMR = 0.062, confirming invariance. Therefore, the dataset met the requirement for invariance of the gender measure across the metric, scalar, and strict models. This is supported by insignificant χ2 difference tests and consistent changes in CFI, TLI, RMSEA, and SRMR. The nonsignificant p (χ2) values provide additional evidence that invariance holds.
Tests for age invariance yielded the following fit statistics for the different models: The configural model had χ2 (38) = 101.601, CFI = 0.955, TLI = 0.933, RMSEA = 0.090, and SRMR = 0.036. For the metric model, the values were χ2 (45) = 103.757, p=.950, CFI = 0.958, TLI = 0.948, RMSEA = 0.077, and SRMR = 0.049, indicating invariance. Similarly, the scalar model showed χ2 (52) = 106.995, p=.979, CFI = 0.961, TLI = 0.958, RMSEA = 0.068, and SRMR = 0.051, confirming invariance. Lastly, the strict model displayed χ2 (60) = 124.206, p=.862, CFI = 0.954, TLI = 0.957, RMSEA = 0.070, and SRMR = 0.085, confirming invariance. Therefore, the dataset met the requirement for invariance of the age measure across the metric, scalar, and strict models. This is supported by insignificant χ2 difference tests and consistent changes in CFI, TLI, RMSEA, and SRMR. Morover the nonsignificant p (χ2) values provide additional evidence that invariance holds.
Conclusion and Discussion
In this study, we developed the DTS to evaluate the perceptions of digital transformation among teachers in schools in Turkey. First, we conducted a literature review and created an initial pool of 12 items. For content validity, feedback on the appropriateness and clarity of the items was gathered from three experts familiar with the UTAUT, followed by input from five other field experts. In doing so, we applied the Davis and Lawshe techniques. As a result of the methods used, including the pilot study and EFA, four items were eliminated. The remaining eight items were then evaluated for construct validity using three different samples. To determine construct validity, both EFA and CFA methods were employed. The criterion validity of the DTS was tested by examining its relationship with the 21st Century Technology Literacy Skills Scale (TLSS) and the RCS. Cronbach’s alpha values were calculated for each sample, and reliability analyses were conducted using the test-retest method. Corrected item-total correlation coefficients and differences between the top and bottom 27% groups (t-values) were also calculated. The EFA results for the DTS indicated a one-factor structure with items having eigenvalues greater than 1. Factors should explain between 40% and 60% of the total variance (Hair et al., 1986; Scherer et al., 1988; Tavşancıl, 2010). The results showed that the one-factor structure explained a large proportion of the total variance. Each item’s factor loading should be at least 0.30 (Büyüköztürk, 2012; Şencan, 2005; Sipahi et al., 2008), and all of our items met this criterion. The CFA results from different samples also confirmed that the model had acceptable fit indices (Büyüköztürk, 2012; Çokluk et al., 2010; T. J. Kline, 2005).
According to the criterion validity analysis, a positive relationship was found between the DTS and the TLSS scores, indicating that higher perceptions of digital transformation are associated with improved technology literacy skills. A negative relationship was observed between the DTS and RCS scores, suggesting that as perceptions of digital transformation increase, resistance to change decreases. In the reliability analysis, Cronbach’s alpha coefficients were found to be sufficient in all three samples. The test-retest method also confirmed the reliability of the scale. In the item analyses, the DTS demonstrated satisfactory corrected item-total correlation coefficients. The differences between the top and bottom 27% groups were statistically significant in all samples. In conclusion, the DTS has been shown to be a reliable and valid measurement tool.
According to the UTAUT, moderating factors such as gender, age, experience, and voluntariness play a significant role in technology acceptance (Omar et al., 2019; Venkatesh et al., 2003). These factors determine how individuals approach technology and under what conditions they begin to adopt and use it. When examining digital transformation processes in the field of education, the perceptions that teachers develop in line with these factors have a significant impact on the digitalization process. Analyzing the differences in teachers’ perceptions of digital transformation based on factors such as gender and age allows for more effective implementation of digital education strategies. In this context, the DTS was developed to measure the perceptions of digital transformation among teachers in Turkey. Validity and reliability tests of the scale were conducted on five different samples, and the results demonstrated that the DTS is a reliable measurement tool. Furthermore, measurement invariance analyses based on UTAUT factors such as gender and age revealed the consistency of digital transformation perceptions among teachers and the influence of these factors on their perceptions. When teachers have a high perception of digital transformation, the quality and efficiency in education increase, whereas when this perception is low, the process of adopting and using technology is negatively affected. Therefore, accurately measuring teachers’ perceptions of digital transformation is critical to the success of digitalization in education. In the future, the application of the DTS across different cultural and demographic groups will contribute to evaluating digital transformation processes from different perspectives. Understanding how teacher groups from various cultural and socio-demographic backgrounds perceive these processes can help develop new approaches to global digitalization strategies. The final version of the scale developed in this study is presented in Appendix 1.
Limitations and Future Research
This study contributes to the understanding of teachers’ perceptions of digital transformation through the development and validation of the DTS. However, it is important to acknowledge some limitations. First, the sample was drawn exclusively from teachers in specific regions of Turkey, which may limit the generalizability of the findings. Future research should consider expanding the sample to include teachers from various geographical locations and educational contexts to enhance the external validity of the scale. Second, while this study effectively validated the DTS using confirmatory factor analysis, the research relied on cross-sectional data. Longitudinal studies are recommended to further assess the scale’s stability and the changes in teachers’ perceptions of digital transformation over time. This will help establish the scale’s robustness and its applicability in different educational settings. Third, this study focused on the measurement of teachers’ perceptions regarding digital transformation. Future research could explore the impact of these perceptions on teaching practices and student outcomes, providing valuable insights into the practical implications of digital transformation in education. Lastly, the DTS should be tested in various educational settings, including different educational levels (e.g., primary, secondary, and higher education) and subjects, to determine its effectiveness and relevance across diverse teaching environments. Addressing these limitations will allow future studies to contribute to a more comprehensive understanding of digital transformation in education and the factors influencing its successful implementation.
Footnotes
Appendix
Digital Transformation Scale.

| Digital Transformation Scale Please read the following statements carefully. Then mark the appropriate option from the options given on the right side of the statement. ①Strongly Disagree ②Disagree ③Neutral ④Agree ⑤Strongly Agree |
||||||
| 1 | I use digital technologies (computer, tablet, smartphone, etc.). | ① | ② | ③ | ④ | ⑤ |
| 2 | I adapt easily to developments in digital technologies. | ① | ② | ③ | ④ | ⑤ |
| 3 | I use digital technologies in educational activities. | ① | ② | ③ | ④ | ⑤ |
| 4 | I think it is useful to use digital technologies in educational activities. | ① | ② | ③ | ④ | ⑤ |
| 5 | I enjoy using digital technologies. | ① | ② | ③ | ④ | ⑤ |
| 6 | Using digital technologies (computers, tablets, smartphones, etc.) has become a habit for me. | ① | ② | ③ | ④ | ⑤ |
| 7 | The effort I put into using digital technologies (computers, tablets, smartphones, etc.) is reasonable. | ① | ② | ③ | ④ | ⑤ |
| 8 | I think that I will continue to use digital technologies (computer, tablet, smartphone, etc.). | ① | ② | ③ | ④ | ⑤ |
Author Contributions
All authors contributed to the conception and design of the study, read, and edited the manuscript, and suggested improvements at several stages during the preparation and revision of the manuscript. All authors have read and agreed to the published version of the manuscript.
Funding
The authors disclosed receipt of the following financial support for the research, authorship, and/or publication of this article: This research was received by the Firat University Scientific Research Projects Management Unit (Project No: EF.25.03).
Declaration of Conflicting Interests
The authors declared no potential conflicts of interest with respect to the research, authorship, and/or publication of this article.
Data Availability Statement
Data will be made available on reasonable request.