
Abstract
Increased usage of technology is linked with poverty reduction, in existing literature but also rising income inequality due to microeconomic factors. This paper attempts to investigate how the technological penetration has impacted poverty levels and income inequality, at the global level and across different levels of income. Using data for 86 countries between 2005 and 2020, the paper employs a robust two step Systematic Generalized Moment Method (Sys-GMM) to assess the linear effect, non-linear effect, and synergy effect models. The results indicate that technological penetration has a different impact across countries, depending on the income levels. The positive association between technology and income inequality has repercussions for low-income countries, in particular. From a policy perspective, it is essential to consider macro- and micro-economic factors that affect the impact of technology penetration in low-income countries.
Main Highlights
The spread of COVID-19 has resulted in the uptake of technology at unprecedented levels, particularly in health and education.
Increased usage of technology is linked with poverty reduction in existing literature but also rising income inequality due to microeconomic factors.
This paper attempts to investigate how the technological penetration has impacted poverty levels and income inequality, both at the global level and by different levels of income. Using data for 86 countries between 2005 and 2020, the paper employs a robust two step systemic GMM to assess the linear effect, non-linear effect, and synergy effect models.
Introduction
Sustainable Development Goals (SDGs) were introduced by the United Nations (UN), in 2015, and encompassed aims to eradicate poverty and minimize inequality, by the year 2030, stated in goals 1 and 10, respectively (United Nations, 2021). In this context, overcoming poverty and inequality are crucial components of development and their connections with technological penetration are an important subject for research (Mushtaq & Bruneau, 2019).
Relevant research has found a positive relationship between technology penetration and economic development (Aghion et al., 2019; Haini, 2019; Ng et al., 2013; Sassi & Goaied, 2013). Technological penetration can increase economic growth and decrease income inequality (Ghosh, 2020; Pradhan et al., 2016). Technology penetration supports diffusion of innovation and provides improved labor skills, leading to economic growth (Siddiqui & Singh, 2019). It also minimizes transaction costs and increases the productivity of firms (Roller & Waverman, 2001). The development cycle is then completed with an increase in employment opportunities, due to the raised productivity (Yushkova, 2014). It has also been discovered that technological penetration supports financial development and, through this, economic progress (Mushtaq & Bruneau, 2019).
This study attempts to investigate how the technological penetration has impacted poverty levels and income inequality, across different countries and income levels. Using data for 86 countries for the 2005 to 2020 period, the article employs a robust two step Sys-GMM to assess the linear effect, non-linear effect, and synergy effect models. The results indicate that technological penetration has a different impact across countries, depending on income levels.
Our study has made multiple contributions to this topic. Research on the impact of technology and financial inclusion on poverty and inequality is rare (Mushtaq & Bruneau, 2019) so this study has helped to fill an important gap in existing knowledge. Our research has also made a contribution by using more sophisticated econometric analysis, the Sys-GMM (Ng et al., 2013) to provide valuable insights on the topic. The variations leading to inequality and poverty are concentrated in economic elements such as trade, infrastructure, and economic growth while the role of Information and Communication Technology (ICT) is focused on rarely in the literature (Richmond & Triplett, 2018). So this research has contributed by investigating the role of technology (internet penetration) in reduction of poverty and inequality.
Section 2 discusses Technology (Internet Penetration), Poverty, and Inequality as each element under analysis. Section 3 presents the research methodology. Section 4 underlines and discusses the results. Section 5 offers policy recommendations and concludes the article.
Technology, Poverty, and Inequality
Technology
An extension of Information Technology (IT) is ICT which incorporates communication technologies as well (AIMS, 2021). In this area, technological penetration can be defined as the adaptability of technology (internet usage) by individuals into their daily lives (IGI Global, 2021). ICT penetration, foreign direct investment (FDI), and international trade are amongst the drivers of economic growth (Arvin et al., 2021; Lakhanpal, 2021; Müller, 2021) which is why it is important to study these factors. Bahrini and Qaffas (2019) identify internet usage, broadband adoption, and mobile phones as the main drivers of economic growth. To attain the maximum benefit of these drivers, supporting policies for ICT infrastructure are necessary. This also shows the importance of the role played by technology in economic development.
This technological penetration has multiple benefits. It increases the incidence of paperless trade, leading to the ease of doing business (Siddiqui & Singh, 2021) which helps attain economic growth. ICT also supports innovations that place an economy on the growth path (Cardona et al., 2013). Diffusion of IT infrastructure can lower income inequality (Kocsis, 2020). Technological penetration can generate higher productivity through three main channels, identified by Bartel et al. (2007). First, customized IT-based equipment is likely to improve productivity. Second, new technologies might boost efficiency. Third, new labor is hired to handle the new equipment and these workers are often more productive. Therefore, technological innovation, economic growth, and employment tend to grow together (Horbach & Rammer, 2020; Roos & Shroff, 2017). Importantly, employment in more productive sectors mens more poverty alleviation (Hull, 2009).
For assessing technological penetration in a particular region, identification of mobile cellular and broadband subscriptions along with internet users is an appropriate choice. Therefore, development demands technological support with traditional economic factors, in the modern world. Investment in ICT is a significant contributor toward technological penetration (Sridhar & Sridhar, 2007; Waverman et al., 2005) and labor productivity (Adekola & Sergi, 2008) so this is also a relevant measure.
Poverty
Poverty refers to the inability to obtain a standard of living that is considered socially acceptable (Bellù & Liberati, 2005; World Bank, 2001). For estimating poverty, National Poverty Lines and Poverty Scorecard are two standardized measures that are commonly utilized. Research has highlighted some factors that can help to mitigate household poverty. These factors include the age of the household head, education, ownership of operational land, and the number of income earners (Memon et al., 2019). Research has also found that the introduction of technology lowers the per-capita cost of maintaining a standard of living and augments the consumption of large households so that they can escape poverty (Jayasinghe et al., 2018).
ICT is useful for poverty reduction as it provides employment opportunities, contributes to value chain creation and generates income (Orokpo & Ochanja, 2017). The introduction of technologies, such as nanotechnology, has led to fruitful results by increasing income per capita (Abid et al., 2019). Further, the adoption of new technologies plays a vital role in rural development and reduces urban-rural gaps (Aklin et al., 2018). Minimizing technological gaps alleviates poverty between countries also (You et al., 2020).
Another concept that connects technology penetration with poverty is digital poverty, which is defined as a lack of access to technology for a segment of a population (Barrantes, 2007). Therefore, it becomes essential to regulate technology access to attain the maximum benefit of technology. So, for poverty reduction, policy interventions focusing on ICT are becoming more important (Diga et al., 2013).
Inequality
Inequality refers to unequal or/and unjust distribution of resources, in a particular society (Koh, 2020). Lower levels of inequality signify durable and fast growth of an economy (Berg et al., 2018). The Gini index measures income distribution across a population so it shows economic inequality. The value ranges from 0 to 1 (or 0%–100%), with 0 showing perfect equality and 1 showing perfect inequality.
This inequality is affected by several economic factors. Research has found that trade is often associated with a lower level of disparity (Do et al., 2022). Demographic characteristics, per-capita income, and the rule of law tend to affect financial inclusion which is related to lower levels of income inequality and poverty (Park & Mercado, 2018) so these factors have an indirect effect. It has been found that technological change can lead to income disparity as the former produces skill biases (Acemoglu, 2002, 2003). Income and education distributions become more unequal with rapid technological progress (Lee & Lee, 2018). However, it has also been found that technological penetration can reduce inequality (Asongu & Odhiambo, 2019; Kraemer et al., 2005). Through enhanced access to the Internet, individuals and enterprises have more information available at a lower cost, which helps lower income inequality (Khan et al., 2020).
Theoretical Background and Model Construction
Social exchange theory suggests that trade-off will only occur between two groups if the offering party is proposing something that is valued by the other (Roeckelein, 2006). Similarly, the technological acceptance model clarifies that users tend to adopt new technology when they believe that it will ease their work through minimal effort (Abbasi et al., 2015). Thus, technology will become more adaptable if the benefit of exhausting it exceeds the cost. Interestingly, endogenous growth theory builds on the idea that growth is elevated through investment in innovation, knowledge, and human capital. And hence, through spillovers effect and positive externalities development takes place (Lucas, 1988). However, Romer’s (1990) theory of endogenous technological change suggests that technology advances growth because profit-maximizing agents are intentionally making investment choices. Thus, the progress of the economy is dependent on choices made for investments to fuel expansion. Solow’s technological growth model found technological introduction facilitates long-term growth (Dowrick & Rogers, 2002; Parente, 1995). Additionally, the model of growth through creative destruction informs that while innovation takes place, new technology replaces the older one; and the process of creative destruction takes place. So, the new growth equilibrium depends on the size of market power to the innovator and the size of innovation (Aghion & Howitt, 1990). Accordingly, encouragement of innovation along with its magnitude is an essential component for growth.
Model Construction and Variable Selection
The association between technology penetration, income inequality, and poverty
The limited penetration of technology, including the Internet, is problematic in the context of a country’s economic and social development (Oyedemi, 2012). Research has found that limited access to technology worsens poverty as well as inequality (Letseka, 2001). Importantly, it has been found that the relationship between technological penetration and income inequality can change over time (Cheng & Zhang, 2019). Specifically, the association can be positive up to a certain point after which it might become negative.
Multiple relevant studies have found that technology penetration can be a source of economic and human development (Abramovitz, 1986; Asongu & Odhiambo, 2019; Bernard & Jones, 1996) so it can be expected to lower income inequality and poverty. Supporting studies have found that Internet penetration helps in reducing income inequality (Asongu & Odhiambo, 2019; Han et al., 2019; Qiu et al., 2021). In this context, ICTs such as mobile banking can help reach the poor and connect them to the financial sector (Mushtaq & Bruneau, 2019). Diffusion of these ICTs can decrease inequality and poverty, by increasing financial inclusion (Mushtaq & Bruneau, 2019).
Measures of Technology Penetration, Income Inequality, and Poverty
Technology penetration
In this study we have taken three variables to measure technology penetration from the Global Economy Database (GED) for every country, with respect to time. First, we have taken an Internet usage variable that is widely used to measure innovation and technology (Solomon & Klyton, 2020). It refers to Internet users per 100 individuals who have used the internet from any certain location and through any source in the given year. Second, we have taken broadband subscribers as a variable to measure technology penetration. It refers to the number of households and organization fixed subscriptions per 100 individuals at the speed greater than or equal to 256 kbit/second. According to The Global Economy (2021), fixed broadband subscriptions include home or organization subscriptions to fast Internet at downstream speeds of 256 kbit/second or above. However, it does not include the subscription paid through mobile services. Therefore, in this study we have incorporated the third variable of mobile cellular subscriptions per 100 individuals. It refers to all subscription paid for public mobile telephone services per 100 individuals.
Income inequality
Based on previous analysis and literature, income inequality is measured through a GiniNet variable. The variable data is extracted from Standardized World Income Inequality Database (SWIID), the Gini index of inequality composed of post-tax and post-transfer measures of household income. Solt (2014) has employed SWIID data to examine income inequality as it includes the multiple-imputation algorithm that helps gather and generate standardized inequality data from a diverse range of primary and secondary sources. The algorithm also generates 100 imputations separately for every individual observation. In this study, we have simply employed the average of 100 imputations for each country in every year. In comparison to many available cross-national inequality databases, SWIID provides a comprehensive data collection with respect to time and countries.
Poverty
There are multi-dimensional methodologies for measuring poverty in theoretical as well as empirical research. However, as this is a cross-national study, we have used the two most widely accepted and commonly used empirical variables to measure poverty. The two key dependent variables include the poverty headcount ratio, at $1.90 a day, and the poverty gap, at $1.90 a day. For both variables, the data is extracted from the World Development Indicators (WDI) and GED.
Empirical Model Construction
In order to examine the impact of technology penetration on poverty and income inequality, this study considers countries with respect to time as the unit of analysis. There are three key independent variables which include internet users, fixed broadband internet subscribers, and mobile phone subscribers. Internet users (
To increase the model’s robustness and explanatory power, several control variables have been included in it (Xiong et al., 2022). These control variables have been selected from the demographic, economic, and political contexts (Xiong et al., 2022). The poverty and income inequality levels are also affected by the level of gross domestic product per capita


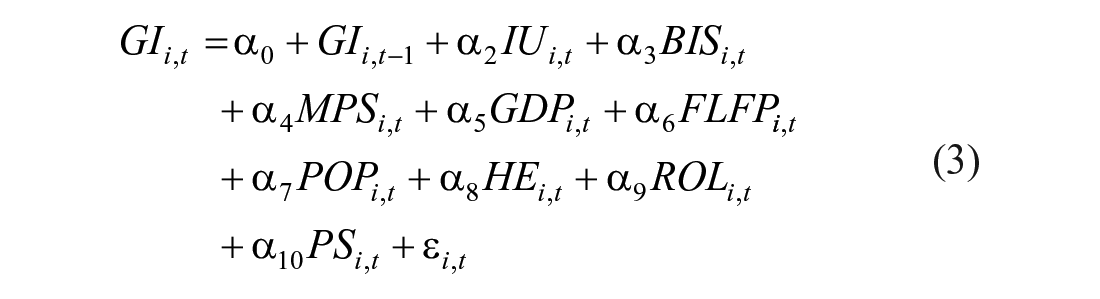
To further examine the impact of technology penetration on poverty and income inequality the paper introduces the square items of technology penetration indicators (IU2, BIS2, and MPS2), respectively, on the basic above expressed equations (1) to (3) to examine the non-linear effects as follows.


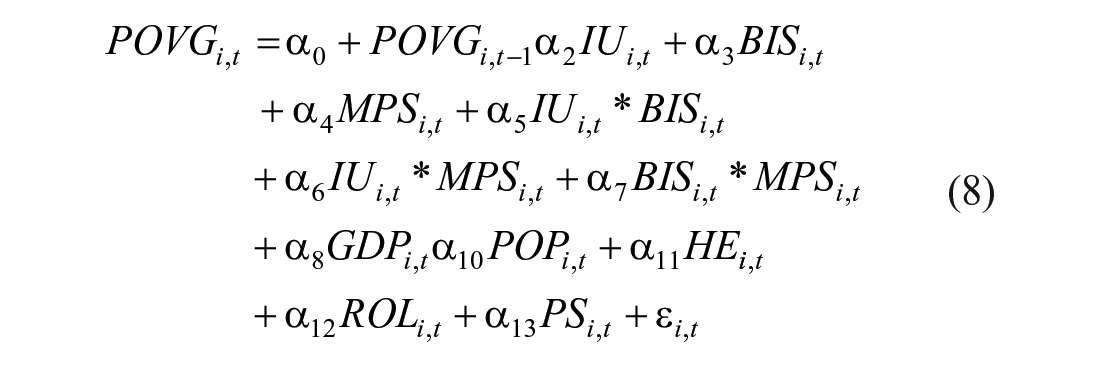
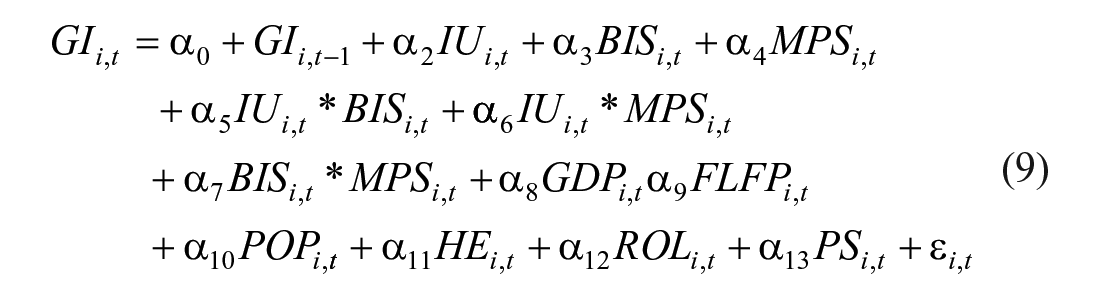
In addition to the linear and non-linear influence mechanisms, percentage of internet users, fixed broadband internet subscribers and mobile phone subscribers may affect poverty and income inequality at the same time. Therefore, this study further improves the above expressed formulas and introduces the cross terms between internet users and fixed broadband internet subscribers, internet users and mobile phone subscribers, and fixed broadband internet subscribers and mobile phone subscribers. The robust dynamic panel data model for the synergy effect is shown below.

Variable Selection and Descriptive Statistics
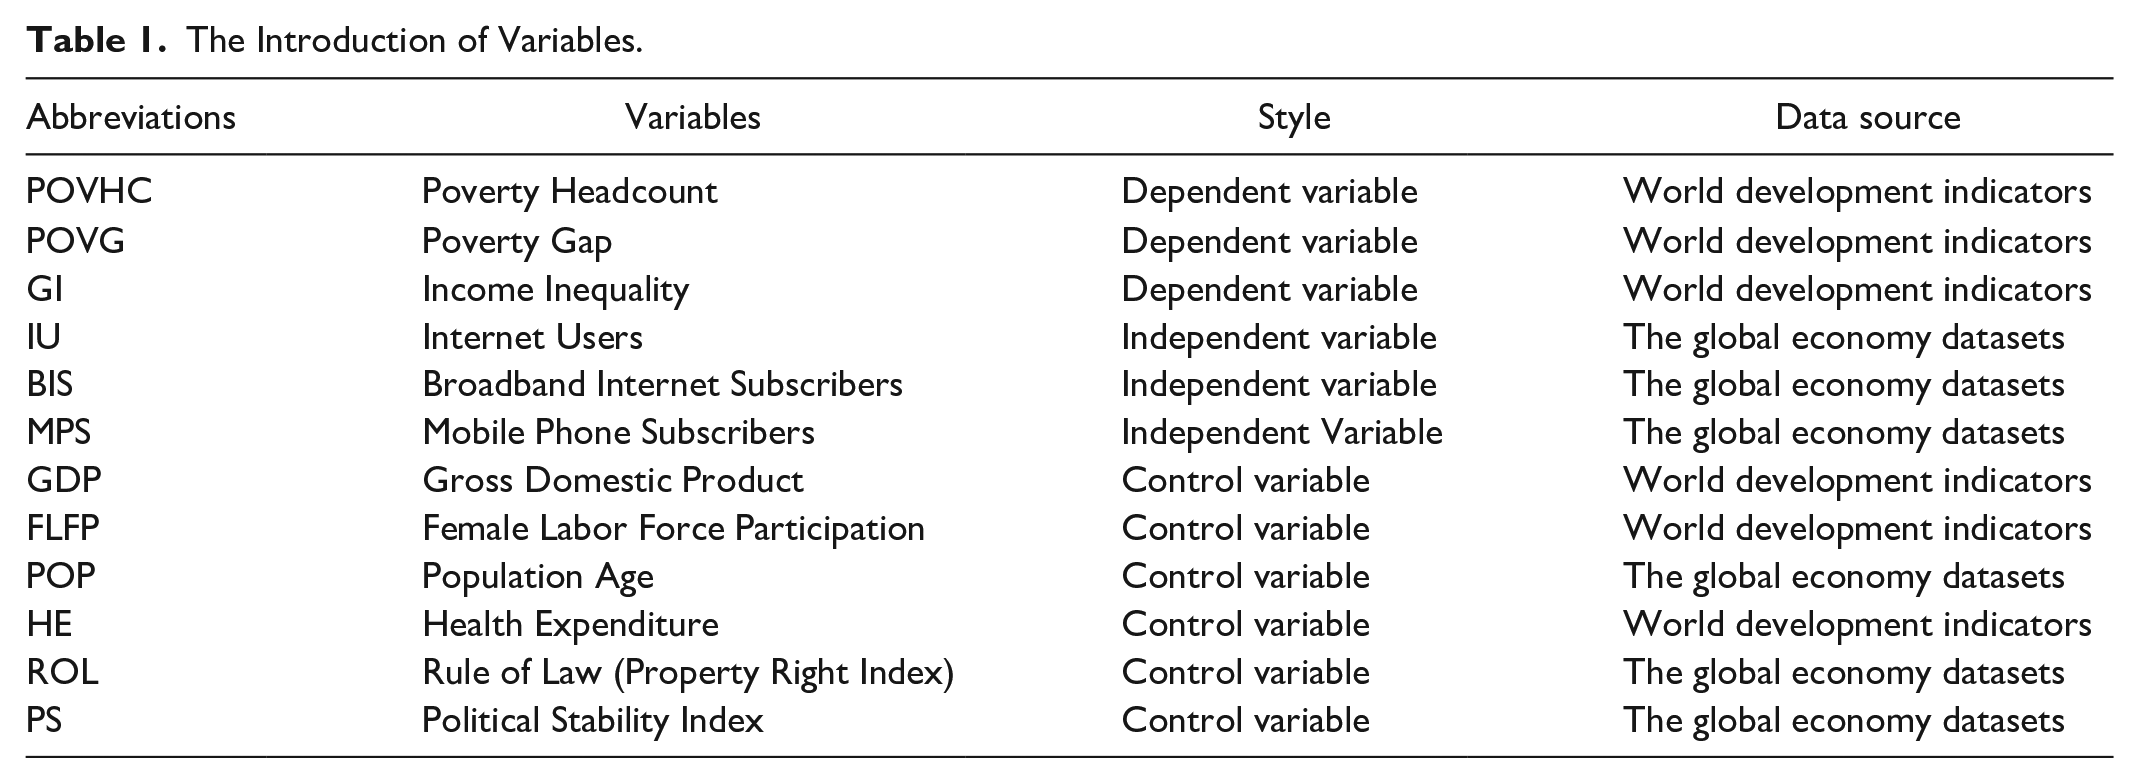
This paper selects samples from 2005 to 2020 and the data include the poverty headcount ratio, poverty gap, Gini index, percent of internet users, percent of fixed broadband subscribers, percent of mobile phone subscribers, gross domestic product per capita, female labor force participation rate, population levels, public health expenditure, rule of law, and political stability in 86 countries across the globe. For the purpose of analysis, there is classification of countries with respect to income groups but our focus is on the global-level impact of technology on poverty and income inequality. The data list of countries is attached in Appendix. All the names of variables, the data sources, and their abbreviations used in the robust dynamic panel modeling are shown in the following Table 1. The descriptive statistics of all variables are shown in Table 2.
The Introduction of Variables.
Descriptive Statistics for High Income Countries, Upper-Middle Income, Upper-Low- and Low-Income Countries, and All Countries.

Source. Authors’ own calculations.
The scatter plots in Figure 1 explain the relationships amongst technology penetration, poverty, and income inequality. Specifically, scatter plots with internet users and poverty headcount ratio, fixed broadband subscribers and poverty headcount ratio, mobile phone subscribers and poverty headcount ratio, internet users and poverty gap, fixed broadband internet subscribers and poverty gap, mobile phone subscribers and poverty gap show that there is a significant negative relationship between technology penetration and poverty levels. This shows that adoption of technology can lower poverty levels. Additionally, in the scatter plots between internet users and income inequality, fixed broadband subscribers and income inequality, and mobile phone subscribers and income inequality, it can be seen there is a significant positive relationship between technology penetration and income inequality. This explains why developed economies which have climbed the technology ladder experience more equal income distribution, compared with economies that are less developed.

Scatter plots of technology penetration versus poverty and income inequality.
Empirical Findings
We have conducted panel regression analysis at the cross-national level by taking the high-, upper-middle-, lower upper-, and lower-income countries. The impact of technology penetration on poverty and income inequality are verified separately by linear effect, non-linear effect, and synergy effect based on the dynamic panel data model constructed in section 3 and equations (1) to (9) for regression analysis of the influence mechanism. To avoid endogeneity issues in the static regression analysis, we have selected two-step robust Sys-GMM to conduct regression analysis for the linear effect, non-linear effect, and synergy effect models. This analytical technique is based on Arellano and Bond (1991), further extended by Roodman (2009). Empirical findings of the global sample, high-income countries, upper-middle income countries, lower-upper income countries, and lower-income countries are shown in Tables 3 to 6.
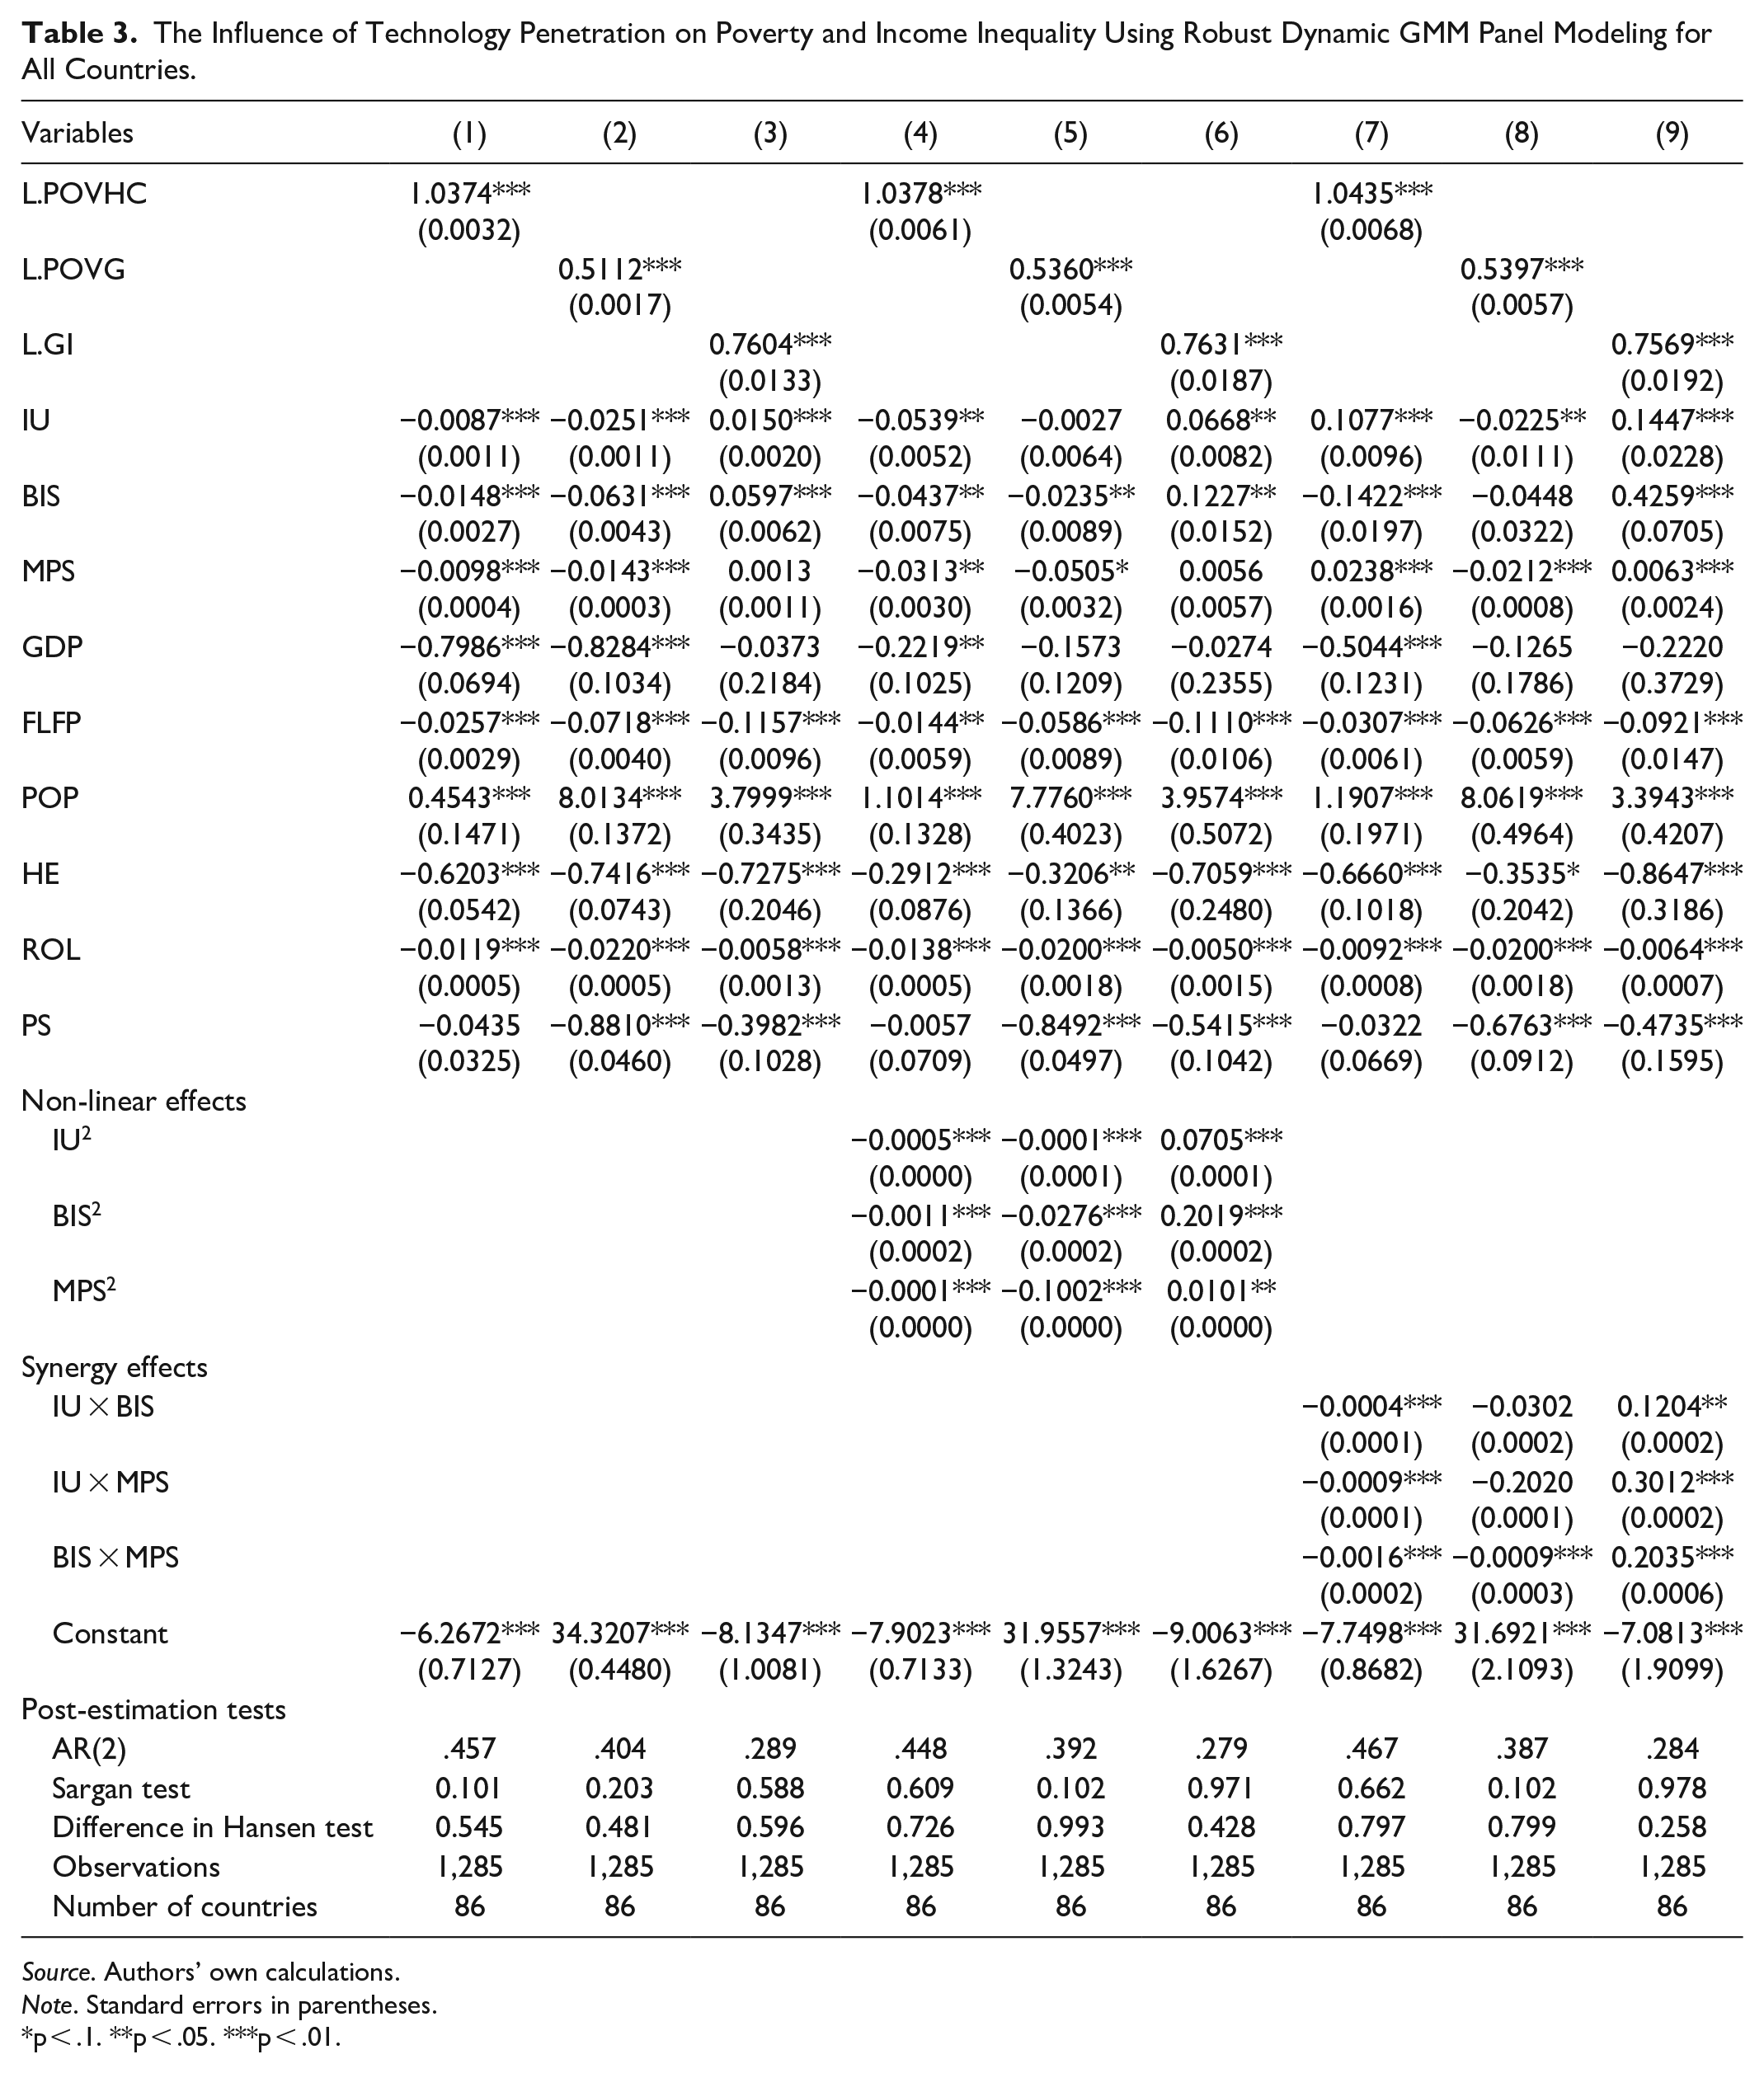
The Influence of Technology Penetration on Poverty and Income Inequality Using Robust Dynamic GMM Panel Modeling for All Countries.
Source. Authors’ own calculations.
Note. Standard errors in parentheses.
p < .1. **p < .05. ***p < .01.
The Influence of Technology Penetration on Poverty and Income Inequality Using Robust Dynamic GMM Panel Modeling for High Income Countries.

Source. Authors’ own calculations.
Note. Standard errors in parentheses.
p < .1. **p < .05. ***p < .01.
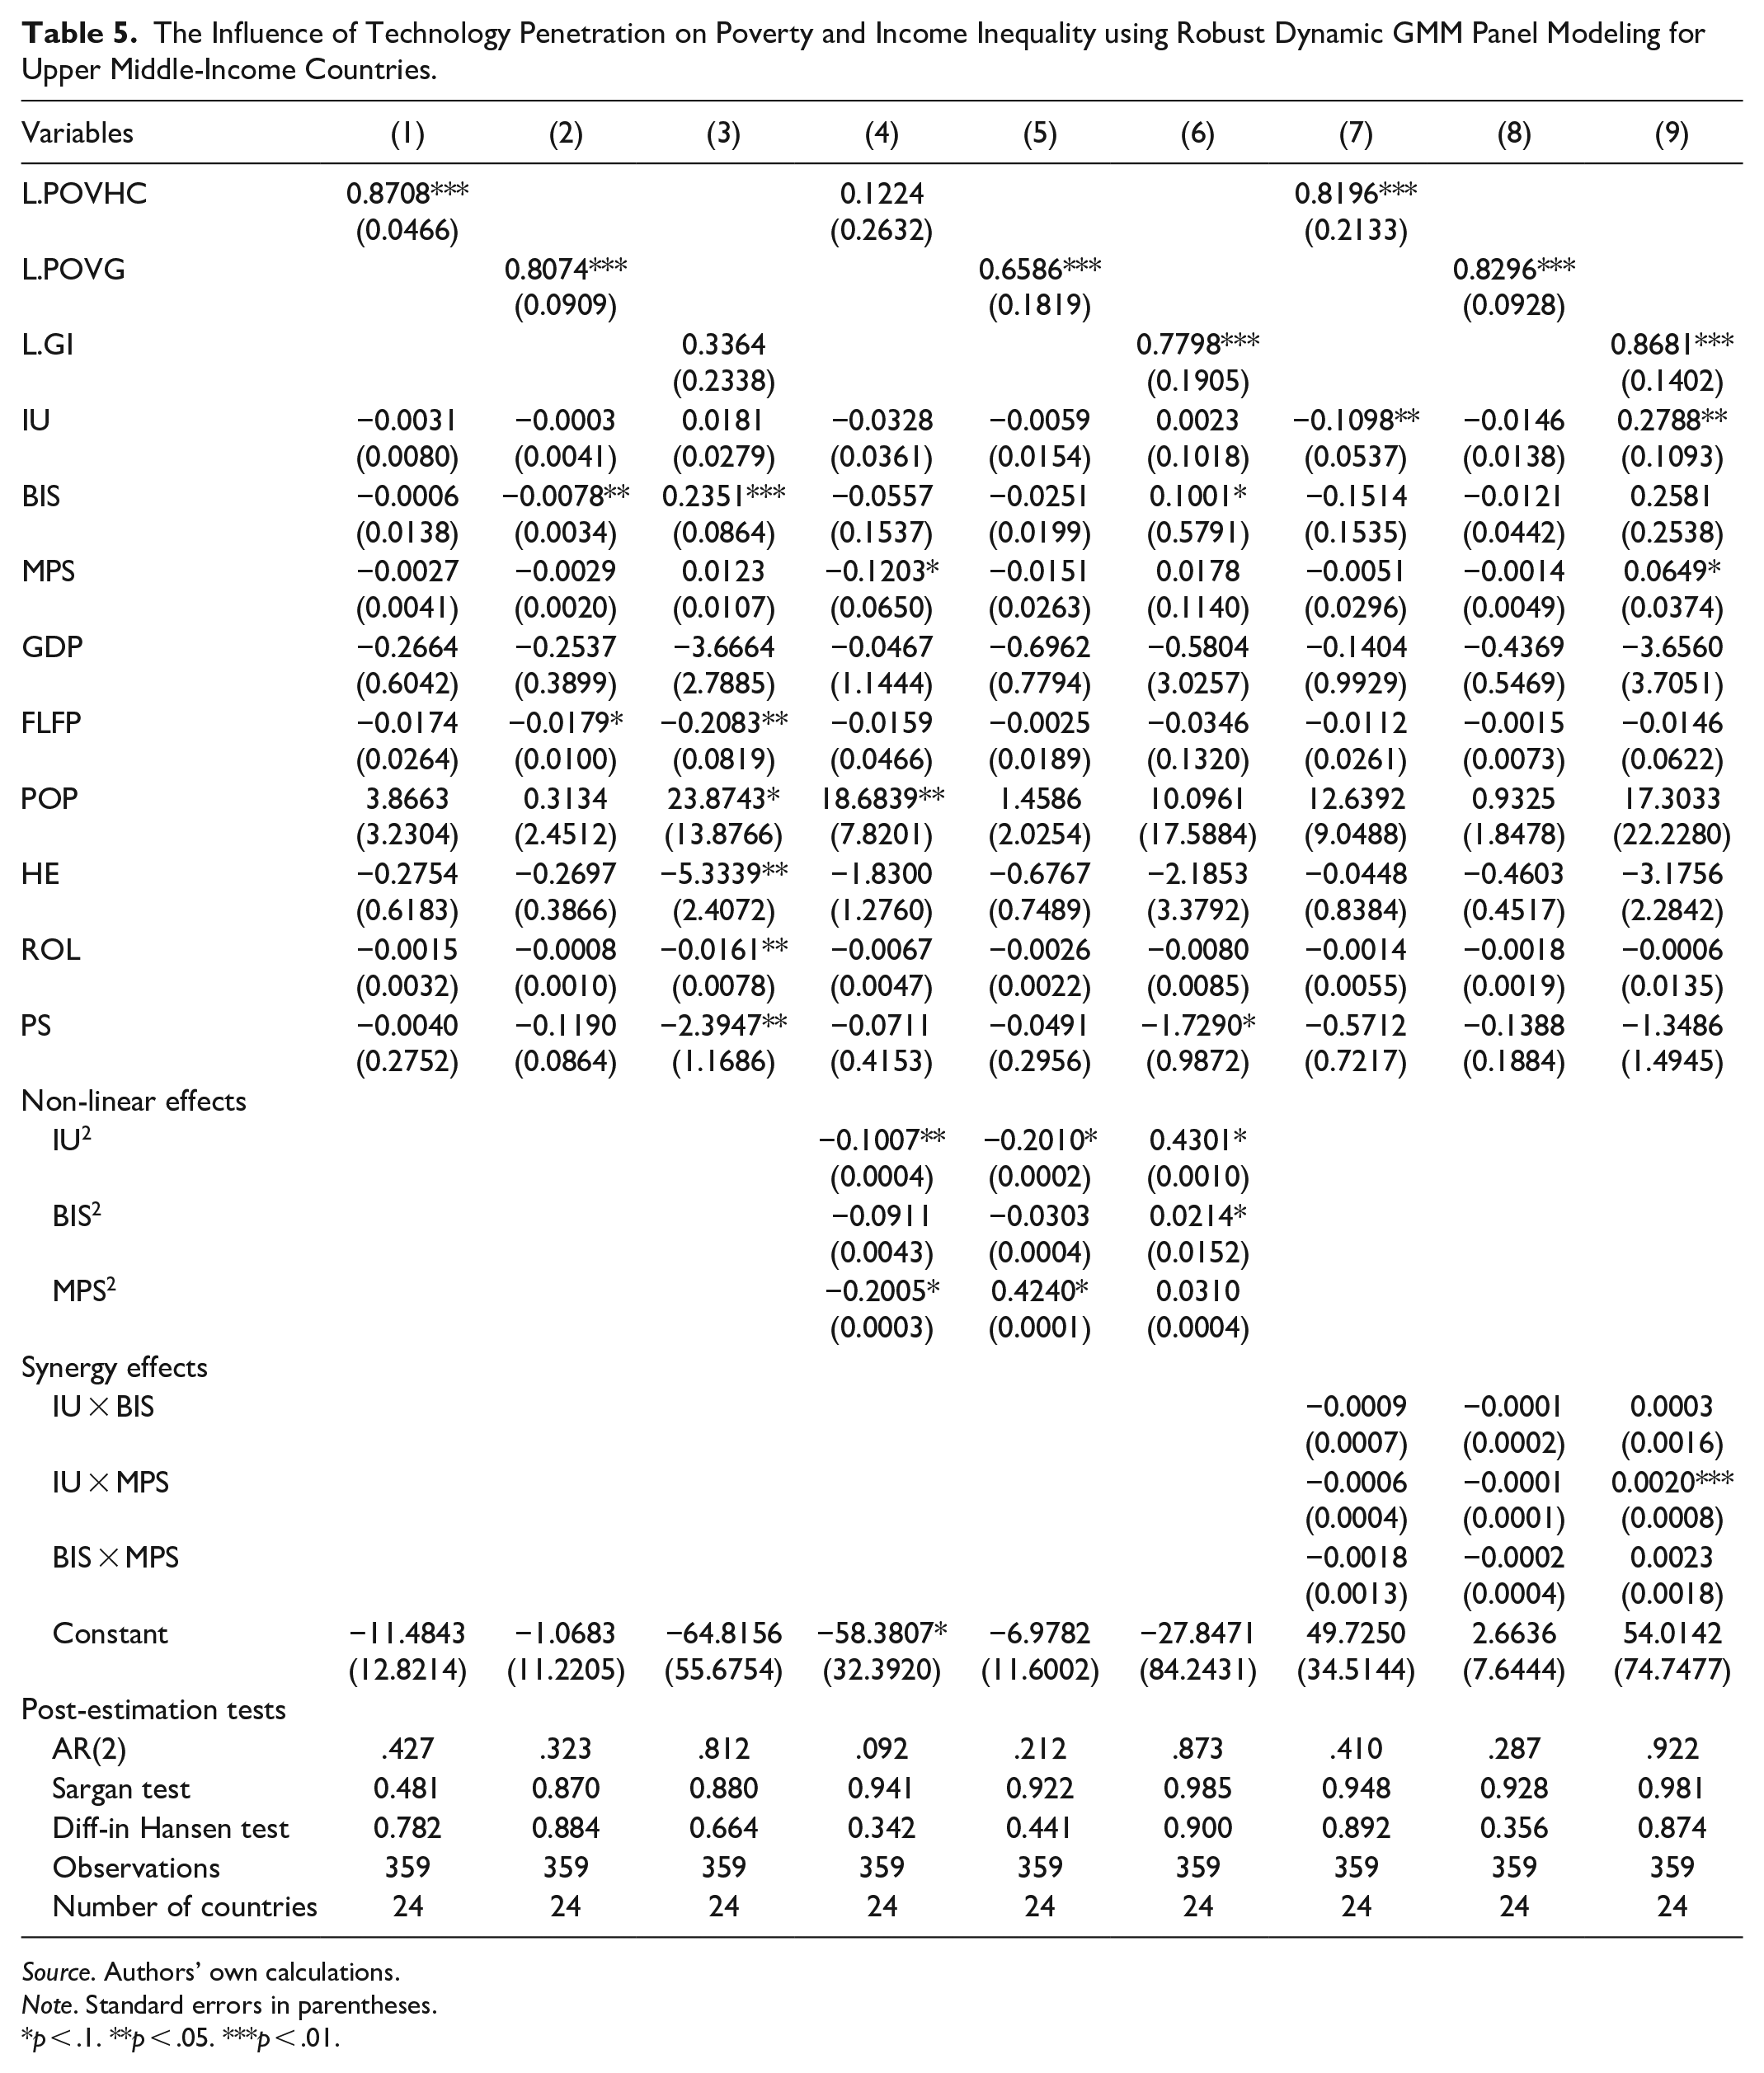
The Influence of Technology Penetration on Poverty and Income Inequality using Robust Dynamic GMM Panel Modeling for Upper Middle-Income Countries.
Source. Authors’ own calculations.
Note. Standard errors in parentheses.
p < .1. **p < .05. ***p < .01.
The Influence of Technology Penetration on Poverty and Income Inequality Using Robust Dynamic GMM Panel Modeling for Low-Upper Income Countries.

Source. Authors’ own calculations.
Note. Standard errors in parentheses.
p < .1. **p < .05. ***p < .01.
There are four main reasons for adopting this methodological approach. First, the number of cross sections (N = 86 for all countries, N = 38 for high income countries, N = 24 for upper-middle income countries, and N = 24 for lower-upper and low-income countries) is greater than the number of time series (T = 16), it satisfies the GMM’s reference point criterion (Bakhsh et al., 2021). Second, the dependent variable is persistent since the correlation coefficient between
Moreover, the robust two-step method was chosen instead of the other available methodologies to account for heteroscedasticity and homoscedasticity simultaneously. The one-step technique considers homoscedasticity only. According to recent literature, it is assumed all explanatory variables are predetermined and only time invariant variables (years) are expected to be purely exogenous (Asongu & Nwachukwu, 2016). In addition, the traditional instrumental variable test rejects the null hypothesis for the Sargan Over-Identification Restriction’s test that refers instruments do not exclusively explain the dependent variable through the presumed endogenous variables (Beck et al., 2003).
In Tables 3 to 6, Models 1 to 3 were constructed according to the equations (1) to (3) to determine the linear effect of technology penetration on poverty and income inequality using the global sample and further classifying analysis under high-income, upper-middle income, lower-upper-income, and lower-income countries. The results of Model 1 in Table 3 show that there is a negative impact of technology penetration measured using the percent of Internet users (b = −0.0087***, SE = 0.0011), fixed broadband Internet subscribers (b = −0.0148***, SE = 0.0027), and mobile phone subscribers (b = −0.0098***, SE = 0.0004) on poverty measured using the headcount ratio at a significance level of 1% (p < .01) using the global countries’ dataset . The results of Model 1 in Table 4 show that there is a negative impact of technology penetration measured using the percent of Internet users (b = −0.0027***, SE = 0.0010) at the significance level of 1% (p < .01), fixed broadband Internet subscribers (b = −0.0007, SE = 0.0019) but insignificant and mobile phone subscribers (b = −0.0010*, SE = 0.0005) at a significant level of 10% (p < .10) on poverty measured using the headcount ratio in high income countries . The results of Model 1 in Table 5 show that there is a negative impact of technology penetration measured using the percent of Internet users (b = −0.0031, SE = 0.0080), fixed broadband Internet subscribers (b = −0.0006, SE = 0.0138), and mobile phone subscribers (b = −0.0027, SE = 0.0041) on poverty measured using the headcount ratio in upper-middle income countries but all results were insignificant . The results of Model 1 in Table 6 show that there is a negative impact of technology penetration measured using the percent of Internet users (b = −0.0419*, SE = 0.0245) at the significance level of 10% (p < .1), fixed broadband Internet subscribers (b = −0.1293**, SE = 0.0528) at significance of 5% (p < .05), and mobile phone subscribers (b = −0.0338***, SE = 0.0117) at significance of 1% (p < .01) on poverty measured using the headcount ratio in lower-upper and low income countries. In Tables 3 to 6, Model 1 were aligned with the technology acceptance model and endogenous growth theory explaining the phenomena of technology adoption and reduction in poverty levels through better allocation of resources and generation of economic opportunities.
The results of Model 2 in Table 3 show that there is a negative impact of technology penetration measured using the percent of nternet users (b = −0.0251***, SE = 0.0011), fixed broadband Internet subscribers (b = −0.0631***, SE = 0.0043), and mobile phone subscribers (b = −0.0143***, SE = 0.0003) on poverty measured using the poverty gap at a significance level of 1% (p < .01) using the global countries’ dataset . The results of Model 1 in Table 4 show that there is a negative impact of technology penetration measured using the percent of Internet users (b = −0.0002, SE = 0.0015), fixed broadband Internet subscribers (b = −0.0013, SE = 0.0025), and mobile phone subscribers (b = −0.0002, SE = 0.0003) on poverty measured using the poverty gap in high income countries but all results were insignificant. The results of Model 1 in Table 5 show that there is a negative impact of technology penetration measured using the percent of Internet users (b = −0.0003, SE = 0.0041) but insignificant, fixed broadband internet subscribers (b = −0.0078**, SE = 0.0034) at a significance level of 5% (p < .05), and mobile phone subscribers (b = −0.0029, SE = 0.0020) but insignificant on poverty measured using the poverty gap in upper-middle income countries. The results of Model 1 in Table 6 show that there is a negative impact of technology penetration measured using the percent of Internet users (b = −0.0653**, SE = 0.0292) at significance of 5% (p < .05), fixed broadband Internet subscribers (b = −0.0965, SE = 0.1325) but insignificant, and mobile phone subscribers (b = −0.0112, SE = 0.0088) but insignificant on poverty measured using the poverty gap in lower-upper and low income countries. In Tables 3 to 6, Model 2 were aligned with the technology acceptance model and endogenous growth theory explaining the negative influence of technology penetration on poverty gap.
The result of Model 3 in Table 3 shows that there is a positive impact of technology penetration measured using the percent of Internet users (b = 0.0150***, SE = 0.0020) at significance of 1% (p < .01), fixed broadband Internet subscribers (b = 0.0597***, SE = 0.0062) at significance of 1% (p < .01), and mobile phone subscribers (b = 0.0013, SE = 0.0011) remained insignificant on income inequality measured using Gini index using the global countries’ dataset . The results of Model 1 in Table 4 show that there is a positive impact of technology penetration measured using the percent of Internet users (b = 0.0043, SE = 0.0051), fixed broadband Internet subscribers (b = 0.0032, SE = 0.0088), and mobile phone subscribers (b = 0.0021, SE = 0.0023) on income inequality measured using Gini index in high income countries but all results were insignificant . The results of Model 1 in Table 5 show that there is a positive impact of technology penetration measured using the percent of Internet users (b = 0.0181, SE = 0.0279) but insignificant, fixed broadband Internet subscribers (b = 0.2351***, SE = 0.0864) at a significance level of 1% (p < .01), and mobile phone subscribers (b = 0.0123, SE = 0.0107) but insignificant on income inequality measured using Gini index in upper-middle income countries. The results of Model 1 in Table 6 show that there is a positive impact of technology penetration measured using the percent of Internet users (b = 0.0621*, SE = 0.0324) at a significance level of 10% (p < .01), fixed broadband Internet subscribers (b = 0.5164**, SE=0.2321) at a significance level of 5% (p < .05), and mobile phone subscribers (b = 0.0106, SE = 0.0081) but insignificant on income inequality measured using Gini Index in lower-upper and low income countries. In Tables 3 to 6, Model 2 were aligned with the technology acceptance model and endogenous growth theory explaining the positive influence of technology penetration on income inequality.
Models 4 to 6 introduces the square item of Internet users, fixed broadband subscribers, and mobile phone subscribers based on equations (4) to (6) to examine the non-linear influence of technology penetration on poverty and income inequality. As seen in Table 3 to 6, Model 4, after adding the square item of Internet users, fixed broadband subscribers, and mobile phone subscribers, has a significantly higher negative impact on the poverty level measured using the poverty headcount ratio so the effect is U-shaped. Similarly in Tables 3 to 6, Model 5, after adding the square item of Internet users, fixed broadband subscribers, and mobile phone subscribers, has a significantly higher negative impact on the poverty level measured using the poverty gap so the effect is U-shaped. In Tables 3 to 6, Model 5, after adding the square item of Internet users, fixed broadband subscribers, and mobile phone subscribers, has a significantly higher positive impact on income inequality measured using Gini Index so this effect is also U-shaped.
This shows that when the percent of Internet users is above 49.87 the effect of Internet users on the poverty level will continue to decrease while for income inequality it will continue to increase. Using the data in Table 2 as well, it can be observed that the percent of Internet users of high-income countries is 73.074, upper-middle income countries 44.799, and lower-upper and low-income countries 18.157. This shows the percentage of internet users has a strong effect in the context of poverty reduction. When fixed broadband Internet subscribers are more than 15.173 the effect of fixed broadband Internet subscribers on the poverty level will continue to decrease while for income inequality it will continue to increase. Combined with the data in Table 2, this shows that the percent of fixed broadband Internet subscribers of high-income countries is 26.917, upper-middle income countries 9.495, and lower-upper and low-income countries 2.14. This shows that the percentage of fixed broadband Internet subscribers has a strong effect in reducing poverty. In addition, when mobile phone subscribers are greater than 101.15 the effect of mobile phone subscribers on the poverty level will continue to decrease while for income inequality it will continue to increase. Combined with the data in Table 2, it shows that mobile phone subscribers of high-income countries are 118.115, upper-middle income countries 107.173, and lower-upper and low-income countries 72.08. This shows that the percentage of mobile phone subscribers has a strong effect in the context of poverty reduction.
The models 7 to 9 is based on the equations (7) to (9) to examine the synergy effects of technology penetration on poverty and income inequality at global level and comparative analysis among high-income countries, upper-middle income countries, lower-upper income countries, and lower-income countries. This study has introduced interaction terms by multiplying Internet users with fixed broadband Internet subscribers, Internet users multiplied by mobile phone subscribers, and fixed broadband Internet subscribers multiplied by mobile phone subscribers.
Conclusion and Policy Recommendations
This article discusses technological penetration and its impacts on poverty and income inequality, with respect to income levels. Results indicate that the impact of technology use is not consistent across countries and combining countries to form one group to derive results may lead to inappropriate policies. In low-income countries in particular, an increase in Internet users is likely to be beneficial for lowering poverty levels while access to broadband Internet can have a positive effect on reducing income inequality. Therefore, low-income countries are likely to benefit from policies that promote access to Internet services for the masses. The effects of improving access to mobile services and Internet facilities are not linked to easy communication only but also have implications for telehealth services, online education, and remote jobs. An important factor that can strengthen such initiatives is the popularity of smartphones, instead of the traditional mobile phones, even in low-income countries. This means that through provision of Internet services, the common man can be equipped to sustain himself through revenue-generating activities online.
One interesting finding, consistent across all income groups, is the positive relationship between technology (mobile phone and Internet usage) and income inequality. One possible explanation is that technological advances are accompanied by with the demand for more technical skills and can make many menial jobs redundant, which can contribute to income disparity.
This paper also highlights areas for future research. Specifically, it shows the need to investigate avenues through which technology advances can worsen income inequality. Such research will be highly valuable for policy makers as well. This study has certain limitations which should be viewed as opportunities for future studies. First, the model could have included other relevant variables such as quality of governance and socioeconomic factors (Arvin et al., 2021). The model could have included more control variables, which the current model does not include due to limited data availability. These include social spending, unemployment, and education level. In addition, the model could have included commonly used variables that control the same elements of income distribution or poverty with a more direct impact. These include the ratio of old to working-age population members and corruption. Future researchers should include these variables to obtain useful insights. Second, our sample includes only 86 countries which means that the findings may not be applicable to other contexts. A larger sample is recommended for future research. We have taken global data and have divided it into different income groups for analysis. But our focus is on the global impact of technology on poverty and inequality. So future studies can include different control variables for different income groups.
Footnotes
Appendix
Lower-upper and low-income countries.

| Burkina Faso | Burundi | Liberia | Madagascar |
| Niger | Rwanda | Tajikistan | Togo |
| Uganda | Bangladesh | Bolivia | Egypt |
| El Salvador | Ghana | Honduras | India |
| Kyrgyzstan | Moldova | Mongolia | Nicaragua |
| Pakistan | Philippines | Ukraine | Vietnam |
Author Contributions
Dr. Ayesha Afzal: Conceptualization; Dr. Saba Fazal Firdousi: Writing-Original draft preparation, Methodology, Software, Formal Analysis; Ayma Waqar and Minahil Awais: Data Collection, Writing-Reviewing and Editing.
Availability of Data
Availability of data and material will be provided whenever journal needs it.
Declaration of Conflicting Interests
The author(s) declared no potential conflicts of interest with respect to the research, authorship, and/or publication of this article.
Funding
The author(s) received no financial support for the research, authorship, and/or publication of this article.