
Abstract
Since 1978, China has greatly reduced the rural poverty rate. This article provides an overview of the experience of China’s poverty reduction. Using panel data from 1996 to 2013 to calculate farmers’ income dynamics, we found that the pace of poverty reduction was relatively slow from 1996 to 2002 and that the rate of reversion to poverty was high. Since 2003, the pace of poverty reduction has accelerated, whereas the rate of reversion has decreased. Using econometric ordinary least squares and probit models, we explore the factors that drive poverty reduction. We found correlational evidence that the main reasons for poverty reduction in China since 1996 have been the increase in income from household farms and migrant work. In addition, rural public insurance prevented farmers from falling into poverty.
Keywords
Introduction
Since the inception of reform and the Open Door Policy in 1978, China has transformed itself into a middle-income country with a largely market economy. Among its greatest achievement is the elimination of poverty for hundreds of millions of people. The developing world outside China, however, has seen little or no sustained progress in reducing poverty (Chen & Ravallion, 2007). Figure 1 shows that, based on the current standard for rural poverty (an annual net income of 2,300 RMB per person at the 2010 price level), the number of rural poor in China decreased from 765.42 million in 1980 to 462.24 million in 2000, and the poverty rate (poor rural population/total rural population) decreased from 97.5% to 49.8%. Since 2000, poverty reduction has accelerated. The number of rural poor in China decreased from 462.24 million in 2000 to 55.75 million in 2015, and the poverty rate dropped from 49.8% to 5.7% (National Bureau of Statistics [NBS] of the People’s Republic of China, 2016).

Trends for poverty in rural China.
In 2015, the United Nations listed “eradicating extreme poverty (living on less than $1.25 per person per day) around the world by 2030” as one of its sustainable development goals in its 2030 agenda for sustainable development. To build an all-around well-off society, China has presented measures to ensure that, by 2020, rural residents who are living in poverty under China’s current standard and all poverty-stricken counties should be lifted out of poverty. Overall regional poverty should be solved (General Office of the Central Committee of the Communist Party of China [CCCPC], 2015).
An understanding of China’s experience of poverty reduction will contribute to the fight against poverty in the next several years and provide a reference for other countries, particularly those in South Asia and sub-Saharan Africa, which had 85% (629 million) of the world’s poor in 2015 (Katayama & Wadhwa, 2019).
Related studies on poverty reduction in China focus mainly on economic growth, income inequality, education, health, village-level characteristics, and poverty alleviation plans. Rural poverty reduction in the first half of the 1990s was attributed mainly to rising income and falling inequality (Wan & Zhang, 2006). In the second half of the 1990s, widening income inequality restricted the potential welfare from poverty reduction and economic growth (B. Lin, 2003). M. Cheng et al.’s (2014) empirical analysis found that, from the perspective of a narrowing income gap, health played a more significant role in rural poverty reduction than did education from 2003 to 2010; and Yang et al. (2003) found that the effect of village-level characteristics on farmers’ income is weakening. In terms of policy, from 1994 to 2000, China’s 7-year poverty alleviation plan increased the rural income of poor counties by approximately 38% (Meng, 2013); and, in 2013, public transfer payments reduced the poverty rate by 4.26% (Li et al., 2016).
Research also has systematically reviewed the experience of poverty reduction, for example, Hu et al. (2006) and S. Wang (2008). Similar to these studies, this article provides a summary of the characteristics and main factors that drive poverty reduction in rural China from 1996 to 2013. This article contributes to the literature in the following ways. First, in addition to measuring the poverty reduction rate, this study measures the rate of reversion to poverty. Second, using detailed and representative microdata, this study analyzes not only the effect of propoor growth in household operating income and migrant working income on poverty reduction but also the effect of propoor public insurance on poverty reduction. Third, this study analyzes the challenges for future poverty reduction. The aging Chinese population, decreasing nonfarm employment, and increasing the burden of government finance will have profound impacts on poverty reduction.
The remainder of this article is organized as follows: Section “Data and Poverty Rate Trends” provides the data and trends in the poverty rate. Section “Factors That Drive Poverty Reduction” presents the main forces that drive poverty reduction. Section “Challenges of Poverty Reduction” contains the challenges for future poverty reduction. Section “Discussion and Conclusion” concludes and provides suggestions for policymakers.
Data and Poverty Rate Trends
Data and Variables
The data in this article are from the National Rural Fixed-Point Survey (NFS) conducted in rural areas throughout China. The survey system was approved by the Secretariat of the CCCPC in 1984, was formally established in 1986, and is ongoing until now. The survey aims to obtain grassroots information, and the statistical system was formally approved by the NBS of the People’s Republic of China in 1990.
At present, there are approximately 360 administrative villages surveyed, with samples distributed in 31 provinces (districts and cities) in China (Hong Kong, Macao, and Taiwan are not included). In each province, counties in the upper, middle, and lower income tiers were classified, from which a village was then randomly chosen (Dwayne et al., 2005). The questionnaire concerns factors such as income, consumption, land, and production.
To meet the requirement of fixed samples in income mobility measurement, we retained only the balanced panel data. The samples were then divided into three periods. In 2003, the NFS questionnaire in China was adjusted to be more precise. For example, the index of “age of householder” was changed from age group to actual age (years old), and the health situation of household members also was surveyed. Thus, the years 1996 to 2002 are classified as one period. The following two periods are divided mainly by the international financial crisis in 2008. Due to data availability, the sample is from 1996 to 2013. All income variables are converted into real 2010 RMB, using the rural consumer price index from the NBS of the People’s Republic of China. Summary statistics for the main variables are presented in Table 1.
Summary Statistics.
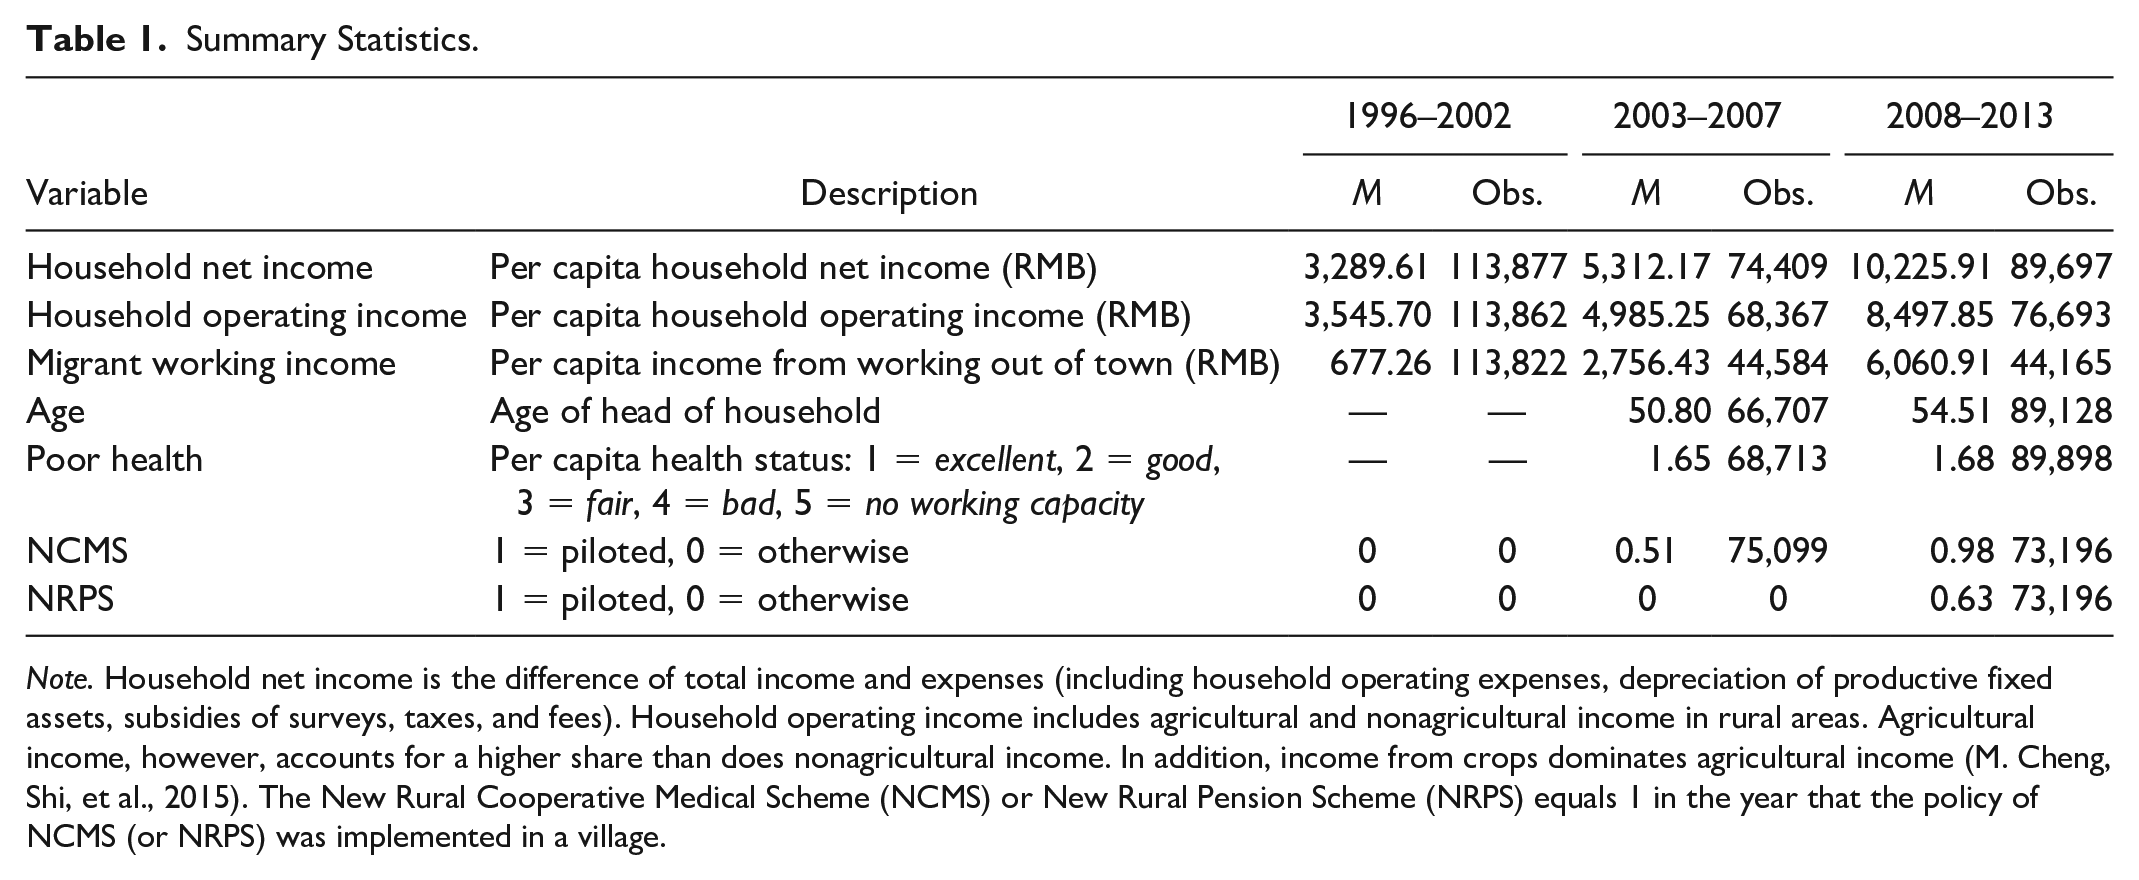
Note. Household net income is the difference of total income and expenses (including household operating expenses, depreciation of productive fixed assets, subsidies of surveys, taxes, and fees). Household operating income includes agricultural and nonagricultural income in rural areas. Agricultural income, however, accounts for a higher share than does nonagricultural income. In addition, income from crops dominates agricultural income (M. Cheng, Shi, et al., 2015). The New Rural Cooperative Medical Scheme (NCMS) or New Rural Pension Scheme (NRPS) equals 1 in the year that the policy of NCMS (or NRPS) was implemented in a village.
Trends for Poverty Rate
To further understand poverty alleviation and reversion to poverty trends, we measure income mobility. First, we divide the sample into five groups according to the annual per capita household net income. The data are grouped according to the current national poverty standard of 2,300 RMB net income per person per year in 2010 at unchanged prices. The dividing line for the five groups is 1 to 5 times the national poverty line, which is 2,300, 4,600, 6,900, 9,200, and 11,500 RMB. Second, we calculate the percentage of households that enter group
Poverty reduction rate
The poverty reduction rate is equal to the number of households in the first group that move up to the other groups, divided by the total number of households in the first group.
Rate of reversion to poverty
The rate of reversion is equal to the number of households in the second group that move down to the first group, divided by the total number of households in the second group.
Average mobility
To compare the overall mobility level in different periods, we calculate the average mobility and inertia rate. The average mobility applies a certain weight (e.g., 1/5) according to the number of groups to calculate the overall degree of mobility. The equation is as follows:

Inertia rate
The inertia rate reflects the average proportion of individuals maintained in the original income group. It is the arithmetic average of the elements on the diagonal of the income mobility matrix. The larger the value, the more limited the mobility. The equation is as follows:

Table 2 shows that average mobility increased over time, from 1.27 in the first period to 2.30 in the third period. Meanwhile, the inertia rate showed a downward trend, from 39.79% in the first period to 28.94% in the third period. These results show that the degree of stratification is lower after 2003.
Average Mobility and Inertia Rate.

Table 3 shows that, from 1996 to 2002, 57.89% of the poor remained in Group 1, which is poverty-stricken. Of the poor, 34.41% rose to Group 2, which is above the poverty line. The rates of reversion to poverty of all groups, however, were high. For example, 26.83% in Group 2 reverted to poverty, and 13.26% in Group 3 reverted to poverty.
Income Mobility Matrix (1996 and 2002, 2003 and 2007).

Note. The values represent the percentage of households that entered group
Since 2003, the poverty reduction rate has increased, and the rate of reversion to poverty of each group has decreased. From 2003 to 2007, 27.70% of the poor remained poor. This was, however, much lower than the period from 1996 to 2002. Furthermore, 45.38% of the poor rose to Group 2, which was higher than for the period of 1996 to 2002. Moreover, the rates of reversion to poverty of all groups were lower, within 10% (Table 3).
From 2008 to 2013, 21.06% of the poor remained poor. In addition, 29.28% of the poor rose to Group 2, and more poor households rose to Groups 3, 4, and 5 compared with the first two periods. Furthermore, the rates of reversion to poverty in all groups lowered and remained within 7% (Table 4).
Income Mobility Matrix (2008 and 2013).

Note. The values represent the percentage of households that entered group
Poverty reduction trends varied by region. First, economic growth varied by region. The economic development of the eastern region is relatively developed, whereas that of other regions is relatively slow. 1 Second, the Chinese central government has different policy preferences for different regions.
From 1996 to 2002, the poverty reduction rate was lowest in the west and highest in the east (Table 5), due mainly to the advantages of exports. From 2003 to 2007, the west was still the lowest. The northeast, however, surged and showed the highest poverty reduction rate. This may be because, in 2003, China’s central government initiated “Revitalization of the Northeast,” a strategy that focuses on traditional industrial enterprises’ technical innovation and agriculture modernization.
Poverty Reduction Rate in Different Regions.

Note. The poverty reduction rate (%) is equal to the number of households in the first group that move up to the other groups, divided by the total number of households in the first group. The east region includes Beijing, Tianjin, Hebei, Shanghai, Jiangsu, Zhejiang, Fujian, Shandong, Guangdong, and Hainan. The central region includes Shanxi, Anhui, Jiangxi, Henan, Hubei, and Hunan. The west region includes Inner Mongolia, Guangxi, Chongqing, Sichuan, Guizhou, Yunnan, Xizang, Shaanxi, Gansu, Qinghai, Ningxia, and Xinjiang. The northeast region includes Heilongjiang, Jilin, and Liaoning.
From 2008 to 2013, the poverty reduction rate in the northeast remained the highest. The west, however, moved up from last place to second, and this movement is associated with the central government’s support for the west. In 2009, the Chinese central government took measures to cope with the international financial crisis and to maintain steady economic development in the west. The measures included investing in rural infrastructure, supporting farmers in starting businesses, and promoting farmers’ employment. Notably, the central region, without many measures by the Chinese central government, was in last place.
In the first period, the rate of reversion to poverty is lowest in the east and highest in the west (Table 6). In the third period, in contrast, the rate of reversion to poverty is highest in the east and lowest in the west. This may be because the international financial crisis of 2008 had a significant impact on exports in the east when regional export growth slowed. Meanwhile, industrial upgrading in the east caused the manufacturing industry to gradually transfer from the east to the central and western regions. This may have increased unemployment in the east.
The Rate of Reversion to Poverty in Different Regions.

Note. The rate of reversion to poverty (%) is equal to the number of households in the second group that move down to the first group divided by the total number of households in the second group. The east region includes Beijing, Tianjin, Hebei, Shanghai, Jiangsu, Zhejiang, Fujian, Shandong, Guangdong, and Hainan. The central region includes Shanxi, Anhui, Jiangxi, Henan, Hubei, and Hunan. The west region includes Inner Mongolia, Guangxi, Chongqing, Sichuan, Guizhou, Yunnan, Xizang, Shaanxi, Gansu, Qinghai, Ningxia, and Xinjiang. The northeast region includes Heilongjiang, Jilin, and Liaoning.
Factors That Drive Poverty Reduction
From 1982 to 1986, the Chinese central government issued the “first central document” on agriculture, rural areas, and farmers. After a break of nearly 20 years, the Chinese central government resumed this tradition in 2004. Since 2004, each “first central document” has focused on agriculture, rural areas, and farmers. The Chinese central government issued a series of policies to benefit and support agriculture, rural areas, and farmers.
Many factors contribute to poverty reduction in rural China, making it difficult to analyze all of these factors in one article. To get a big picture of the experience of poverty reduction, we focus on the policies related to the household operating income, migrant working income, and rural public insurance.
Household Operating Income
To investigate the difference of households out of poverty (or reverted to poverty) between years, we estimate the following equation:

Here, the dependent variable
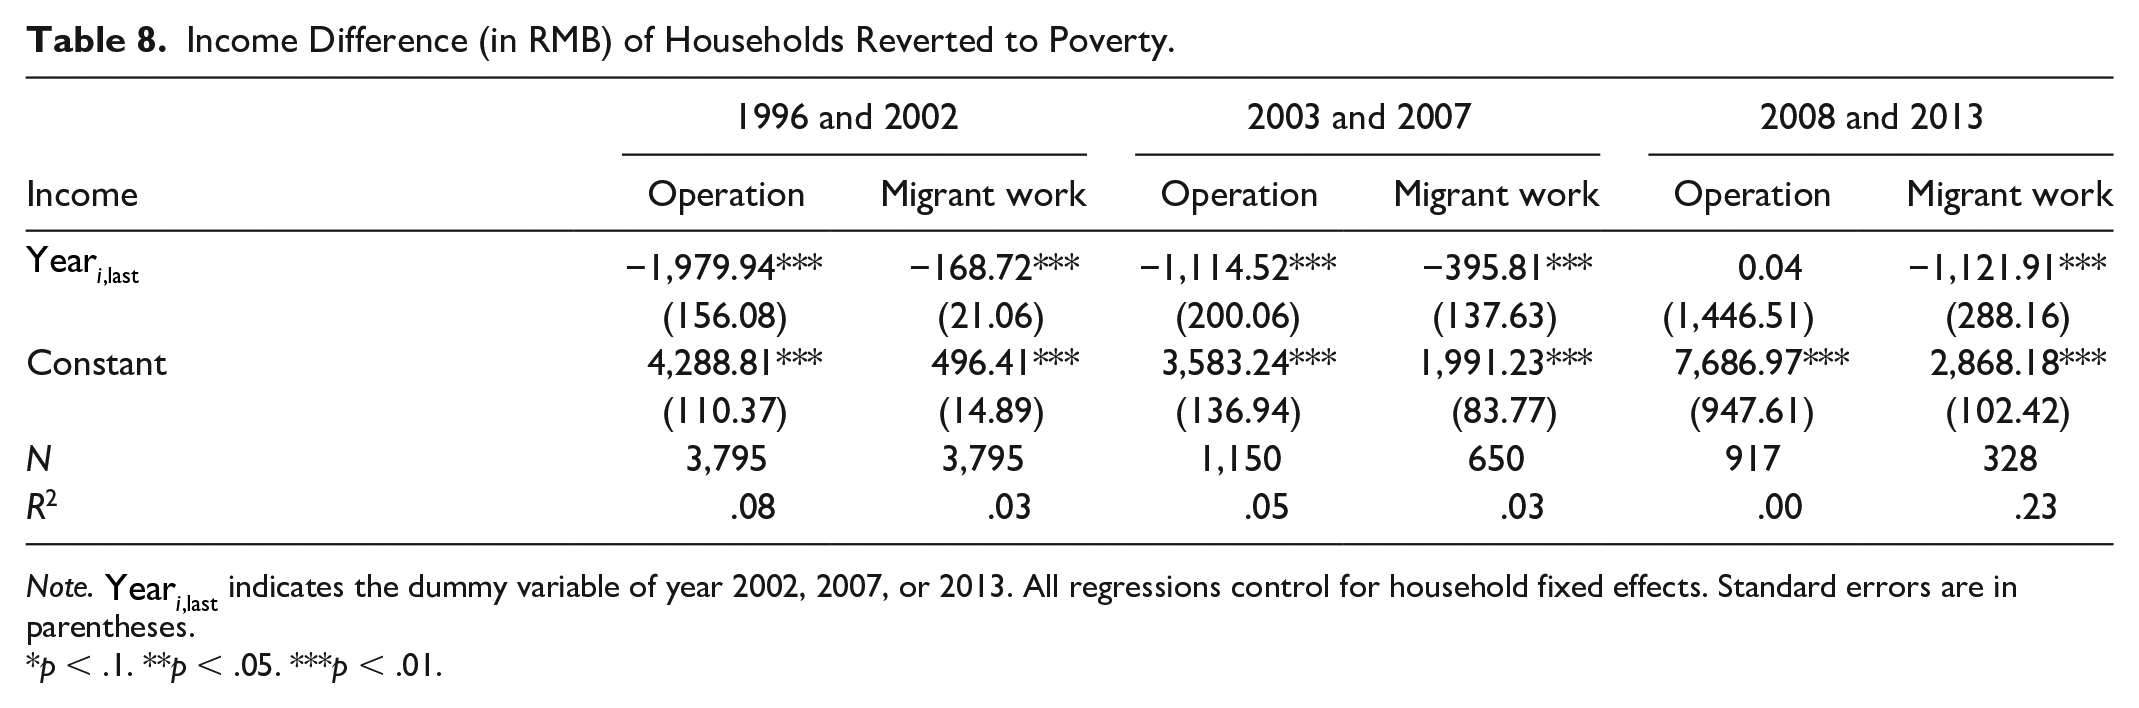
Tables 7 and 8 show the estimates that correspond to Equation 3. Household operating income was the main factor that affected poverty reduction in the first two periods. Table 7 shows that the operating income of households out of poverty increased by 1,348.69,1,896.06, and 3,450.74 RMB, respectively, in the three periods. Table 8 shows that the operating income of households that reverted to poverty decreased by 1,979.94 and 1,114.52 RMB, respectively, in the first two periods.
Income Difference (in RMB) of Households Out of Poverty.

Note.
p < .1. **p < .05. ***p < .01.
Income Difference (in RMB) of Households Reverted to Poverty.
Note.
p < .1. **p < .05. ***p < .01.
Agriculture may be more important than has been assumed. In 1985, the labor productivity difference between the richest of the countries in the world and the poorest countries was 78 times in agriculture and 5 times in nonagriculture (Restuccia et al., 2008). In the process of structure transformation, the improvements in agricultural technology release resources from agriculture, and improvements in industrial technology attract labor out of agriculture (Alvarez-Cuadrado & Poschke, 2011). In addition, Ravallion (2009) argues that the early success of agrarian reforms was causally relevant to the later growth of the labor-intensive manufacturing sector. Growth in primary agriculture did more to reduce poverty than did either the secondary or tertiary sectors from 1981 to 2001 (Ravallion & Chen, 2007).
Due to the arrangement of the land system, household operating income ensures the basic standard of living of Chinese farmers. Low inequality in access to farmland means that China’s agricultural growth was propoor. In contrast, India and Brazil had high initial inequality in land allocation (Ravallion, 2010). The change from the production-team system to the Household Responsibility System (HRS) since 1978 improved China’s agricultural growth in the early 1980s (J. Y. Lin, 1992).
Some would argue that it is inefficient to distribute land equally. Vietnam, which has been studying China’s system, introduced a free market in land-use rights in its 1993 Land Law (Ravallion & van de Walle, 2008). In fact, China is gradually promoting the leasing of land. In 2003, China announced the Rural Land Contracting Law (RLCL), which provides legal protection for farmers to rent out or rent in the land. Chari et al. (2017) found that the RLCL increased crop output and aggregate productivity by redistributing the land toward more productive farmers.
Reform of agricultural product prices is another important factor in increasing farmers’ household operating income. The slower pace of poverty reduction between 1996 and 2002 may be associated with lower agricultural product prices. In contrast, the faster pace of poverty reduction since 2003 was due to the higher agricultural product prices (Figure 2). To reduce the financial burden and adjust the structure of grain, since 1999, the Chinese central government has reduced the amount of grain purchased at protection prices (Y. Zhou & Shao, 2019). Grain output began to decline in the next several years (Figure 2). After 2003, minimum purchase prices and temporary purchase and storage policies were implemented, and grain output began to rise 2 (Figure 2).

Producer price index and output trends of grain in China.
Migrant Working Income
Migrant working income plays an increasingly important role in rural household income and poverty reduction. The proportion of migrant working income in total household income increased from 12.3% in 1996 to 43.67% in 2013. 3 Table 7 shows that, in the last two periods, migrant work played an essential role in lifting people out of poverty. The migrant working income of households out of poverty increased by 1,851.20 RMB from 2003 to 2007 and by 4,647.47 RMB from 2008 to 2013. In addition, Table 8 shows that, from 2008 to 2013, reversion to poverty occurred mainly due to the decline in migrant working income, which decreased significantly by 1,121.91 RMB among the reversion to poverty households.
Why did the migrant working income become an essential factor in poverty reduction? After market-oriented reform in rural areas, China had a surplus labor force. Becoming “the factory of the world” has been at the core of China’s development strategy for three decades (Lawrence, 2020). When the employment demand for secondary and tertiary industries is strong, the pace of rural labor transfers accelerates (J. Zhang & Cai, 2002). From the perspective of employment data, from 2002 to 2007, the employment elasticity of secondary and tertiary industries was 0.35, with an average annual increase of 17.35 million jobs (J. Zhang, 2009). The total number of migrant workers in China reached 225 million in 2008 and 269 million in 2013 (NBS of the People’s Republic of China, 2014).
There are empirical studies on trade opening and employment or income that show the power of “labor pull” of nonagricultural sectors. Cai and Zhang (2003) found that China’s acceptance into the World Trade Organization at the end of 2001 increased employment in labor-intensive industries and general service industries, such as wholesale and retail. Using micro population data and trade data from 2000 to 2005, C. Zhang (2015) found that exporting growth significantly promoted employment in the manufacturing and service sectors and, further, that this effect on the rural labor force was stronger. The empirical analysis of J. Zhu and Teng (2010) also showed that the development of labor-intensive industries brought by China’s trade opening is conducive to farmers’ nonfarm income.
High labor mobility may contribute to increasing farmers’ migrant working income. Otherwise, why did India, like China, with a surplus labor force, develop more capital-intensive industries? China’s high labor mobility strengthens its comparative labor advantage (Zheng, 2015). In 2009, Chinese migrant workers from rural areas worked an average of 26 days a month and 58.4 hr a week. In addition, 89.8% of migrant workers worked more than 44 hr per week, as stipulated in the Labor Law, and only 42.8% of migrant workers signed a labor contract with their employers (NBS of the People’s Republic of China, 2010). India, however, has more serious labor regulations than does China. Besley and Burgess (2004) found that labor regulation in India was associated with lowered output and employment. Hasan et al. (2012) also emphasized the importance of domestic labor market reform in India. They found that trade liberalization in India reduced unemployment in states with a flexible labor market.
Rural Public Insurance
Despite reducing poverty by promoting household operating and migrant working income, rural public insurance plays an increasingly critical role in preventing farmers from falling into poverty. In the market-oriented economic reform period, unlike Brazil, which scores well on propoor social policies, China scores well on propoor growth (Ravallion, 2010). Chinese farmers rely mainly on themselves for old-age care and medical care, which causes a significant burden.
Xie and Song (2005) chose Yushe County and Linxian County in Shanxi Province from which to select a representative village for investigation. Based on their survey, 76% of rural households had medical and drug expenses in 2003, the highest of which was 16,000 RMB, and the average of which was 1,579 RMB, whereas the average household net income was only around 3,000 RMB. Sickness has become one of the most significant risks for farmers. In 2003, China launched the New Rural Cooperative Medical Scheme (NCMS) that aimed to cover rural residents around the country by 2010. The standard fee paid per person rose from an initial 10 RMB per year to approximately 90 RMB in 2014. The government’s subsidy increased from 10 RMB per year in 2003 to 320 RMB in 2014. With an increase in the premium, the reimbursement ratio and scope also increased each year. In 2015, 670 million people participated in NCMS, accounting for 98.78% of the total rural population. Studies suggest the positive effect of NCMS on farmers’ consumption, health behavior, and health situation (Bai & Wu, 2014; L. Cheng, Liu, et al., 2015; Yu & Zhu, 2018).
After the international financial crisis of 2008, China’s entity economy suffered, and a large number of export-oriented enterprises went bankrupt. China promptly launched the New Rural Pension Scheme (NRPS). The NRPS was piloted in September 2009 and aimed to cover 10% of the counties (cities, districts, and towns) in China at the end of 2009 (General Office of the State Council of the People’s Republic of China, 2009). Since 2009, the pilot program has been gradually expanded and implemented nationwide. The goal was to provide full coverage to rural residents of relevant ages by 2020. In fact, the goal took only 3 years to achieve. In 2009, every enrollee aged 60 or above could receive the basic pension benefit of 55 RMB per month. In 2014, the basic pension benefit increased to 75 RMB per month. Researchers have been studying the effect of NRPS on farmers’ income, consumption, and labor supply (L. Cheng et al., 2018; Wei & Zhang, 2016).
To investigate the effect of NCMS (or NRPS) on poverty reduction, we estimate the following equation:

Here,
Because the NCMS pilot began in the second half of 2003, we consider 2004 as the first year of policy implementation. After 2007, the NCMS was popularized across the country, using a few control groups. Therefore, we use data from 2003 to 2007 of the NFS to estimate the effect of NCMS on poverty reduction. Column 1 of Table 9 shows that NCMS significantly reduces the likelihood of poverty. Because the coefficients of the probit model have no clear economic implications, we calculate the marginal coefficients (column 2), which shows that the NCMS significantly reduced the likelihood of poverty by 2.28%.
Impact of NCMS (or NRPS) on the Likelihood of Poverty.

Note. The poverty line is the net income of 2,300 RMB per person per year at the same prices in 2010. All regressions control for year fixed effects. Standard errors are in parentheses. NCMS = New Rural Cooperative Medical Scheme; NPRS = New Rural Pension Scheme.
p < .1. **p < .05. ***p < .01.
To separate the effect of NCMS, we use data from 2008 to 2013 of the NFS to estimate the effect of NRPS on poverty reduction. Column 3 of Table 9 shows that NRPS significantly reduced the likelihood of poverty. Because the coefficients of the probit model have no clear economic implications, we calculate the marginal coefficients (column 4), which shows that NRPS significantly reduced the likelihood of farmers’ poverty by 1.58%.
Challenges of Poverty Reduction
China has made a significant achievement in poverty reduction. Nevertheless, challenges remain. Even if China achieves its poverty reduction goal in the 2030 agenda for sustainable development, it still needs to prevent those who have been lifted out of poverty from reverting to poverty.
Growth of Migrant Workers Is Slowing
The most effective way to improve farmers’ income is to create more nonfarm employment (Zhong & He, 2007). After the financial crisis of 2008, however, the growth rate of migrant workers has been slowing. Figure 3 shows that, after 2008, the growth rate of migrant workers dropped from 5.42% in 2010 to 2.77% in 2015, slightly recovered in 2017, and then fell to 0.64% in 2018. Because the wages of labor rose, China’s competitiveness in the most labor-intensive manufacturing industries has eroded (Lawrence, 2020). As manufacturing shifts from China to other developing countries, such as Vietnam, and due to the emergence of antiglobalization, the growth of nonfarm employment for farmers will continue to be slow.

The trend in the number and growth rate of migrant workers in China.
An Aging Population
The elderly are at high risk of poverty. When the elderly drop out of the labor market and their savings are exhausted, they can easily fall into long-term poverty if they have no other source of income. In addition, the high incidence of disease among the elderly increases their medical expenses (D. Wang & Zhang, 2005).
Figure 4 shows that the proportion of the elderly population in the total population is increasing. In 1956, the United Nations defined the criteria for the classification of an aging society: a population above 60 years old, accounting for 10% of the total population, or a population above 65 years old, accounting for 7% of the total population. Both numbers in China are well above these levels. In 2017, China had 202 million people above the age of 60, accounting for 14.9% of the total population, among whom 158 million people were above 65 years old, accounting for 11.4% of the total population. The Chinese National Health Commission predicts that the number of elderly people above 60 will increase to approximately 255 million in 2020, accounting for 17.8% of the total population.

The proportion of each age group in the total population in China.
Furthermore, the number of working-age people has been on a downward trend. Figure 4 shows that the proportion of the population aged between 15 and 64 (the working-age population) in the total population peaked in 2010 (74.5%) and has been declining ever since. The old dependency ratio (ODR), the ratio of the population aged 65 years old or above to the population aged between 15 and 64, has been gradually rising. In 2017, the ODR reached its highest, at 15.86%. Finally, the number of children (aged between 0 and 14) is also decreasing. In 2017, the proportion of the population aged between 0 and 14 in the total population decreased to 16.8% from 27.7% in 1990.
Increasing Burden of Government Finances
The sustainability of public insurance is a concern. First, with an aging population, the demand for old-age care and medical services is increasing. As a result, old-age and medical insurance funds and the government are fiscally burdened. Second, there are problems of adverse selection and moral hazard in public insurance. For example, young people aged between 16 and 39 are less motivated to participate in NRPS. The main reason is that the waiting time for receiving the benefit of a pension is as long as 30 or 40 years. In addition, it is difficult to predict how serious inflation will be (Su & Zhou, 2010). NCMS, which focuses on significant diseases, may lead to “excessive medical treatment for minor diseases” and increase the burden on the NCMS fund (X. Zhu & Peng, 2009).
As noted, public old-age and health insurance funds are highly dependent on government subsidies, which puts substantial pressure on government finances. In 2017, the total revenue of basic old-age insurance funds for urban and rural residents totaled 2,775.74 billion RMB, of which government subsidies totaled 2,319.19 billion RMB, accounting for 69.45% of the fund’s total revenue. The total revenue of basic medical insurance funds for urban and rural residents totaled 6838.33 billion RMB, of which government subsidies totaled 4918.68 billion RMB, accounting for 71.93% of the fund’s total revenue (NBS of the People’s Republic of China, 2018).
Because the old-age insurance for urban and rural residents started only in 2009, 4 the operating funds are still sufficient. It is useful, however, to look at the operations of old-age insurance for urban workers, which started in the 1990s. In 2016, the net revenue of the old-age insurance fund for urban workers in seven out of 31 provinces was negative. For example, the cumulative balance of pension funds in Heilongjiang Province was negative (NBS of the People’s Republic of China, 2017). In 2017, the Chinese central government decided to transfer a 10% stake in state-owned enterprises to the National Council for the Social Security Fund, the country’s social security reserve fund (General Office of the State Council of the People’s Republic of China, 2017).
Discussion and Conclusion
We use panel data from 1996 to 2013 to study the trends and the factors that drive poverty reduction in rural China. After 2003, the pace of poverty reduction in rural China was faster than that between 1996 and 2002. The main reasons for poverty reduction in China since 1996 have been the increase in household operating income and migrant working income. In addition, rural public insurance has significantly reduced the likelihood of poverty.
The challenges to poverty reduction in China’s rural areas are as follows: A decrease in nonfarm employment leads to a decline in farmers’ nonfarm income; the aging population puts the elderly at high risk of poverty; and the sustainability of rural public insurance is a concern.
The evidence supports the following policy recommendations. First, the systems of rural land and agricultural product prices should continue to be reformed to improve farmers’ household operating income. Second, the government should promote nonfarm employment to enhance farmers’ nonfarm income and continue to address the backwardness of the household registration system to offer migrant workers equal access to public services. Third, the rural public insurance system should be reformed to reduce adverse selection and moral hazard, and the benefits of rural public insurance should be designed to be sustainable.
Footnotes
Acknowledgements
The authors thank Ning Neil Yu, Xi Qu, Shougui Luo, Yuming Wu, Ming Jiang, Junxiu Zhang, anonymous referees, and participants in conferences and workshops for comments.
Declaration of Conflicting Interests
The author(s) declared no potential conflicts of interest with respect to the research, authorship, and/or publication of this article.
Funding
The author(s) disclosed receipt of the following financial support for the research, authorship, and/or publication of this article: Fang and Shi acknowledge the support of grants from the National Natural Science Foundation of China (project codes 71833003, 71973094, 71773076, and 71673186). Gai acknowledges the support of grants from the National Natural Science Foundation of China (project code 71603154) and the Shanghai Pujiang Program (project code 18PJC038). Chaofei He acknowledges the support of grants from the China Disabled Persons’ Federation Project (project code CJFJRRB41–2020) and the Third Phase of Priority Academic Program in Jiangsu Province (project code 87–2018).