
Abstract
This paper examines the return predictability of investor sentiment in 12 Asian and European markets during the period between 2004 and 2016. Employing the composite sentiment index constructed from the consumer confidence index (CCI), advance/decline ratio (ADR), and volatility premium (VP), we find a strong negative relationship between investor sentiment and the next 3 to 24-month returns. This outcome implies that sentiment could be a contrarian predictor of market returns over various periods. Moreover, we reveal an essential role of local factors, including financial development, institutional governance, and culture, in the sentiment-return diversification among regional markets. We discover that the moderating effect of market-specific factors is time-varying and different between Asian and European areas. As a result, sentiment has a shorter-term impact in Europe but a longer-term impact in Asia.
Keywords
Introduction
According to Brown and Cliff (2004), sentiment represents the expectations of market participants relative to a norm: a bullish (bearish) investor expects returns to be above (below) average, whatever “average” may be. Since the 1990s, accompanied by the foundation of behavioral finance, the role of sentiment in explaining abnormal returns has been questioned and investigated in various research. However, the findings are mixed. While some studies claim that investor sentiment has a significant impact, positively or negatively, on stock returns (Dash & Maitra, 2018; Gao et al., 2020; Grigaliūnienė & Cibulskienė, 2010), others detect that the sentiment-return inference is negligible (Gizelis & Chowdhury, 2016; S. H. Kim & Kim, 2014; Solt & Statman, 1988).
The heterogeneous findings in the sentiment-return studies across markets have motivated researchers to discover the causes behind them. Among the research implemented to address this issue, Corredor et al. (2013), Schmeling (2009), and Zouaoui et al. (2011) have declared that market-specific characteristics play a vital role in the variation of sentiment impact on stock returns worldwide. Nonetheless, these studies have limitations. The papers of Schmeling (2009) and Zouaoui et al. (2011) only examine a few aspects of culture and institutional governance. Whereas, Corredor et al. (2013) and Schmeling (2009) eliminate the potential role of development differences by investigating industrialized countries, which are comparable in growth level. Incredibly, none of these studies pay attention to the local effect’s possible changes across time horizons, which might also influence the sentiment-return inference between different predictive periods.
To address these limitations, we examine the return predictability of sentiment with a broader scope by using a varied sample that includes 12 markets in Asia and Europe. For each market, we create a composite sentiment index by utilizing both explicit and implicit sentiment indicators, including the consumer confidence index (CCI), advance/decline ratio (ADR), and volatility premium (VP). Our first motivation is to detect whether sentiment intensity is similar or variant across separate groups of markets. Some prior studies, such as Corredor et al. (2015), Gao et al. (2020), and Jacobs (2016), have questioned the differences in sentiment impact between developed and emerging markets. However, none of them investigates cross-market variations in geography, as conducted in our research by comparing Asian and European markets. Secondly, we explore the driving forces of such differences by focusing on three local features: financial development, institutional quality, and culture.
Overall, our study contributes to financial literature from several perspectives. First, we provide more evidence about the relationship between investor sentiment and subsequent returns for multiple markets at the aggregate and regional levels. More importantly, we demonstrate the diverse sentiment power for the return predictability across regions by comparing Asian and European markets. Such differences vary with the length of the forecast horizons, from 1 to 24 months. Also, the role of market-specific factors as one of the underlying causes of the heterogeneities in the sentiment-return correlation is extensively examined by employing a diverse set of 14 local characteristics. With the advantages of our sample, we can confirm the moderating impact of these market features and prove that their impact is time-varying and different between Asia and Europe.
The rest of this paper is organized as follows. Section 2 outlines significant research about the sentiment-return nexus and presents our hypotheses. The data set and the methods used to address our research problems are introduced in the next section. Section 4 presents our preliminary tests and main results. The final part concludes the implications, limitations, and future lines of this research.
Literature Reviews and Hypotheses Development
The Sentiment-Return Relationship
Up to now, despite being investigated extensively, the sentiment impact on stock returns is still inconclusive as the results from both direct and indirect approaches classified by used sentiment proxies are diverse.
One of the most popular direct sentiment proxies is indices derived from investor surveys used by Grigaliūnienė and Cibulskienė (2010), Shi et al. (2022), and Solt and Statman (1988). Solt and Statman (1988) documented that the Bearish Sentiment Index constructed from Investors’ Intelligence’s survey is unsuitable as an indicator of forthcoming U.S. stock price change. On the other hand, the study by Grigaliūnienė and Cibulskienė (2010) for Scandinavian stock markets found evidence of a negative relationship between the consumer confidence index and aggregate market returns. Recently, Shi et al. (2022) have examined the impact of local sentiment on stock returns of different business sectors and found that sentiment only positively and significantly affects the expected returns of basic materials, consumer goods, financials, and industrials.
In parallel, the results obtained from other direct indicators, including investor mood (J. H. Kim, 2017; Yuan et al., 2006), option implied volatility (Bekaert & Hoerova, 2014; Qadan et al., 2019), and text-based indices (Antweiler & Frank, 2004; Gao et al., 2020; S. H. Kim & Kim, 2014), are also divergent. The text-based indices can serve as an example of divergent results. In the United States, by using a similar technique to create a sentiment index from million messages posted on Yahoo! Finance, Antweiler and Frank (2004) found a positive shock to message board posting can predict negative returns on the next day, while S. H. Kim and Kim (2014) found no evidence that investor sentiment forecasts future stock returns either at the aggregate or individual firm levels. Globally, Gao et al. (2020) employed households’ Google search behavior to construct weekly sentiment indices for 38 markets and showed that their sentiment measure is a contrarian predictor of country-level market returns.
The studies that employed indirect sentiment proxies share the same vein with heterogeneous outcomes. Pan and Poteshman (2006) presented robust evidence that option trading volume contains information about future U.S. stock prices. Likewise, using a broad set of indirect sentiment proxies and value-weighted market indices, Dash and Maitra (2018) detected a strong sentiment effect on the Indian markets’ returns both in the short and long run. Conversely, Gizelis and Chowdhury (2016) showed that investor sentiment, measured by closed-end fund discount, weakly explains returns in the Athens Stock Exchange. In particular, Cheema et al. (2020) constructed a sentiment index from the price-earnings ratio, turnover ratio, and the number of newly opened individual investor accounts and revealed a strong positive association between investor sentiment and subsequent returns during the bubble period in China. Nevertheless, once the bubble period is excluded, they found that the sentiment impact on future returns becomes negligible.
Since the earlier findings are mixed, we propose our first hypothesis as follows:
H1: Investor sentiment has an impact on future stock returns.
Impact of Market-Specific Factors
Besides examining the sentiment-return relationship, researchers also pay attention to explaining the diversifications of sentiment impact on stock returns across markets.
Several researchers, such as De Long et al. (1990), Ding et al. (2019), Hirshleifer (2001), and Jacobs (2016), have declared that the heterogeneities in investors’ misperceptions could significantly affect stock pricing. Since investors in different markets may have different misperceptions due to the divergences in culture, market integrity, and development level, the sentiment impact on stock returns derived from investor behaviors is also expected to be divergent. In addition, Aggarwal et al. (2005) observed that institutional investors, who are more likely to be arbitrageurs, invest more in open emerging markets with stronger accounting standards, shareholder rights, and legal frameworks. Fernandes et al. (2010) proved that non-U.S. firms’ shareholders tend to place significant value on U.S. securities regulations, especially when their home countries’ investor protections are weak. These two papers imply that a weak trading environment might demoralize activities by both arbitrageurs and behavioral investors, thus influencing market sentiment.
As a result, the market-specific factors could partly explain the differences in the sentiment-return nexus (Corredor et al., 2013; Schmeling, 2009; Wang et al., 2021; Zouaoui et al., 2011). Zouaoui et al. (2011) investigated the United States and 15 European countries and claimed that collectivistic, high uncertainty avoidance, and low-quality institutional countries suffer from sentiment impact more than individualistic, low uncertainty avoidance, and high-quality institutional ones, as stated similarly in Schmeling (2009). Corredor et al. (2013) discovered that the sentiment-return variations across markets relate to both stock characteristics and national cultural or institutional differences. The recent study by Wang et al. (2021) has confirmed that the heterogeneities in sentiment impact can be explained by cross-market differences in culture and institutional governance, along with intelligence and education, to varying degrees.
Based on these studies, our second hypothesis is:
H2: Market-specific factors have a moderating effect on the sentiment-return relationship.
Asia Versus Europe
As stated in K. A. Kim and Nofsinger (2008), Asians suffer from cognitive biases more than people of Western cultures do. They explained that Western societies are individualistic, prioritizing the self over the group, while Asian societies are collectivistic, prioritizing the group (Hofstede, 1980). These divergences manifest in patterns of cognition and behavior concerning the self and others. For example, some studies have argued that collective-oriented societies could cause individuals to be overconfident, which is a behavioral bias (Markus & Kitayama, 1991; Schmeling, 2009).
Empirically, there is evidence proving the differences between Easterners’ and Westerners’ biases. Chang et al. (2001) showed that European Americans, compared with Japanese, are more likely to predict positive events to occur to themselves than to others. In contrast, the opposite pattern appears in the prediction of negative events. Similarly, Hamamura et al. (2009) discovered that East Asians pay more attention to avoidance-oriented information, while Westerners pay more attention to approach-oriented information. On the contrary, Yiend et al. (2019) found that Hong Kong residents are more positively biased than people living in the UK on several measures, consistent with the lower prevalence of psychological disorders in East Asia. They also observed that migrants to the UK reduce positive biases on some tasks, while migrants to Hong Kong are more optimistic, compared to their respective home counterparts, consistent with acculturation in attention and interpretation biases.
The outcomes revealed from these studies lead to the expansion of our first two hypotheses:
H3: The sentiment impact on future returns is different between Asian and European markets.
H4: The moderating effect of market-specific factors on the sentiment-return relationship is different between Asian and European markets.
Data and Methodology
To conduct this study, we employ a sample including monthly data from 12 markets (six in Asia: China, Hong Kong, Indonesia, Japan, South Korea, and Thailand, and six in Europe: The Czech Republic, Hungary, Italy, the Netherlands, Sweden, and the United Kingdom) over the period between 2004 and 2016. 1 According to the MSCI market classification in 2021, half of our sample, including Hong Kong, Japan, Italy, the Netherlands, Sweden, and the United Kingdom, are developed markets. The others are emerging ones. The markets are selected based on their data availability, location, and development level. This selection process aims to form an economically and geographically diversified sample that allows us to examine the influence of market-specific factors in later analyses. Following Ajao et al. (2012), we apply the cubic spline interpolation method to convert quarterly series to monthly ones.
Data
Market returns and sentiment indicators
First, we choose the main stock index for each market, which stands for the overall market performance. 2 Then, we create the monthly return series from the end-of-month price indices: Ri,t = 100 × ln(PIi,t/PIi,t−1). The price indices are collected in local currency to prevent currency and exchange rate effects.
Regarding sentiment measurement, we select CCI, ADR, and VP to construct a composite index among numerous implicit and explicit proxies employed in previous research. The most common composite index is Baker and Wurgler’s sentiment index, built for the U.S. market from six indicators: dividend premium, first-day returns on IPOs, IPO volume, equity shares in new issues, and market turnover (Aissia, 2016; M. Baker & Wurgler, 2006; Spyrou, 2012; Ur Rehman et al., 2022). However, due to the availability of sentiment proxies, M. Baker et al. (2012) chose to use only four proxies: volatility premium, turnover, IPO volume, and first-day returns on IPOs, to construct the sentiment index for their study of six international stock markets. The authors have recently removed market turnover from their composite index since they argued that turnover does not mean what it once did, given the explosion of high-frequency institutional trading and the migration of trading to various venues. Consequently, we keep VP from Baker and Wurgler’s index, replace turnover with ADR, and use CCI to compensate for the lack of IPO data, according to Corredor et al. (2013).
The first indicator, CCI, is an economic indicator based on direct surveys of residents’ and households’ opinions on their expected consumption and savings. CCI has been used as a sentiment measure in the papers of Corredor et al. (2015), Grigaliūnienė and Cibulskienė (2010), and Shi et al. (2022). The second proxy, ADR, is the market indicator comparing the number of stocks that increased in value to the number of stocks that decreased in value. We measure ADR by the ratio between rising and falling stocks during a given month. Since it might signify the market direction, ADR has been implemented by Brown and Cliff (2004), Dash and Maitra (2018), and Liu et al. (2020) for their studies about the sentiment-return relationship. Lastly, we use VP as the third sentiment indicator for our analyses as difficult-to-value stocks are more affected by the sentiment effect, as stated by M. Baker et al. (2012) and Rashid et al. (2019). VP is calculated as the log of the average market-to-book ratios between high (the top 30%) and low (the bottom 30%) volatility stocks after being sorted by their standard deviation from the previous year. Along with other research, we expect a positive relationship between these proxies and the comprehensive index.
The main statistics for stock returns and three sentiment indicators in 12 sample markets from 2004 to 2016 are presented in Table 1.
Descriptive Statistics for Main Variables.

Note. This table presents the mean (µ) and standard deviation (σ) for market returns and three sentiment indicators, including CCI, ADR, and VP. The sample period is from 2004 to 2016.
As can be seen from the table, all markets, except Italy, experience positive average monthly returns, ranging from 0.214% in the Czech Republic to 1.305% in Indonesia. The Italian market’s outcome is predictable as it has been one of the slowest markets to recover after the Great Recession. Asian emerging markets outperform the developed ones, with higher expected returns and similar standard deviations. However, results for the European region are inconclusive since the Czech Republic market earns the lowest positive estimate point of returns, followed by the Netherlands. Generally, compared to other markets in the same area, South Korea and Sweden could be considered as potential investment markets with the second-largest monthly average returns at 0.587% and 0.557% and one of the lowest standard deviations of 5.315 and 4.648, respectively.
Regarding sentiment proxies, while Hong Kong, Japan, and Thailand reveal a pessimistic perception of the economic outlook, proven by under-neutral average CCIs, other Asian markets’ citizens seem to be optimistic about the business conditions in the future. 3 In Europe, the residents’ expectations about economic prospects are worse since five out of six markets witness below neutrality values for their average CCI. Concerning ADR, Asian results are almost homogeneous as the average ADRs are approximately one per month for all markets. In contrast, European markets are more heterogeneous, with ADRs fluctuating from 0.964 in Hungary to 1.091 in the Czech Republic. Lastly, all European and two-thirds of Asian markets have positive monthly averages of VP. Hong Kong and Thailand hold the exception, with their average VPs being −0.003 and −0.132, respectively. Compared to the CCI series, the standard deviations of ADR and VP are much smaller.
Market-specific factors
Our study examines the impact of local characteristics on the relationship between sentiment and future returns in terms of financial development, institutional governance, and culture. 4
To perform these examinations, first, we employ the Financial Development Index provided by the International Monetary Fund. The Financial Development series assesses the differences in financial growth levels across countries based on two aspects: financial institutions (FI) and financial markets (FM). Banks, insurance companies, mutual funds, and pension funds are major parts of financial institutions, while financial markets include stock and bond markets. FI and FM are then ranked by their depth, access, and efficiency. This series is available until 2016, which leads to the end of our sample this year.
Furthermore, to measure the divergences in institutional quality among our sample markets, we select the Worldwide Governance Indicators reported annually by the World Bank. As claimed by the World Bank, the Worldwide Governance Indicators include six aggregate indices constructed from individual metrics of more than thirty underlying data sources. These six indices are: (i) Voice and Accountability (VA) demonstrates a country’s citizens’ freedom; (ii) Political Stability and Absence of Violence (PA) expresses the unstable degree of politics; (iii) Government Effectiveness (GE) measures how well public services are delivered; (iv) Regulatory Quality (RQ) assesses the effectiveness in regulating the private sectors of the government; (v) Rule of Law (RL) explores how well social rules are followed; and (vi) Control of Corruption (CC) refers to what extent public authority is used for private gains.
Lastly, we choose Hofstede’s six cultural dimensions, including Power Distance Index (PDI), Individualism versus Collectivism (IDV), Masculinity versus Femininity (MAS), Uncertainty Avoidance Index (UAI), Long-term versus Short-term Orientation (LTO), and Indulgence versus Restraint (IVR). In detail, PDI captures the acceptance degree of unequally distributed power, IDV explores the independent/dependent level of people in a society, MAS expresses the degree of competitiveness in a society, UAI measures how people react to uncertain situations, LTO demonstrates whether people’s activities are focused on the past, present, or future, and IVR reflects how much freedom individuals have from society to pursue their desires.
Macroeconomic factors
Prior studies, for example, Rashid et al. (2019), Smales (2017), Subeniotis et al. (2011), and Verma and Verma (2008), have suggested that economic conditions play a significant role in the movement of stock returns and affect the findings of the sentiment-return relationship. As a result, we decide to add the monthly growth rates of the unemployment rate (UR), industrial production index (IP), consumer price index (CPI), dividend yield (DY), and short-term interest rate (SR) into our regression models as control variables.
Methodology
The construction of the sentiment index
Based on the three sentiment proxies introduced in the data section, we construct an inclusive sentiment index for individual markets in our sample. Since CCI, ADR, and VP are calculated on different scales, we begin by standardizing each proxy to produce a series with 0 mean and 1 standard deviation. Although these indicators have been confirmed in the earlier research to embody market sentiment features, they also capture other idiosyncratic, non-related sentiment components. Therefore, we apply the principal component analysis (PCA) to extract the proxies’ sentiment component.
By way of PCA, the first principal component of CCIt, ADRt, VPt, and their 1-year lags, symbolized as CCIt−1, ADRt−1, and VPt−1, is estimated. We store it as the first-stage index with six loadings. The appearance of lag variables in our procedure is because some sentiment indicators might take more time to release the same effect as others, according to Corredor et al. (2013) and Huang et al. (2015). We then compare the correlation between each sentiment pair and the first-stage index. Finally, PCA is replicated for three loadings, either t or t−1, which correlate stronger with the first-stage index. We use the first principal component created from this step as the sentiment index in later analyses. The description of each market sentiment is presented in Table 2.
Market-Specific Sentiment Index.
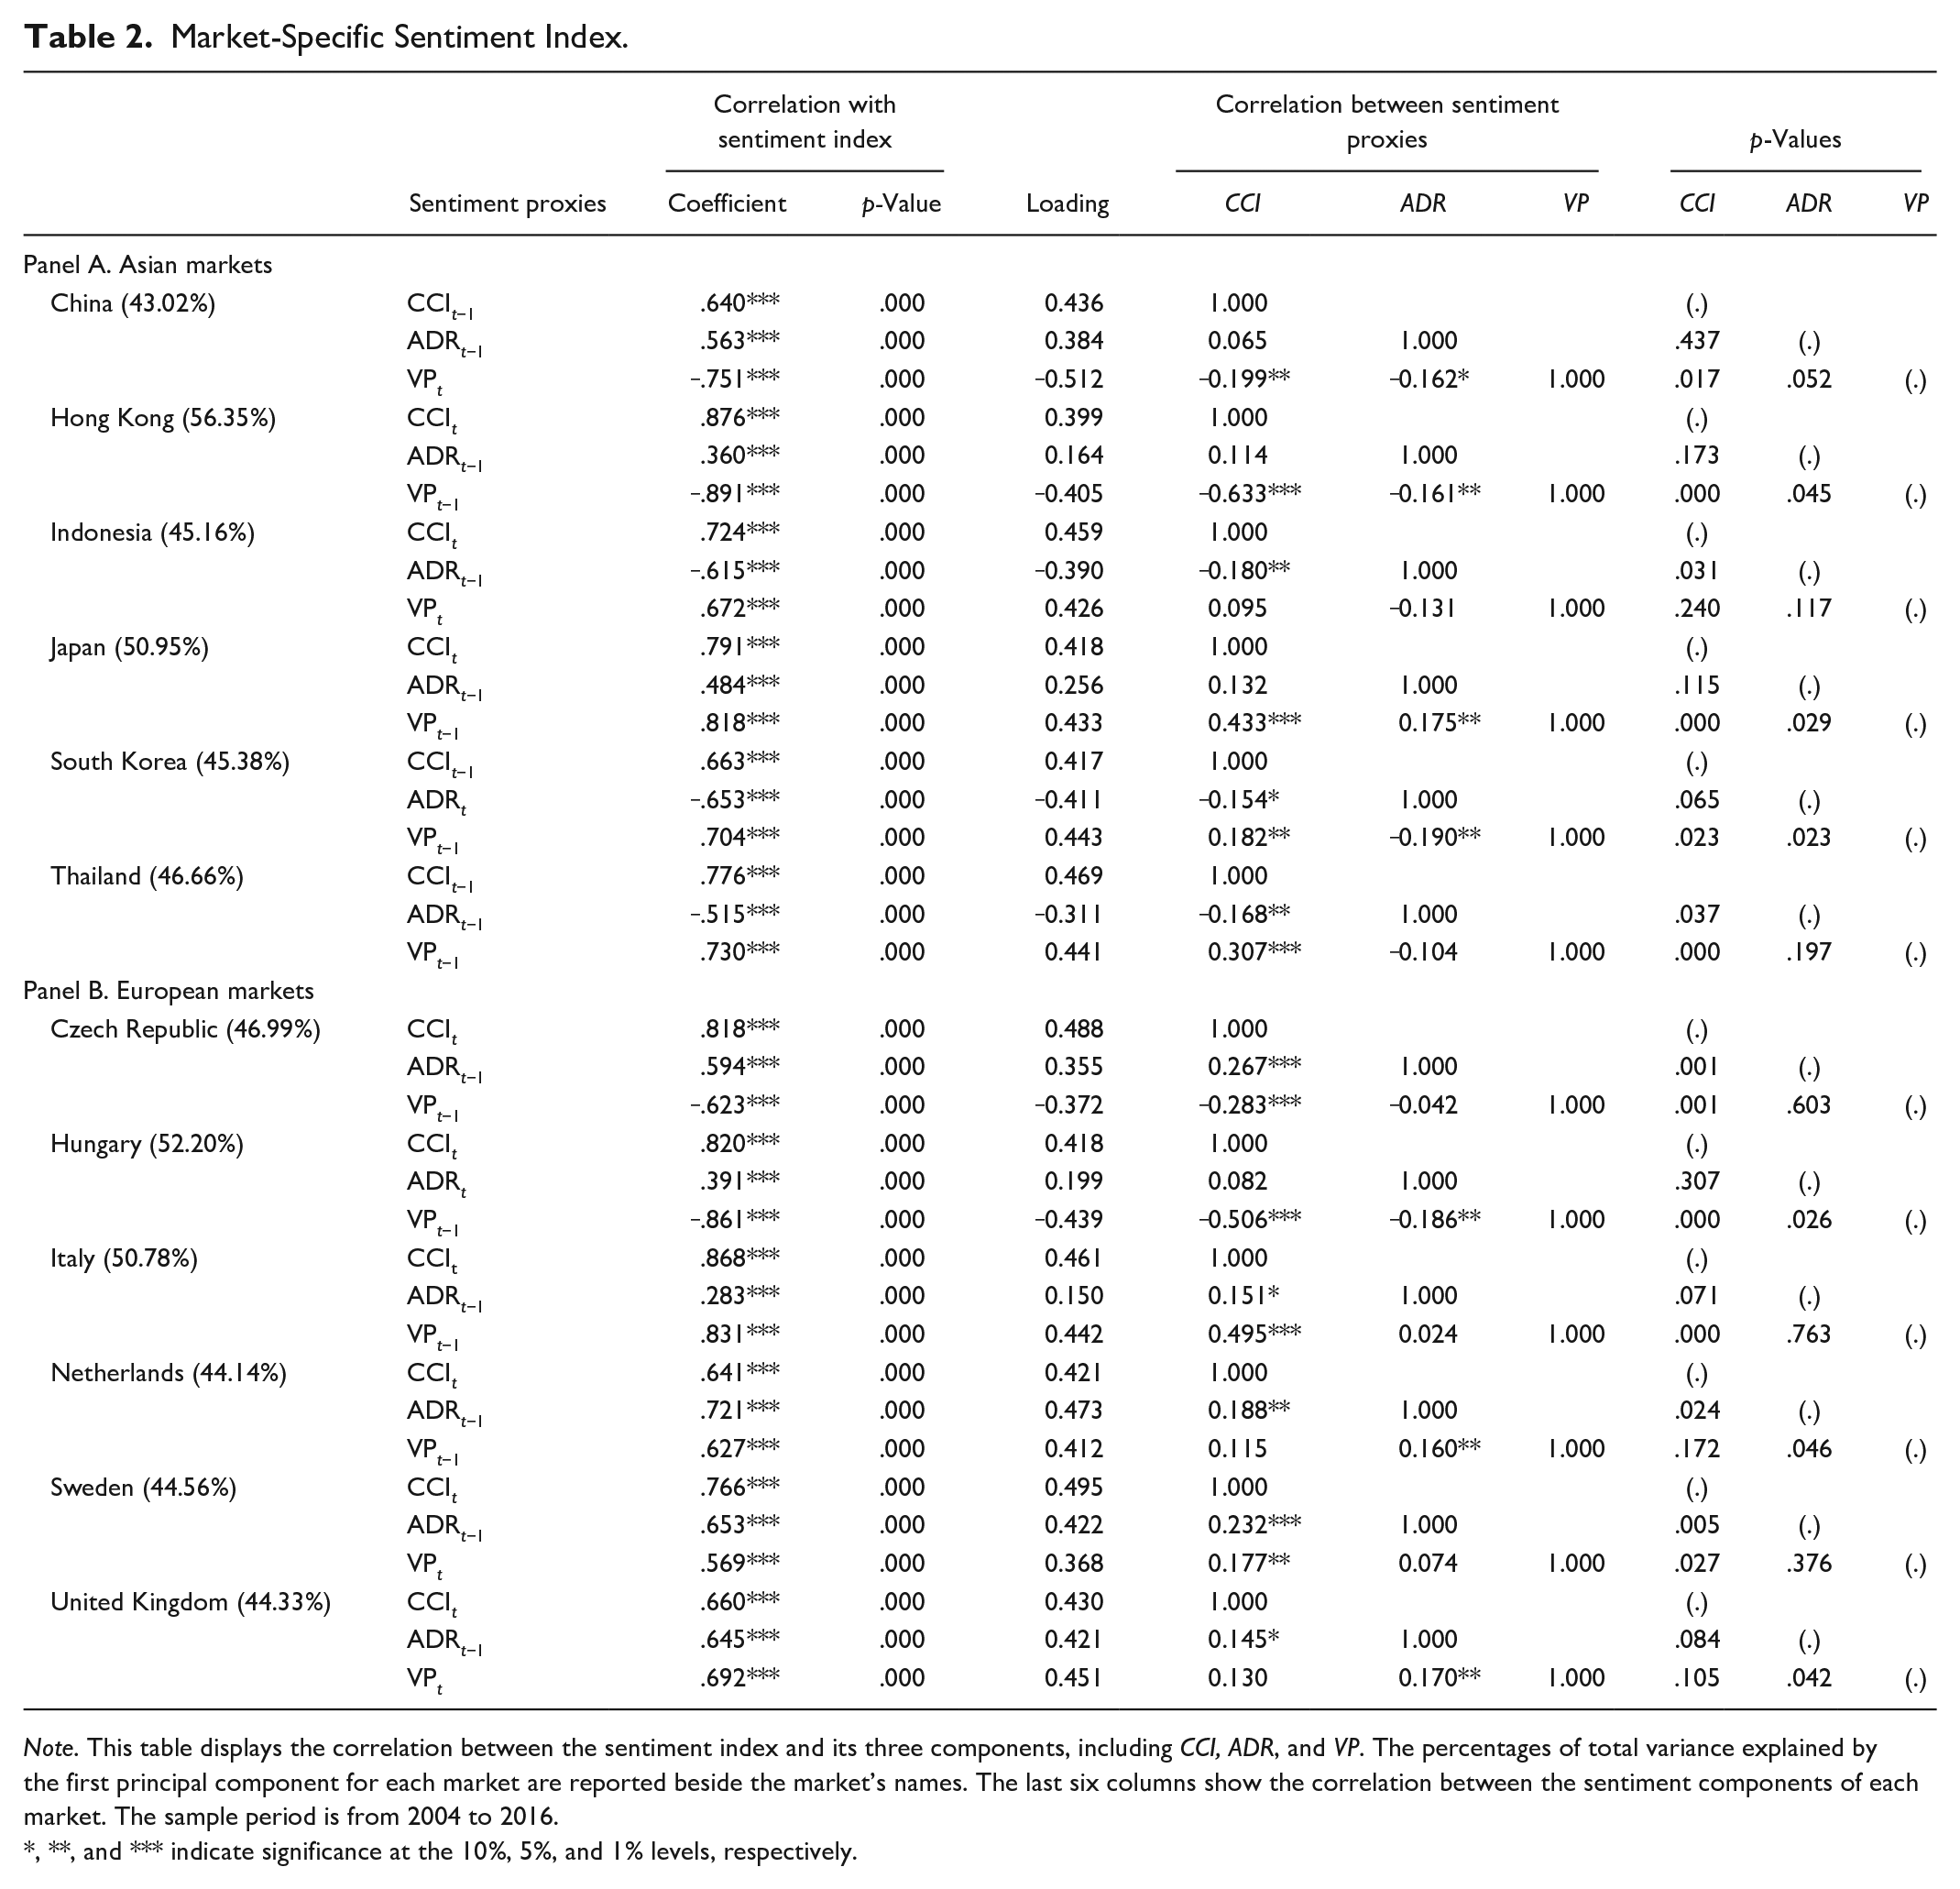
Note. This table displays the correlation between the sentiment index and its three components, including CCI, ADR, and VP. The percentages of total variance explained by the first principal component for each market are reported beside the market’s names. The last six columns show the correlation between the sentiment components of each market. The sample period is from 2004 to 2016.
, **, and *** indicate significance at the 10%, 5%, and 1% levels, respectively.
Table 2 displays the explanation power of each market sentiment, that is, the percentage of total variance explained by the first principal component. The sentiment index of China, at 43.02%, and Hong Kong, at 56.35%, have the lowest and highest explanation power, respectively. Those percentages are not so different in the remaining markets, where they vary from 44.14% to 52.20%. The details about each component’s loadings in the total index are also introduced. We observe that two-thirds of the markets have equivalent component loadings, except Hong Kong, Japan, Hungary, and Italy, where ADR loadings are much lower than others.
The relationship of each sentiment component with its corresponding index is also shown in Table 2. As presented in Table 2, all estimated coefficients are statistically significant. Specifically, CCI positively correlates with the sentiment index in all markets. The results for ADR and VP, on the contrary, are diverse. Concerning ADR, 3 out of 12 markets, namely Indonesia, South Korea, and Thailand, display a negative relationship between this proxy and the sentiment index. The proportion of VP is slightly higher, with one-third of our sample showing a negative coefficient. Lastly, the sentiment components themselves also reveal a strong connection with each other since at least two out of three pairs in every market have significant coefficients, excluding Indonesia.
The return predictability of investor sentiment
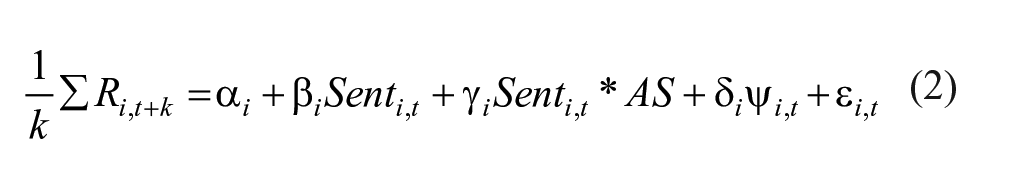
Before executing our main analyses, we perform panel unit root tests to investigate whether the sentiment index and five macroeconomic variables across markets are stationary. The results for Levin-Lin-Chu, Im-Pesaran-Shin, and augmented Dickey-Fuller tests confirm there is no unit root in these series. 5 We then assess the return predictability of market sentiment, using the underlying regression:

Where
The estimation procedures for markets at aggregate and regional levels are pooled OLS regressions with cross-market fixed effects and time dummies.
Additionally, we investigate whether there is any heterogeneity in the sentiment intensity between Asian and European markets by generating a dummy variable, denoted as AS. AS gets a value of 1 for Asian markets and 0 for European markets. Then, we run the model with the interaction term between sentiment and AS to clear this matter:
In the end, we compare the estimated coefficients of Asian and European markets across horizons by executing seemingly unrelated estimations and Chow tests.
The impact of market-specific factors
To examine the moderating role of market-specific factors in the return predictability of sentiment, we first classify markets into two groups: below and above-median, based on 14 local characteristics mentioned in the data section. Equation (1) is then executed for both groups to explore the sentiment effect in markets with unique features in development level, governance, and culture. Eventually, we differentiate the estimated results to find out if there is any discrepancy between these groups.
Further, we create interaction terms between sentiment and the market-specific factors, then run the following regression model to verify our results:
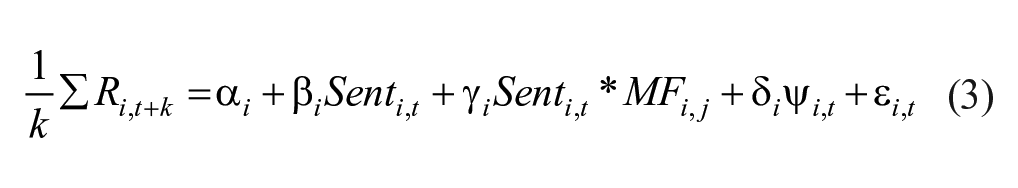
In which
Finally, we assess whether the effect of local factors is the same for markets in Asia and Europe in two ways. First, we compare the coefficients of the sentiment-factor interaction variables after running equation (3) for the groups of Asian and European markets. Second, we execute the below model:

Results
The Return Predictability of Investor Sentiment
The total market
Table 3 displays the panel regression results of equation (1) for the sentiment index across markets in various forecast horizons.
The Return Predictability of Sentiment Across Markets.
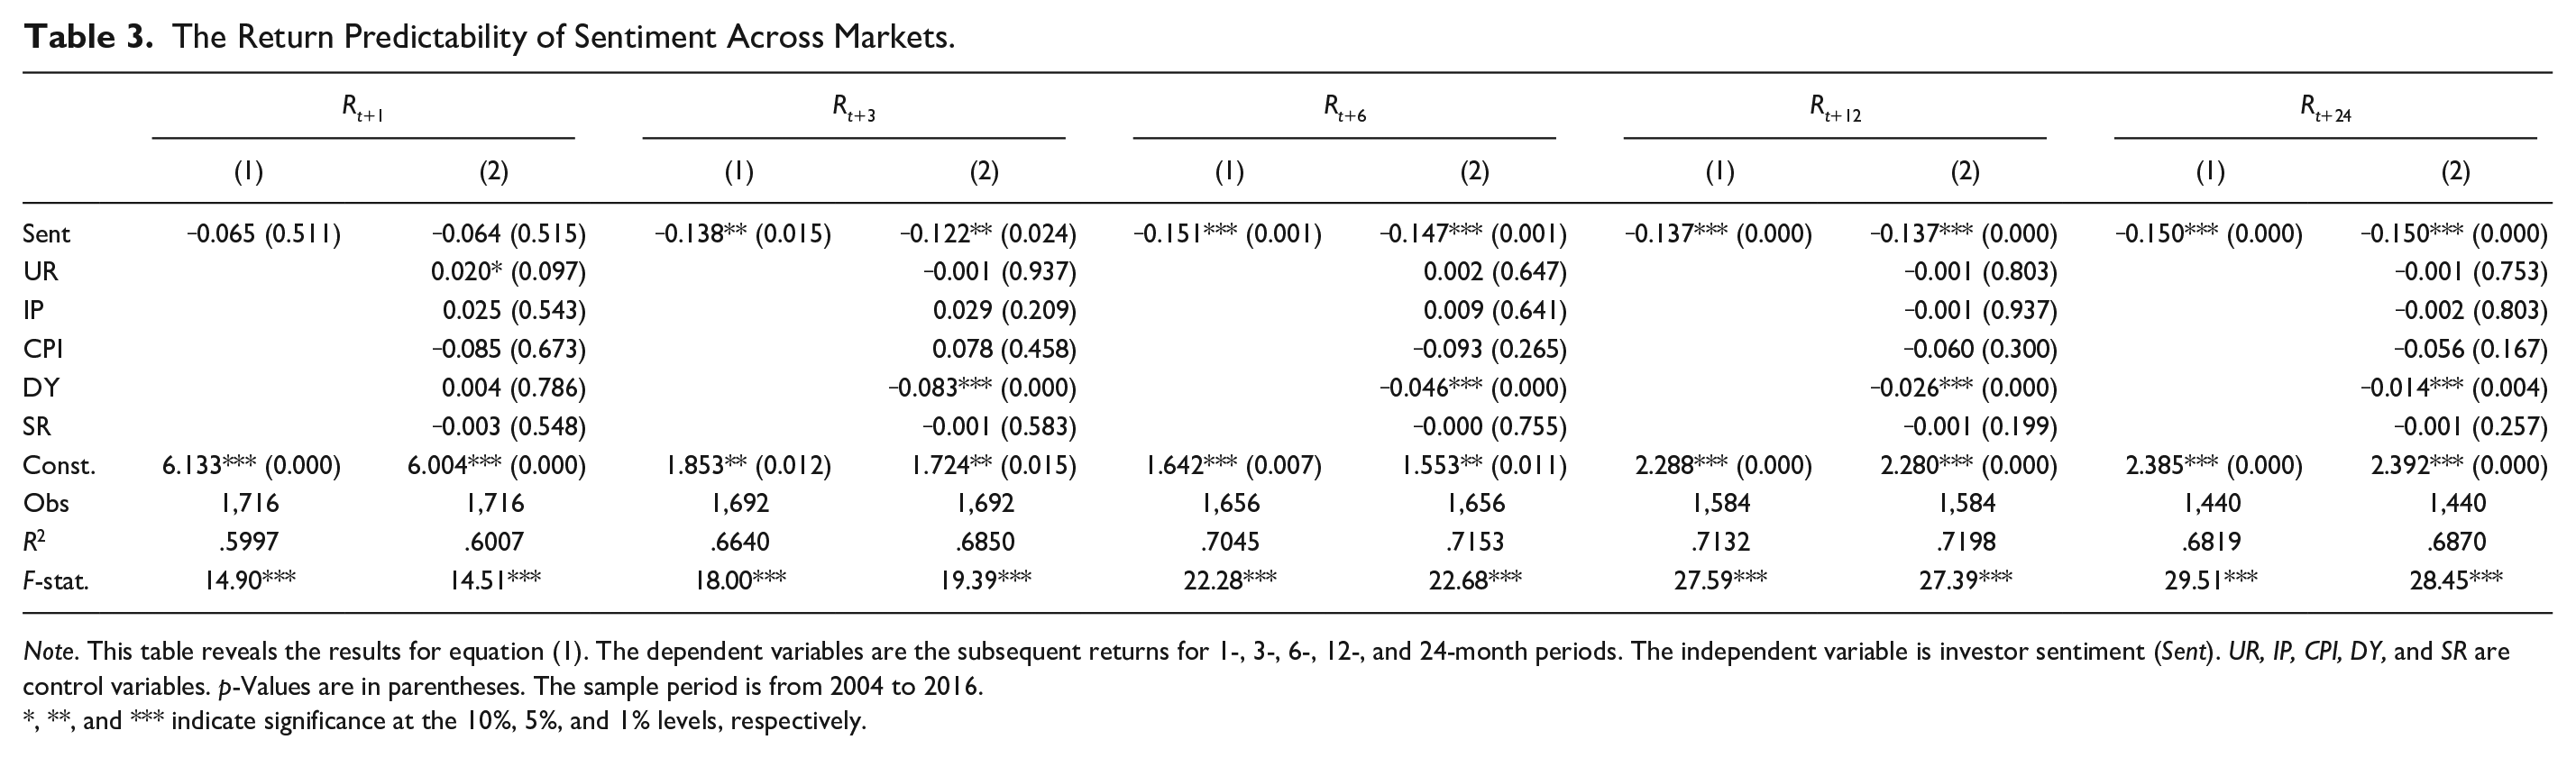
Note. This table reveals the results for equation (1). The dependent variables are the subsequent returns for 1-, 3-, 6-, 12-, and 24-month periods. The independent variable is investor sentiment (Sent). UR, IP, CPI, DY, and SR are control variables. p-Values are in parentheses. The sample period is from 2004 to 2016.
, **, and *** indicate significance at the 10%, 5%, and 1% levels, respectively.
As is shown in the table, sentiment could be an applicable indicator to predict future returns as its estimated coefficients are significantly negative over the next 3 to 24 months, confirming our first hypothesis. Our finding is in tandem with M. Baker and Wurgler (2006), Huang et al. (2015), Khan and Ahmad (2018), and Reis and Pinho (2020), who have also used sentiment indices combined from several explicit and implicit proxies. For example, Reis and Pinho (2020) constructed a new sentiment index for Europe from the consumer confidence index, the economic sentiment indicator, the volatility index, the gold bullion price, and the spread between 10- and 3-year German Treasury bond yields and investigated the return predictability of this index for the next 1- to 6-month periods. They revealed a negative relationship between the sentiment index and excess market returns for horizons from 3 to 6 months ahead.
Asia versus Europe
Apart from the total market’s results, we wonder whether the return predictability of sentiment is the same or varied between Asian and European regions. Therefore, we create and add a dummy variable for Asian markets into equation (1). The outcomes for the interaction term between sentiment and the dummy variable, that is, Sent × AS of equation (2), reported in Table 4 partly address the heterogeneities in the sentiment intensity among separate groups of markets. Specifically, the coefficients of the interaction variable are positive and opposite to the coefficients of sentiment in all periods, indicating that the sentiment impact is weaker in Asia. However, only the 6- and 12-month periods have statistically significant coefficients. Consequently, we classify our sample based on their geography and execute equation (1) for each group to achieve a more precise conclusion. The regression results for these groups are presented in Table 5.
The Sentiment-Return Relationship—Effect of Market Location.

Note. This table reveals the results for equation (2). The dependent variables are the subsequent returns for 1-, 3-, 6-, 12-, and 24-month periods. The independent variable is investor sentiment (Sent) and the interaction term between sentiment and the dummy variable for Asian markets (Sent × AS). UR, IP, CPI, DY, and SR are control variables. p-Values are in parentheses. The sample period is from 2004 to 2016.
, **, and *** indicate significance at the 10%, 5%, and 1% levels, respectively.
The Return Predictability of Sentiment: Asia Versus Europe.

Note. This table reveals the results for equation (1) when markets are divided into the Asian (AS) and European (EU) groups. The dependent variables are the subsequent returns for 1-, 3-, 6-, 12-, and 24-month periods. The independent variable is investor sentiment (Sent). UR, IP, CPI, DY, and SR are control variables. The differences between Asian and European sentiment coefficients across horizons are verified by seemingly unrelated estimations and Chow tests. p-Values are in parentheses. The sample period is from 2004 to 2016.
, **, and *** indicate significance at the 10%, 5%, and 1% levels, respectively.
As can be seen from Table 5, there is solid evidence that the correlation of investor sentiment with future market returns is divergent between Asian and European markets, supporting our third hypothesis. We find that sentiment has a more immediate impact in Europe but a more long-lasting impact in Asia. In particular, the sentiment coefficient for the next month’s returns in Asia is insignificant (coefficient = −.072, p = .609). At the same time, it is significant in Europe at the 10% confidence level (coefficient = −.242, p = .077), implying that the sentiment impact is more instantaneous in European markets. Over the next 3 to 12 months, the predictability power of sentiment in the European region continues to be greater than in the Asian one, with the largest gap between the two areas belonging to the 6-month horizon of .195 (p = .010). Nevertheless, this trend reverses on the last horizon, with the sentiment coefficient in Asian markets being −.166 (p = .000) while the figure in European markets is only −.033 and no longer significant (p = .240). Additionally, these outcomes imply that the discrepancies in sentiment impact fluctuate with the length of the forecast horizons since the two groups’ discrepancies are only statistically significant after 6 months.
Robustness checks
Our first examination exposed the significantly negative inference between sentiment and future returns. To examine the robustness of our results, we first implement another estimation method. Specifically, we re-estimate equation (1) by the instrumental variable estimation. We treat the sentiment index as a potential endogenous variable, as our panel data estimators might be affected by the endogeneity issue. The outcomes shown in Table 6 confirm our prior findings.
The Total Market—Instrumental Variable Estimation.

Note. This table reveals the instrumental variable regressions for equation (1). The dependent variables are the subsequent returns for 1-, 3-, 6-, 12-, and 24-month periods. The independent variable is investor sentiment (Sent). UR, IP, CPI, DY, and SR are control variables. p-Values are in parentheses. p-Values of the Hansen (HS) test for over-identifying restrictions are also introduced. The sample period is from 2004 to 2016.
, **, and *** indicate significance at the 10%, 5%, and 1% levels, respectively.
Also, we claimed that the return predictability of sentiment is diverse among regional markets. However, one may argue that the variations across regions in our research are grounded in the loading differences of three sentiment indicators when constructing the composite index for each market. Therefore, we replace our composite index with an equal-weighted average index of these proxies and replicate our Asian and European markets’ analysis. The results are revealed in Table 7.
Asia Versus Europe—The Equal-Weighted Average Index.

Note. This table reveals the results for equation (1) when the equal-weighted average index replaces the composite sentiment index. Each market is classified into either the Asian (AS) or European (EU) group. The dependent variables are the subsequent returns for 1-, 3-, 6-, 12-, and 24-month periods. The independent variable is investor sentiment (Sent). UR, IP, CPI, DY, and SR are control variables. The differences between Asian and European sentiment coefficients across horizons are verified by seemingly unrelated estimations and Chow tests. p-Values are in parentheses. The sample period is from 2004 to 2016.
, **, and *** indicate significance at the 10%, 5%, and 1% levels, respectively.
As is shown, our main conclusions remain unchanged as a new sentiment index is used. In general, our empirical results for sentiment impact, both in terms of regional and aggregate markets, confirm the predictive power of investor sentiment for stock returns. Nevertheless, these outcomes are highly diverse across regions, casting doubt on the potentially moderating impact of local factors on the sentiment-return nexus. We will examine this issue, that is, our second and fourth hypotheses, in the following part.
Impact of Market-Specific Factors
The total market
Table 8 displays the panel regression results for 3-, 12-, and 24-month periods when our sample markets are divided into below and above-median groups, based on 14 market-specific factors in the first column. 6
The Return Predictability of Sentiment: Below Versus Above-Median Group.

Note. This table reveals the results for equation (1) when markets are divided into below and above-median groups, based on 14 market-specific factors in the first column. The dependent variables are the subsequent returns for 3-, 12-, and 24-month periods. The independent variable is investor sentiment. UR, IP, CPI, DY, and SR are control variables. For each group, only the coefficients and p-values of the sentiment variable are reported. The differences between below and above-median groups across horizons are verified by seemingly unrelated estimations and Chow tests. p-Values are in parentheses. The sample period is from 2004 to 2016.
, **, and *** indicate significance at the 10%, 5%, and 1% levels, respectively.
The first observation from the table is that the local characteristics have a moderating effect on the relationship between sentiment and future returns, verifying the related results from earlier studies by Schmeling (2009), Wang et al. (2021), and Zouaoui et al. (2011). Nevertheless, this effect varies depending on the length of the forecast horizons. Over the next 3 months, the differences between the two groups’ estimated coefficients are significant only in one market factor: PA. Such significant differences increase to 50% in the 12-month period. In the last period, 11 local factors have a significant impact on the sentiment-return relationship. Additionally, over various horizons, three cultural dimensions, including MAS, UAI, and IVR, show no statistically significant influence at all.
Secondly, we find that financial development and institutional factors negatively affect the return predictability of sentiment, especially for long-term horizons of 1 to 2 years. In other words, the sentiment impact is weaker in markets that are more mature in terms of financial and administrative quality and vice versa. Since Chui et al. (2010) stated that a better flow of information characterizes a higher level of institutional sophistication, making the market more efficient, our empirical results are expected. Besides that, comparing the two dimensions of financial development, the moderating effect of FM is more assertive, with higher and more significant gaps between low and high-quality FM groups than the one of FI. Concerning institutional dimensions, PA and RQ are the two features that have the most substantial influence on the sentiment-return correlation. Those findings in our study explain the result of Corredor et al. (2015), who found that investor sentiment in the Central Eastern European markets (including the Czech Republic, Hungary, and Poland) is stronger than that observed in the more developed European markets (including France, Germany, and the United Kingdom), but failed to address the role of institutional factors in the sentiment-return variations across markets due to examining only three countries.
In contrast, cultural characteristics show more diverse outcomes across different dimensions and time horizons. This issue can be illustrated briefly by the case of IDV. Over 3- to 12-month periods, individualistic markets suffer more from sentiment impact than collectivistic markets. For instance, the estimated sentiment coefficients for next 12-month returns are −.234 (p = .000) and −.088 (p = .068) for individualistic and collectivistic markets, respectively. Nonetheless, in the longest horizon, the coefficients change to −.033 (p = .240) for the high IDV group and −.166 (p = .000) for the low IDV group, indicating that the sentiment effect becomes weaker in individualistic cultures. Our results support both streams of literature about the IDV dimension. The first opinion is that individuals in individualistic cultures tend to be overconfident, leading to cognitive biases, as suggested by H. K. Baker and Nofsinger (2002) and Breuer et al. (2014). On the contrary, Markus and Kitayama (1991) and Schmeling (2009) argued that people in collectivistic countries tend to connect in strong groups and overweigh consensus opinion, which results in a herd-like overreaction among investors. Hence, collectivism escalates overreaction.
PDI’s case is even more unclear as the sentiment effect is equal in the short-term period, more dominant in low PDI markets in the mid-term, and less in the long-term. Conversely, the moderating role of LTO is more vital for short-term oriented markets on a 3-month horizon but weaker on a 24-month one, while it is similar for both groups in the next 12 months. However, the gaps between low and high PDI and short-term and long-term oriented markets are significant only over the 24-month horizon.
Overall, although the cultural impact is more fragile compared to development and governance factors, those observations for IDV, PDI, and LTO dimensions explain our prior finding that sentiment has a more immediate impact in Europe (individualistic, low PDI, and short-term oriented markets) but a more long-lasting impact in Asia (collectivistic, high PDI, and long-term oriented markets).
Finally, we run equation (3), which has the interaction variables between sentiment and the local features, to confirm our prior findings. The outcomes shown in Table 9 verify our observation of the moderating effect of market characteristics on the sentiment-return inference. The exceptions relate to VA, MAS, UAI, and IVR. While the variations between low and high VA groups are significant in the 24-month period, there are no significant interaction variables between sentiment and VA for all forecast horizons. Conversely, the interaction coefficients prove the significant influence of MAS, UAI, and IVR on the sentiment-return correlation. Nevertheless, the differences between low and high MAS, UAI, and IVR markets are not statistically significant, as mentioned before.
Impact of Market-Specific Factors on the Sentiment-Return Relationship.

Note. This table reveals the results for equation (3). The dependent variables are the subsequent returns for 1-, 3-, 6-, 12-, and 24-month periods. The independent variables are investor sentiment (Sent) and the interaction terms between sentiment and market-specific factors. UR, IP, CPI, DY, and SR are control variables. Only the coefficients and p-values for sentiment and the interaction variables are reported. The sample period is from 2004 to 2016.
, **, and *** indicate significance at the 10%, 5%, and 1% levels, respectively.
Asia versus Europe
In this part, we discover whether the local impact on the sentiment-return correlation differs between Asia and Europe by pooling our sample into two regional groups and executing equation (3) for each of them. The estimated coefficients of the sentiment-factor interaction variables and their dissimilarities for the next 3, 12, and 24 months are presented in Table 10.
The Moderating Effect of Market-Specific Factors: Asia Versus Europe.
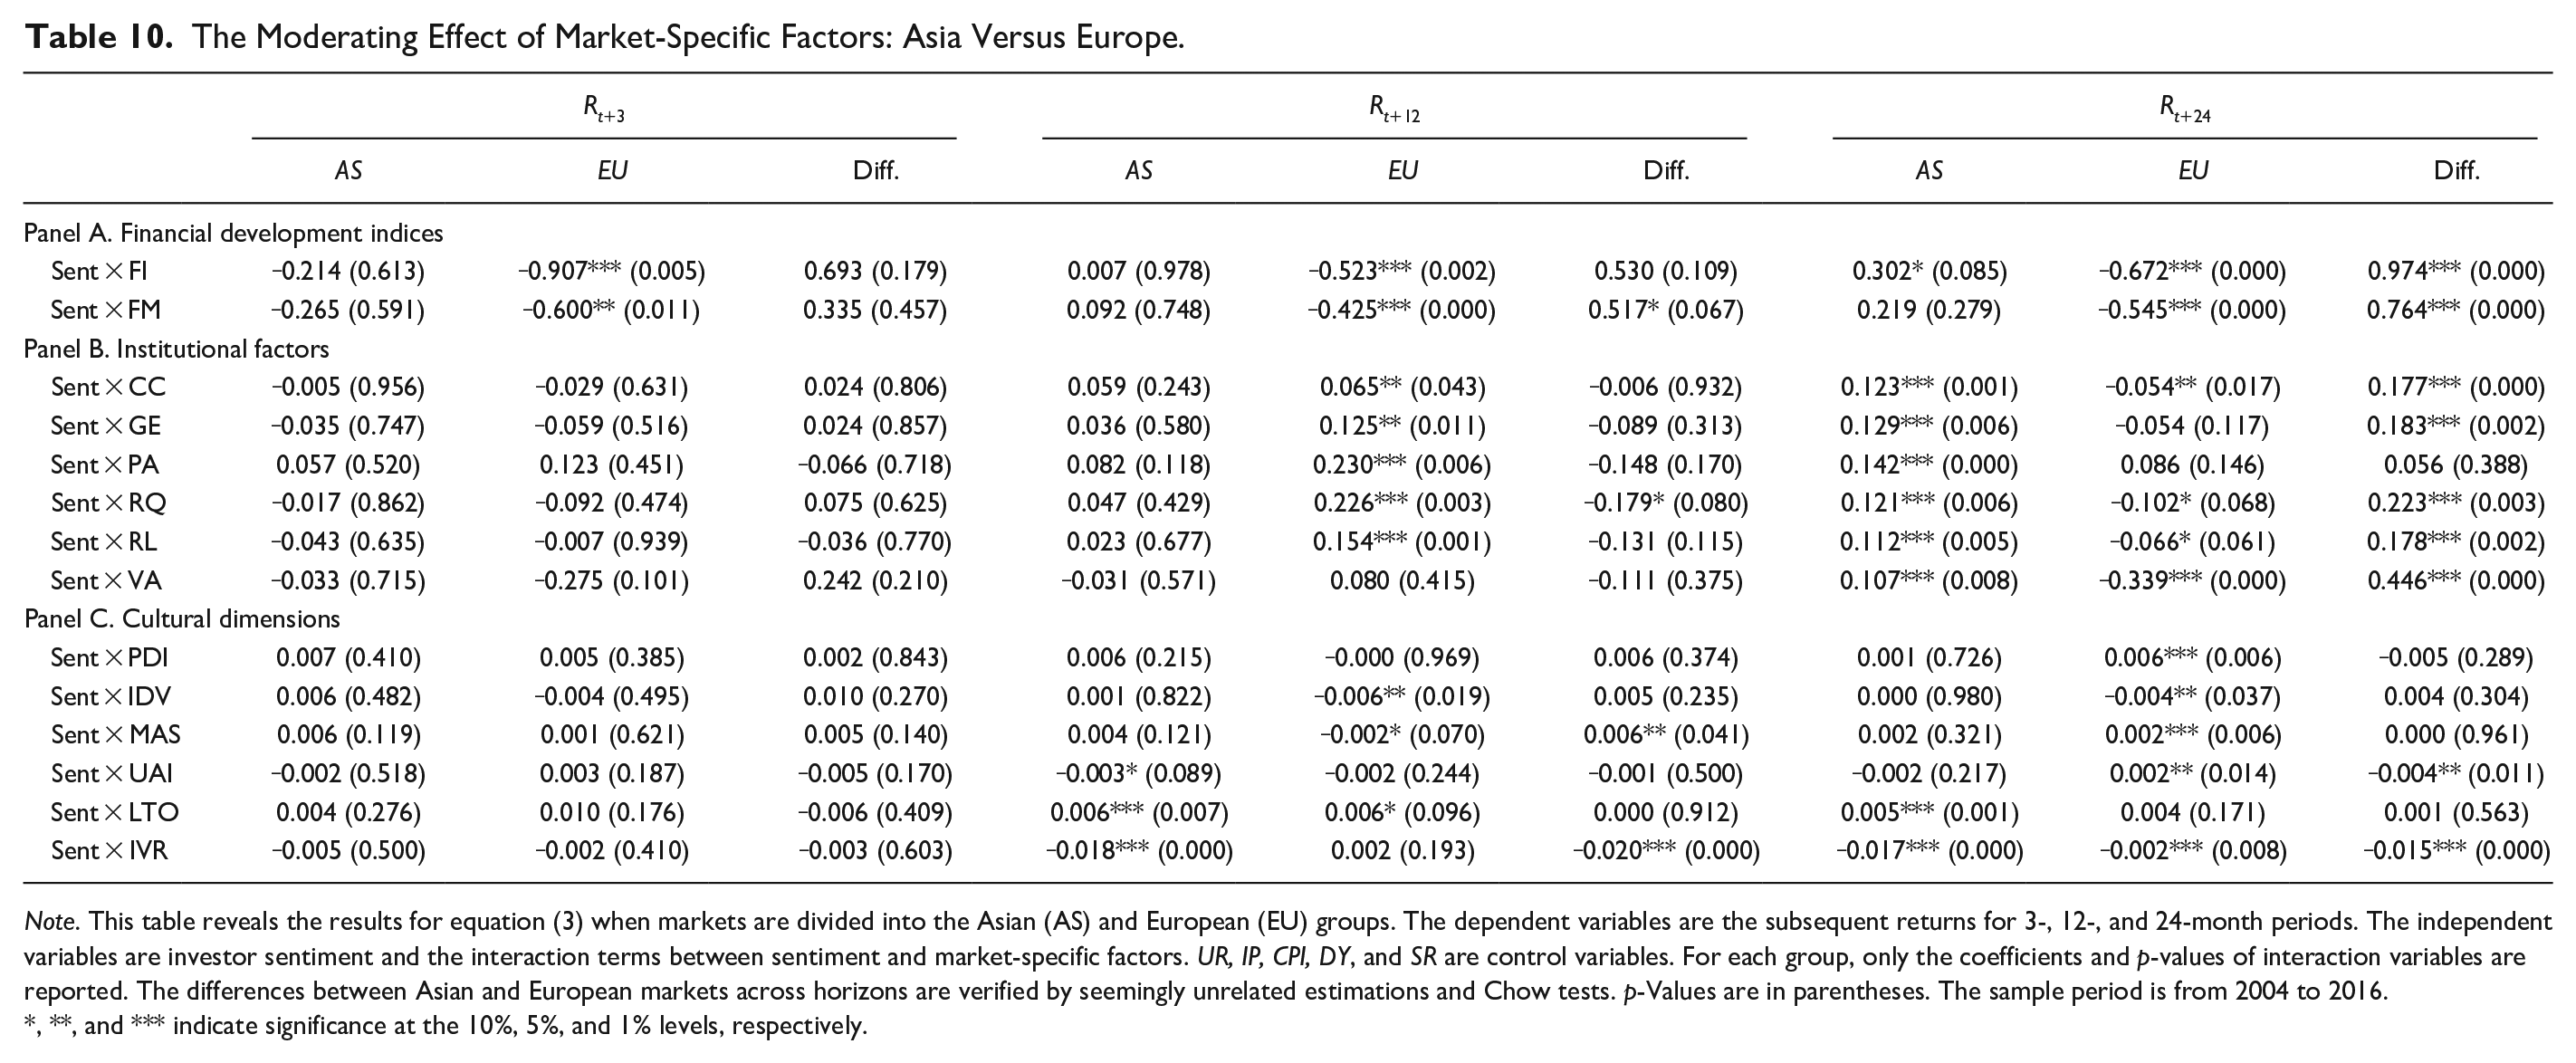
Note. This table reveals the results for equation (3) when markets are divided into the Asian (AS) and European (EU) groups. The dependent variables are the subsequent returns for 3-, 12-, and 24-month periods. The independent variables are investor sentiment and the interaction terms between sentiment and market-specific factors. UR, IP, CPI, DY, and SR are control variables. For each group, only the coefficients and p-values of interaction variables are reported. The differences between Asian and European markets across horizons are verified by seemingly unrelated estimations and Chow tests. p-Values are in parentheses. The sample period is from 2004 to 2016.
, **, and *** indicate significance at the 10%, 5%, and 1% levels, respectively.
What can be seen in the table is the inconclusive outcomes when we compare the Asian and European markets. Regarding development factors, while FI and FM negatively affect the return predictability of sentiment in Europe, the moderating influence of these two factors turns positive in Asia after 1 year. We observe a similar tendency for institutional characteristics, especially in the last horizon. At the 24-month horizon, five out of six governance factors have a vigorously positive impact in Asian markets but a slightly negative impact in European ones, except VA, whose effect is more substantial in Europe. PA is the only element that shows a positive effect in both groups. Concerning cultural aspects, since their impact on the sentiment-return correlation is frail, as stated in the last part, we do not observe great variations in the moderating effect of culture between Asian and European markets. The biggest gaps belong to IVR with −.020 (p = .000) and −.015 (p = .000) for the 12- and 24-month horizons, respectively.
Overall, our results indicate that financial development has a stronger moderating effect in Europe than in Asia, which seems to suffer more from institutional quality. The cultural impact, in contrast, is mixed. More importantly, over time, the local influences on these two regions also tend to change in sign and magnitude, explaining the above-mentioned variations in the sentiment intensity between Asian and European markets. We verify our inferences by the outcomes of equation (4) shown in Table 11.
Impact of Local Factors on the Sentiment-Return Nexus: Asia Versus Europe.

Note. This table reveals the results for equation (4). The dependent variables are the subsequent returns for 1-, 3-, 6-, 12-, and 24-month periods. The independent variables are investor sentiment and the interaction terms between sentiment, market-specific factors, and the dummy variable for Asian markets. UR, IP, CPI, DY, and SR are control variables. Only the coefficients and p-values of sentiment and the interaction variables are reported. The sample period is from 2004 to 2016.
, **, and *** indicate significance at the 10%, 5%, and 1% levels, respectively.
Conclusion
The paper investigates the return predictability of investor sentiment in 12 Asian and European markets from January 2004 to December 2016 using a composite sentiment index constructed from three indicators: CCI, ADR, and VP. Our empirical results confirm the negative relationship between sentiment and subsequent returns over various forecast horizons reported in the previous research of Aissia (2016), M. Baker et al. (2012), Khan and Ahmad (2018), and Schmeling (2009). More importantly, by separating our sample into separate groups, this study, to the best of our knowledge, is the first to compare the variations in sentiment impact across regions and detect that sentiment has a shorter-term impact in Europe but a longer-term impact in Asia.
The divergences between regional markets raise a question about the role of market-specific factors in modifying the sentiment-return relationship. By employing a comprehensive set of 14 local elements, we discover that the distinct levels of financial development and governance environment, along with cultural dimensions, could explain the sentiment-return variations across regions, though with mixed success. Since the impacts of financial and institutional factors are similar as they negatively affect the return predictability of sentiment, building a better market system appears to be a viable option for mitigating the sentiment effect on stock returns. The cultural impact, however, is inconclusive and weaker than the others.
Lastly, we reveal that the sentiment-return relationship tends to suffer more from the driving force of financial development in European markets while being more vulnerable to institutional factors in Asian ones. Notably, the local impacts are distinguishable between each factor and between each predicted horizon, which might play a critical role in the sentiment-return diversifications between these two areas.
In general, our findings imply that the results of the sentiment-return relationship observed in one specific market or region should not be extended to other markets and regions without considering their market structures and cultural aspects. This study, therefore, provides useful information not only for academic researchers but also for investors who want to diversify their investment portfolio with foreign stocks and earn profits from price shocks caused by herding behaviors. An unresolved issue in our research is whether the moderating effect of market factors on the sentiment-return nexus still holds when stocks are divided into various categories based on their characteristics, such as small versus big, or growth versus value. This issue emerges from previous studies which have stated that stocks with distinctive characteristics are also influenced by investor sentiment to different degrees (M. Baker & Wurgler, 2006; Zouaoui et al., 2011). Besides that, since Chelley-Steeley et al. (2019), DeVault et al. (2019), and Wang and Duxbury (2021) have confirmed that institutional investors are also prone to behavioral bias, that is, they are also sentiment traders, a study about the effect of market factors on the relationship between institutional investor sentiment and stock returns, compared to our findings on retail investor sentiment, is also appealing. We will leave these issues for future work.
Footnotes
Appendix A
Description of Variables Used in This Study.

| Variables | Symbols | Descriptions/measurements | Data sources | Theoretical foundations |
|---|---|---|---|---|
| Panel A. Dependent variable | ||||
| Market returns | R | Change in the natural logarithm of the end-of-month price index. | Datastream | Gizelis and Chowdhury (2016) and Smales (2017) |
| Panel B. Independent variable | ||||
| B1. Component proxies | ||||
| Consumer confidence index | CCI | Direct surveys of residents’ and households’ opinions on their expected consumption and savings. | Data sources for CCI are presented in Appendix B | Corredor et al. (2015), Grigaliūnienė and Cibulskienė (2010), and Shi et al. (2022) |
| Advance/decline ratio | ADR | The number of rising stocks is divided by the number of falling stocks during a month. | Datastream | Brown and Cliff (2004), Dash and Maitra (2018), and Liu et al. (2020) |
| Volatility premium | VP | The log of the average market-to-book ratios between high (the top 30%) and low (the bottom 30%) volatility stocks after being sorted by their standard deviation from the previous year. | Datastream | M. Baker et al. (2012) and Rashid et al. (2019) |
| B2. Composite index | ||||
| Sentiment index | Sent | The first principal component of CCI, ADR, and VP. | M. Baker and Wurgler (2006), Khan and Ahmad (2018), and Reis and Pinho (2020) | |
| Panel C. Moderating variables | ||||
| C1. Financial development | ||||
| Financial institutions | FI | Scores for each country are calculated based on the depth, access, and efficiency of its financial markets and institutions. | Financial Development Index (International Monetary Fund) | Aggarwal et al. (2005) and Fernandes et al. (2010) |
| Financial markets | FM | |||
| C2. Institutional qualities | ||||
| Voice and accountability | VA | Scores for each country are calculated based on more than thirty underlying data sources. | Worldwide Governance Indicators (World Bank) | Corredor et al. (2013) and Schmeling (2009) |
| Political stability and absence of violence | PA | |||
| Government effectiveness | GE | |||
| Regulatory quality | RQ | |||
| Rule of law | RL | |||
| Control of corruption | CC | |||
| C3. Culture | ||||
| Power distance index | PDI | Scores for each country are calculated based on Professor Geert Hofstede’s study about the cultural impact on values in the workplace. | Hofstede Insights’ website | Hofstede (1980), Markus and Kitayama (1991), and Zouaoui et al. (2011) |
| Individualism vs. collectivism | IDV | |||
| Masculinity vs. femininity | MAS | |||
| Uncertainty avoidance index | UAI | |||
| Long-term vs. short-term orientation | LTO | |||
| Indulgence vs. restraint | IVR | |||
| Panel D. Control variables | ||||
| Unemployment rate | UR | The percentage change in the unemployment rate. | Datastream | Rashid et al. (2019), Smales (2017), Subeniotis et al. (2011), and Verma and Verma (2008) |
| Industrial production index | IP | The percentage change in the industrial production index. | ||
| Consumer price index | CPI | The percentage change in the consumer price index. | ||
| Dividend yield | DY | The percentage change in the dividend yield of the main stock market index. | ||
| Short-term interest rate | SR | The percentage change in the 3-month interbank rate. | ||
Note. This table presents data sources and descriptions for all variables used in this study. Theoretical foundations for choosing these variables are also introduced. Quarterly series are converted to monthly series by applying the cubic spline interpolation method.
Appendix B
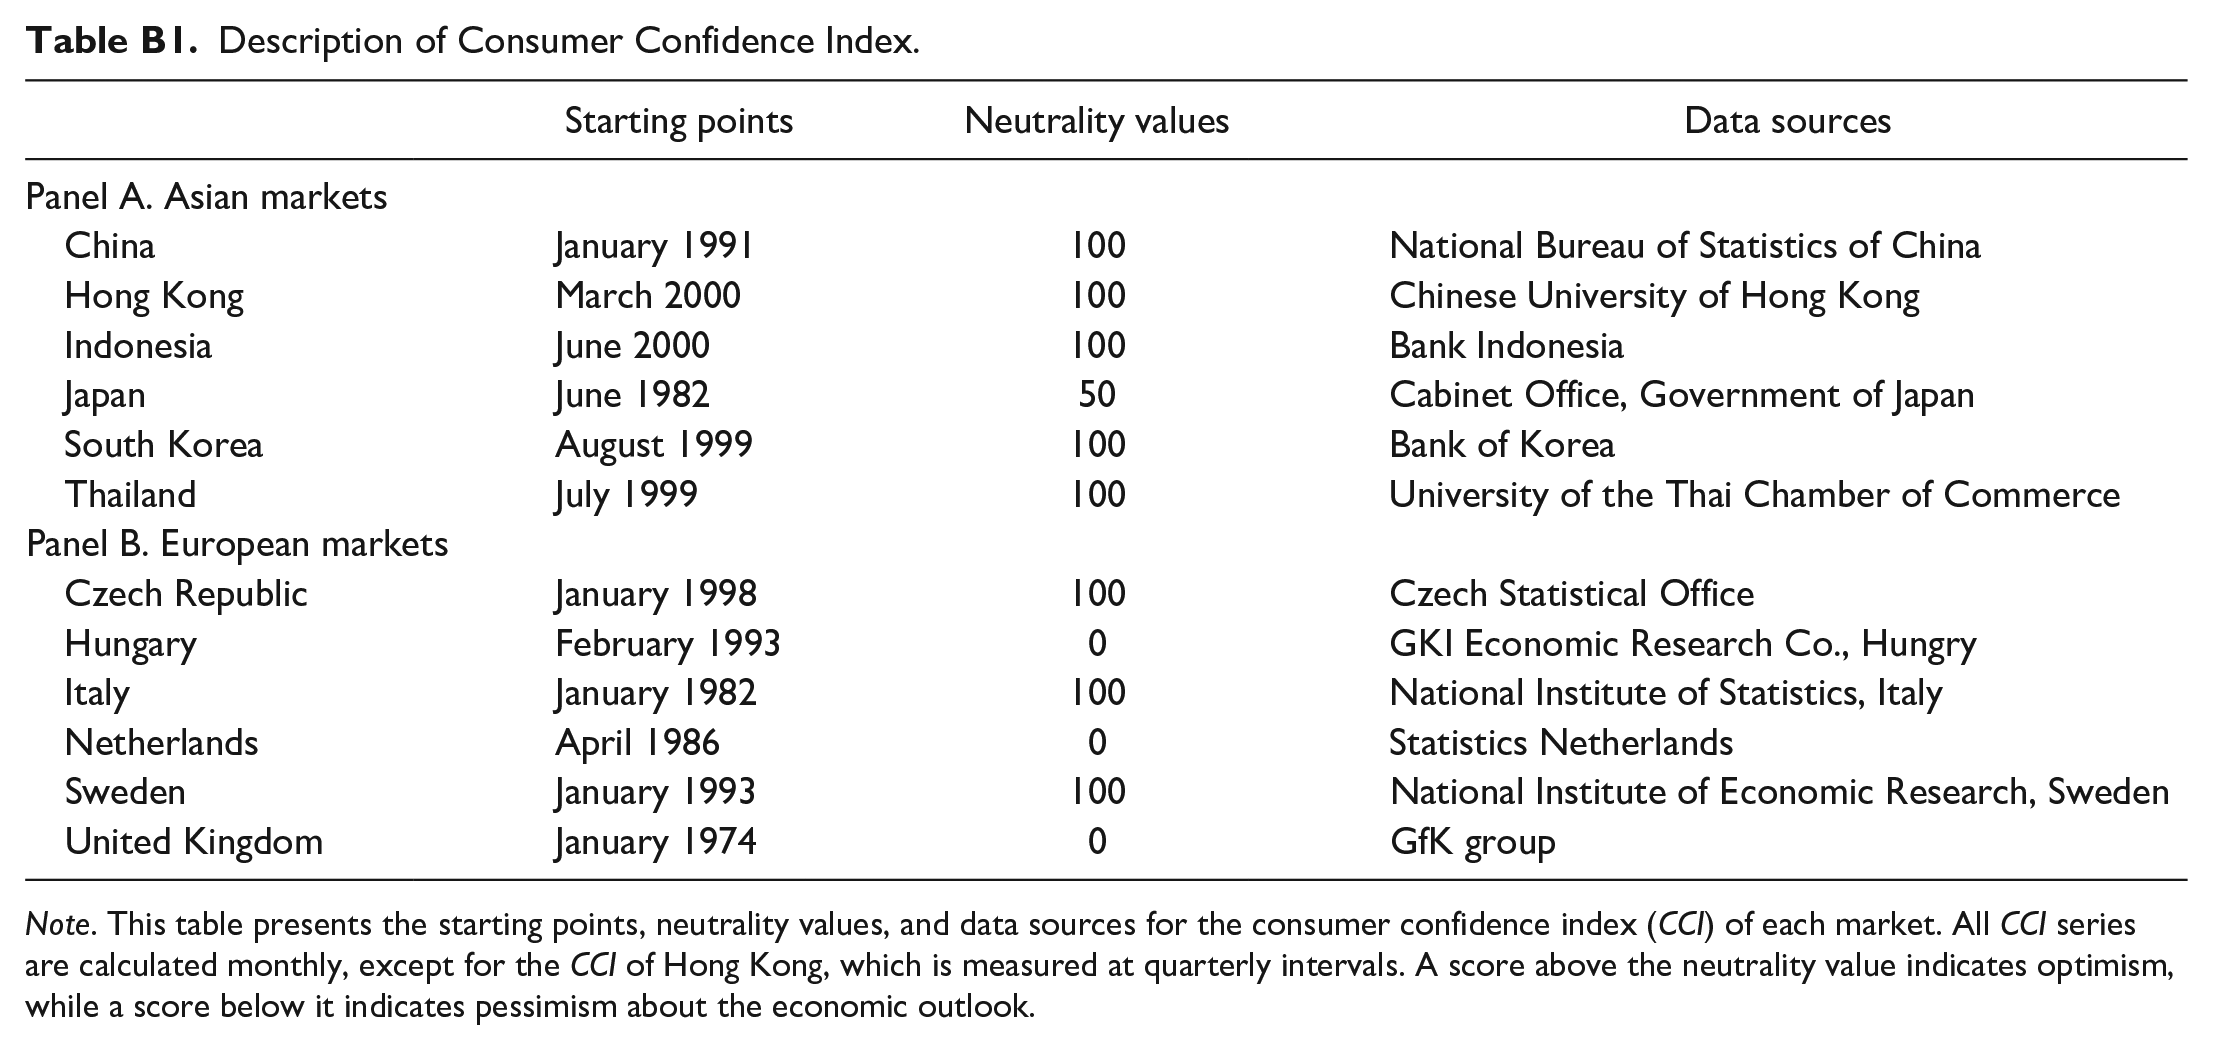
Description of Consumer Confidence Index.
| Starting points | Neutrality values | Data sources | |
|---|---|---|---|
| Panel A. Asian markets | |||
| China | January 1991 | 100 | National Bureau of Statistics of China |
| Hong Kong | March 2000 | 100 | Chinese University of Hong Kong |
| Indonesia | June 2000 | 100 | Bank Indonesia |
| Japan | June 1982 | 50 | Cabinet Office, Government of Japan |
| South Korea | August 1999 | 100 | Bank of Korea |
| Thailand | July 1999 | 100 | University of the Thai Chamber of Commerce |
| Panel B. European markets | |||
| Czech Republic | January 1998 | 100 | Czech Statistical Office |
| Hungary | February 1993 | 0 | GKI Economic Research Co., Hungry |
| Italy | January 1982 | 100 | National Institute of Statistics, Italy |
| Netherlands | April 1986 | 0 | Statistics Netherlands |
| Sweden | January 1993 | 100 | National Institute of Economic Research, Sweden |
| United Kingdom | January 1974 | 0 | GfK group |
Note. This table presents the starting points, neutrality values, and data sources for the consumer confidence index (CCI) of each market. All CCI series are calculated monthly, except for the CCI of Hong Kong, which is measured at quarterly intervals. A score above the neutrality value indicates optimism, while a score below it indicates pessimism about the economic outlook.
Appendix C
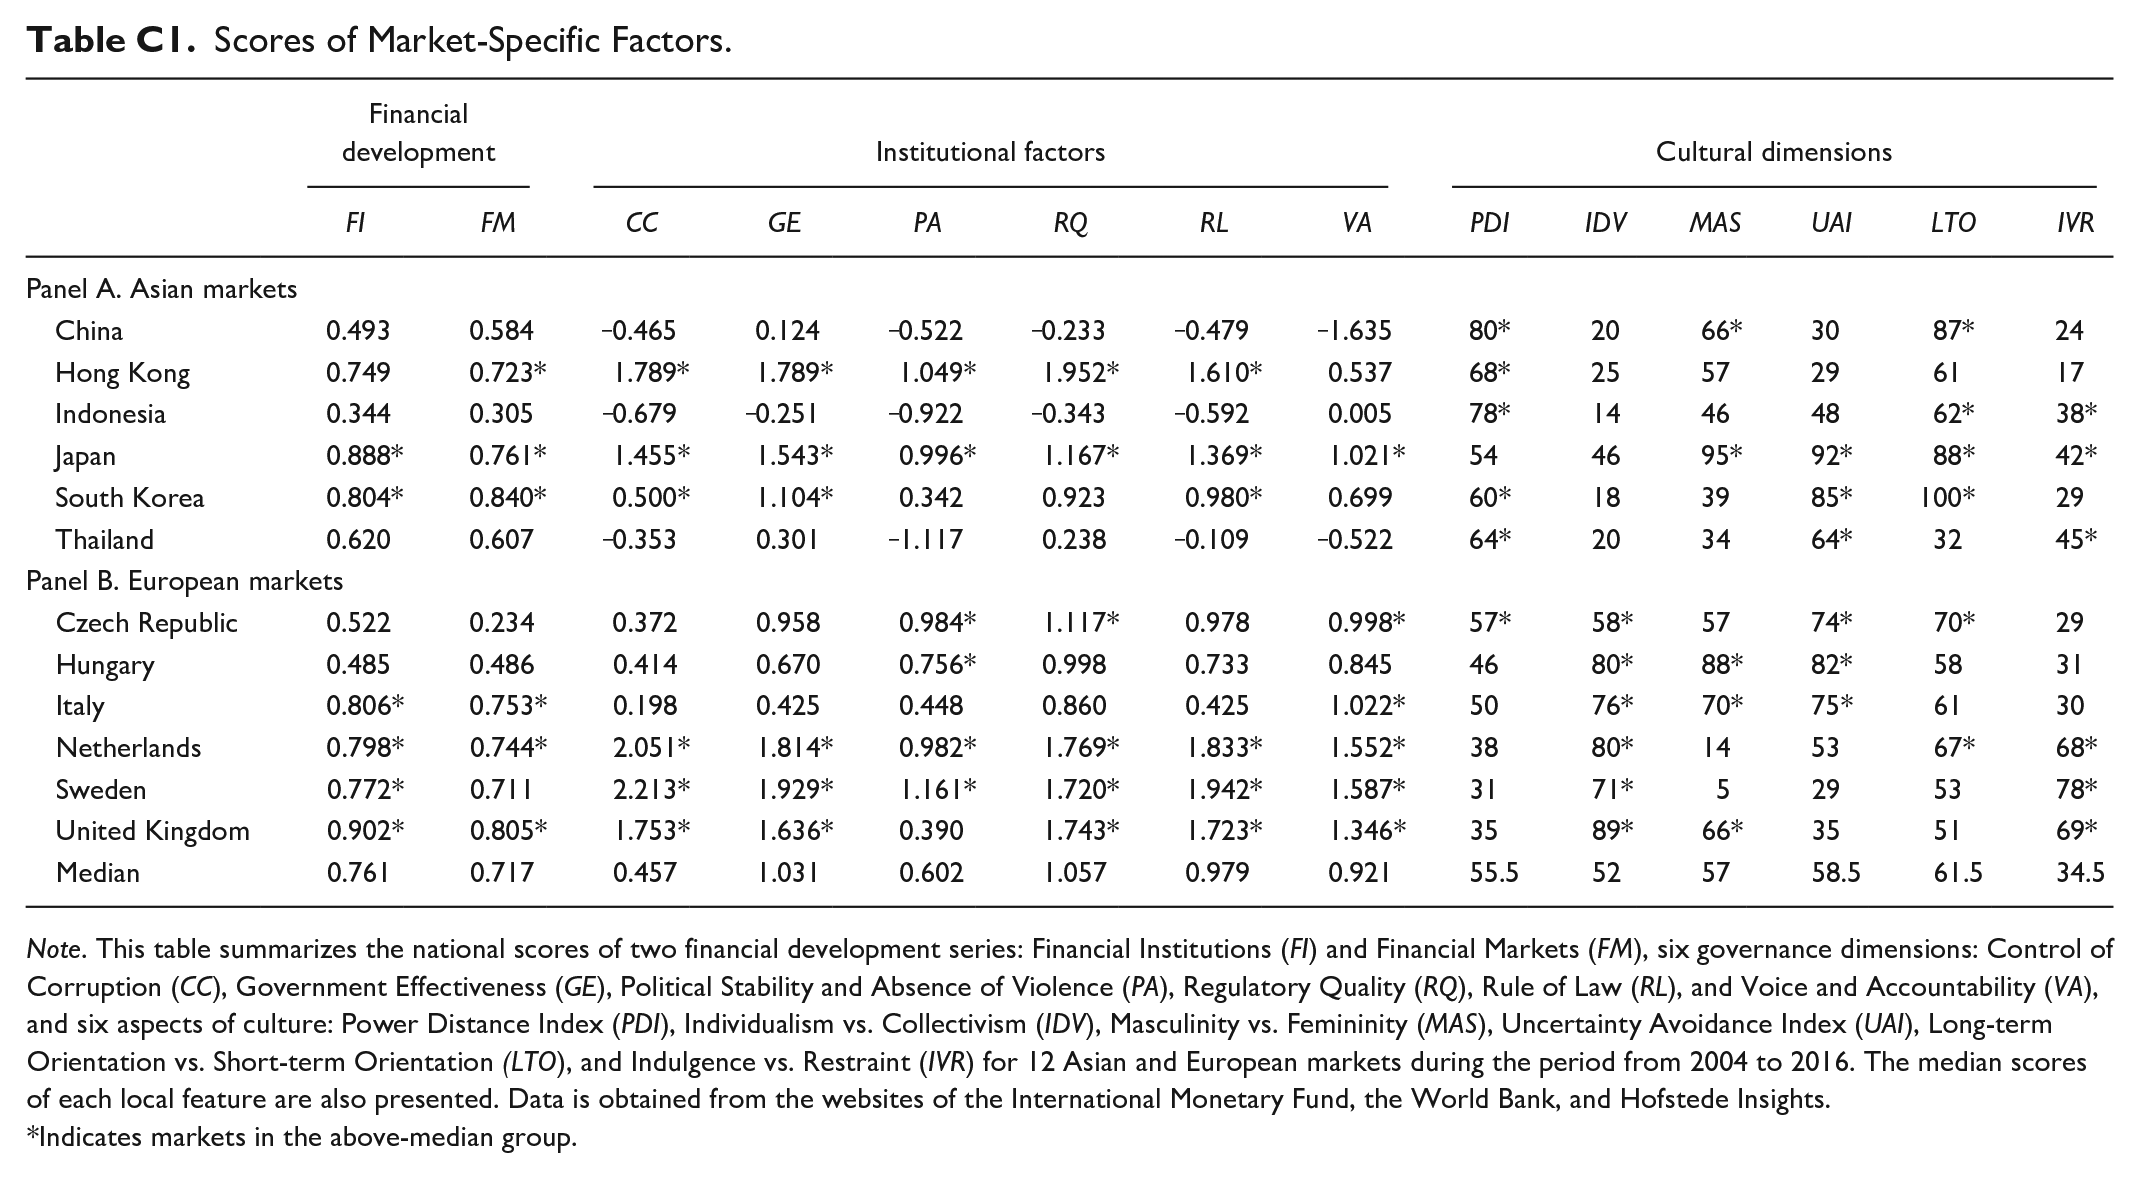
Scores of Market-Specific Factors.
| Financial development | Institutional factors | Cultural dimensions | ||||||||||||
|---|---|---|---|---|---|---|---|---|---|---|---|---|---|---|
| FI | FM | CC | GE | PA | RQ | RL | VA | PDI | IDV | MAS | UAI | LTO | IVR | |
| Panel A. Asian markets | ||||||||||||||
| China | 0.493 | 0.584 | ‒0.465 | 0.124 | ‒0.522 | ‒0.233 | ‒0.479 | ‒1.635 | 80* | 20 | 66* | 30 | 87* | 24 |
| Hong Kong | 0.749 | 0.723* | 1.789* | 1.789* | 1.049* | 1.952* | 1.610* | 0.537 | 68* | 25 | 57 | 29 | 61 | 17 |
| Indonesia | 0.344 | 0.305 | ‒0.679 | ‒0.251 | ‒0.922 | ‒0.343 | ‒0.592 | 0.005 | 78* | 14 | 46 | 48 | 62* | 38* |
| Japan | 0.888* | 0.761* | 1.455* | 1.543* | 0.996* | 1.167* | 1.369* | 1.021* | 54 | 46 | 95* | 92* | 88* | 42* |
| South Korea | 0.804* | 0.840* | 0.500* | 1.104* | 0.342 | 0.923 | 0.980* | 0.699 | 60* | 18 | 39 | 85* | 100* | 29 |
| Thailand | 0.620 | 0.607 | ‒0.353 | 0.301 | ‒1.117 | 0.238 | ‒0.109 | ‒0.522 | 64* | 20 | 34 | 64* | 32 | 45* |
| Panel B. European markets | ||||||||||||||
| Czech Republic | 0.522 | 0.234 | 0.372 | 0.958 | 0.984* | 1.117* | 0.978 | 0.998* | 57* | 58* | 57 | 74* | 70* | 29 |
| Hungary | 0.485 | 0.486 | 0.414 | 0.670 | 0.756* | 0.998 | 0.733 | 0.845 | 46 | 80* | 88* | 82* | 58 | 31 |
| Italy | 0.806* | 0.753* | 0.198 | 0.425 | 0.448 | 0.860 | 0.425 | 1.022* | 50 | 76* | 70* | 75* | 61 | 30 |
| Netherlands | 0.798* | 0.744* | 2.051* | 1.814* | 0.982* | 1.769* | 1.833* | 1.552* | 38 | 80* | 14 | 53 | 67* | 68* |
| Sweden | 0.772* | 0.711 | 2.213* | 1.929* | 1.161* | 1.720* | 1.942* | 1.587* | 31 | 71* | 5 | 29 | 53 | 78* |
| United Kingdom | 0.902* | 0.805* | 1.753* | 1.636* | 0.390 | 1.743* | 1.723* | 1.346* | 35 | 89* | 66* | 35 | 51 | 69* |
| Median | 0.761 | 0.717 | 0.457 | 1.031 | 0.602 | 1.057 | 0.979 | 0.921 | 55.5 | 52 | 57 | 58.5 | 61.5 | 34.5 |
Note. This table summarizes the national scores of two financial development series: Financial Institutions (FI) and Financial Markets (FM), six governance dimensions: Control of Corruption (CC), Government Effectiveness (GE), Political Stability and Absence of Violence (PA), Regulatory Quality (RQ), Rule of Law (RL), and Voice and Accountability (VA), and six aspects of culture: Power Distance Index (PDI), Individualism vs. Collectivism (IDV), Masculinity vs. Femininity (MAS), Uncertainty Avoidance Index (UAI), Long-term Orientation vs. Short-term Orientation (LTO), and Indulgence vs. Restraint (IVR) for 12 Asian and European markets during the period from 2004 to 2016. The median scores of each local feature are also presented. Data is obtained from the websites of the International Monetary Fund, the World Bank, and Hofstede Insights.
Indicates markets in the above-median group.
Acknowledgements
Declaration of Conflicting Interests
The author(s) declared no potential conflicts of interest with respect to the research, authorship, and/or publication of this article.
Funding
The author(s) received no financial support for the research, authorship, and/or publication of this article.