
Abstract
After Bitcoin futures were introduced by the Chicago Mercantile Exchange in December 2017, their trading volume has stayed in an uptrend due to speculation, though the scale is still small compared to other traditional futures. As increasing trading indicates more attention and the presence of institutional traders, there exists a need for reliable return and variance forecasts of Bitcoin futures contracts. Therefore, this paper first applies LASSO to pick out best-fitting predictors by shrinking the dimension of a universe of potential determinants sourced from intraday Bitcoin spot trades and daily futures variables. Then, a second round of predictor selection is conducted via Bayesian model averaging so that the modeling uncertainty can be mitigated. We find that factors standing out from this two-step procedure possess a strong predictive power for Bitcoin futures return and volatility in different time horizons. It is further demonstrated that the investment and hedging strategies established based on our forecasts perform well in out-of-sample validations.
Keywords
Introduction
Futures provides price discovery and risk hedging capabilities in the cryptocurrency ecosystem. Therefore, it is essential that investors explore potential drivers of risk and return in crypto futures to promote participation in this market. However, speculating on the cryptocurrency’s future price can be hindered by a lack of regulation or predictability. While large commodity exchanges introduced standardized crypto contracts, most people still consider investment in them risky as the underlying cryptocurrency is known for its volatile price swings. This highlights the importance of motivating crypto futures players to construct practical strategies based on spot and futures market factors.
One key source of futures predictors is intraday high-frequency trading statistics. And Bitcoin serves as an ideal laboratory given its high data availability degree on both the time and contract variety dimensions. Being the leading cryptocurrency, Bitcoin features high-return potential and high-risk investment on a stand-alone basis (Corbet et al., 2019) and complex linkages with mainstream financial markets (Qarni et al., 2019). Moreover, due to increasing speculation, it has gradually become one of the most frequently traded commodities around the world with a sizable market capitalization. Since investment professionals view Bitcoin more like a speculative instrument rather than a currency (Yermack, 2015), the goal is to harness its price growth or hedge against its price fluctuations. But there exist surprisingly few breakthroughs on how to attain this goal with Bitcoin derivatives, let alone studies exploring the performance predictability of such derivative products based on their historical prices and underlying spot market implications. This article thus focuses on predicting the return-risk profile of Bitcoin futures investment out-of-sample by resorting to machine learning (ML) approaches.
The institutional involvement in Bitcoin futures markets is prompted by the SEC’s classification of Bitcoin as one type of commodity, which sets a milestone for the trend of developing corresponding trading venues (Matsui & Gudgeon, 2020). In December 2017, futures contracts on Bitcoins were commenced firstly on the Chicago Mercantile Exchange (CME), and then on the Chicago Board Options Exchange (CBOE). While CBOE has ceased listing Bitcoin futures on June 19th, 2019, the Intercontinental Exchange follows up by announcing its physically-settled monthly futures contract for Bitcoin held in the Bakkt Warehouse. The introduction of Bitcoin futures has fundamentally changed the Bitcoin spot markets as documented by a growing body of research (Akyildirim et al., 2020; Deniz & Stengos 2020; Vidal-Tomás et al., 2021). Shi and Shi (2019) study the consequences of banning Bitcoin futures by the Korean Government. Our paper adds to this literature by emphasizing how the information contained in Bitcoin futures can shape its future prices both directly within the futures market and indirectly via spillovers into the spot market routing back. Nevertheless, as there have been clear disruptions of the trading price and volume in the distributional characteristics of Bitcoin returns upon the introduction of futures, and as Bitcoin spot market indicators constitute a crucial part of our pool of candidate predictors for Bitcoin futures returns, in the present paper we only examine spot Bitcoin data with sample period starting from the existence of those futures contracts.
In the field of Bitcoin spot price prediction, besides traditional econometric techniques (e.g., Blau, 2017; Krištoufek, 2015; Zhang and Mani, 2021; Zhu et al., 2021), statistical learning emerges to be favored by forecasting experts with the development of Bayesian models (Jang & Lee, 2018; Poyser, 2019) and ML techniques such as artificial neural networks (ANN), and support vector machine (SVM), and Ensemble (Mallqui & Fernandes, 2019; Sun et al., 2020) that can be assembled to produce stronger predictive power and achieve higher target precision. However, it would still be difficult to economically interpret the results as these tools resemble a black box. In other words, the model tells us nothing about how and why certain factors possess the greatest predictive power. Indeed, while we could always use ANN to acknowledge multilayer features or employ SVM to handle high-dimensional data, interpretability is compromised. This is hence not the optimal strategy because, in technical prediction exercises, there are possible gains in constructing as many predictors as possible. Therefore, intending to start with the largest possible set of potential factors and implement more interpretable regularization techniques, we follow Panagiotidis et al. (2018), Huang and Gao (2022), and Shahzad et al. (2022) by choosing the Least Absolute Shrinkage and Selection Operator (LASSO) to undertake a pre-selection of variables with the most powerful predictability for Bitcoin futures market outcomes, thus decreasing the number of inputs into that black box. Moreover, LASSO keeps a linear relationship between the factors and the forecasted estimates, which is much easier to explain than nonlinearities. In summary, one can reduce the dimension of the predictors’ pool and select the predictors with the greatest predictive power via LASSO. Yet, the model uncertainty issue emerges in our case. That is, one does not know which LASSO-selected predictors will cause serious modeling errors. We then move on to utilize Bayesian model averaging (BMA) from the Bayesian family of ML algorithms to further tackle this problem. The bottom line is that given the power of these novel predictive tools and given the informational role played by futures markets, no prior research has applied them to the Bitcoin futures market, and our paper aims at bridging this gap.
Given the above being said, this paper proposes a two-step approach for selecting predictors to foreshadow Bitcoin futures returns and the associated fluctuations. In the first step, we apply LASSO to select predictors with the most powerful predictability in forecasting returns and volatility of Bitcoin futures contracts. After lesser predictors are removed and the dimension of predicting base is reduced, in the second step, we rely on LASSO-selected predictors and BMA to conduct another round of predictor selection. In the last step, we find that the variables gone through those two steps are statistically significant in predicting the performance of Bitcoin futures. This finding provides evidence that our proposed approach serves as a valid predictor selection procedure for Bitcoin futures price changes. Eventually, insights and guidelines would be offered for building structural models to explain the underlying Bitcoin futures price movements.
The rest of this paper is organized as follows. Section 1 reviews the relevant literature. Section 2 outlines the empirical method, and Section 3 describes the data based on which a list of potential predictors is constructed. Section 4 explores the actual predictability of variables that stand out, both in foreshadowing Bitcoin futures returns and volatilities; and discusses the investing and hedging applications.
Literature Review
Our paper is related to at least four strands of recent literature. The first one centers around forecasting Bitcoin spot return and volatility with both traditional models, such as Bayesian, logistic, quantiles-based linear regression, etc. (Balcilar et al., 2017; Bouri et al. 2021; Sahoo et al., 2019; Sahoo, 2020), as well as statistical learning methods including deep learning, reinforcement learning, SVM, ANN, decision tree, and clustering (Khedr et al., 2020, provide an extensive review of these advanced tools’ effectiveness). In addition, many scholars consider the role played by novel indicators and exogenous shocks (Walther et al., 2019). For example, Bouri and Gupta (2021) rely on uncertainty measures to predict Bitcoin returns. Bouri et al. (2020) and Plakandaras et al. (2021) investigate the role of China-U.S. trade war, while Sahoo (2021) and Yousaf and Ali (2020b, 2021) the impact of the COVID-19 pandemic. Yousaf et al. (2021) examine the effect of cyber-attack risks on information herding in the cryptocurrency space. But whether ML methods can foreshadow Bitcoin futures returns and volatility remains unanswered. Moreover, how this forecastability on future contracts varies according to structural changes in Bitcoin price level and its tendency is also an open question.
Secondly, many scholars draw attention to the importance of the Bitcoin futures market with respect to the informational role. Baur and Dimpfl (2019), Aleti and Mizrach (2020), Entrop et al. (2020), Fassas et al. (2020), and Hu et al. (2020) all provide evidence that futures facilitate Bitcoin spot price discovery, though this function may depend on contracts and exchanges. Alexander and Heck (2020), Alexander et al. (2020), and Nimmagadda and Sasanka (2021) demonstrate that Bitcoin and Ether swaps and futures traded on the unregulated exchanges are the strongest instruments for cryptocurrency price recovery. Hung et al. (2021) find that Speculators exert a positive (negative) impact on the price discovery in the CME (CBOE) Bitcoin futures.
The importance of Bitcoin futures also lies in practical applications such as profitable investment in the futures market (Alexander et al., 2019; Nekhili, 2020) and hedging positions (Alexander et al., 2021; Deng et al., 2020; Sebastião & Godinho, 2020) in spot markets. However, the introduction of Bitcoin futures also brings about far-reaching adverse impacts. There exists evidence that trading activities in the Bitcoin futures markets elevate volatility in the underlying spot market (Corbet et al., 2018; Kim et al., 2020), lead to higher-moment risk measures (Jalan et al., 2021), and even cause market crashes on short-run Bitcoin prices (Hattori & Ishida, 2021; Liu et al., 2020).
The third body of research highlights the use of Bitcoin derivatives in predictive analysis. Shynkevich (2020) concludes that the introduction of Bitcoin futures disrupts the predictive power of technical trading rules. Hoang and Baur (2020) calculate implied volatility from a number of Bitcoin options traded on the options exchange Deribit and show that this predictor is superior in predicting 7- to 15-day than 1-day ahead realized volatility. Lee et al. (2020) discover that the Bitcoin futures basis provides some predictive power for spot price and risk premium changes. We, however, predict Bitcoin futures contract performance using all pieces of available information. Finally, our study is complementary to the extant literature on linking traditional financial market characteristics with the consequences of the emerging cryptocurrency space. To mention a few, Ma and Tanizaki (2019) provide international evidence on the day-of-the-week effects in Bitcoin markets. Yousaf and Ali (2020a) document the interlinkages between major cryptocurrency markets based on high-frequency data. Like their spirit, our study attempts to capture the relationship between classical futures pricing and spot Bitcoin trading, with emphasis on both the short-run and long-run spillovers of intraday high-frequency information from the spot market to the futures transaction places.
Methodology
This section introduces the fundamental idea and estimation procedures of LASSO and BMA, which we use in consecutive steps to pick out powerful performance predictors of Bitcoin futures contracts with the minimum specification dependency. In specific, we apply LASSO to rank all candidate predictors in the first step, and then we resort to BMA in the second step to alleviate the modeling uncertainty problem.
Compared to a dynamic conditional correlation framework commonly used in forecasting crypto assets, we prefer a linear regression algorithm as it can be extended by adding penalties to minimize some loss function during training, especially when there are numerous candidate predictors and we favor less complicated setups with few inputs. Such kind of extension is known as the regularized linear regression with LASSO being a representative with an L1 penalty that reduces the coefficients of predictors that make no significant contribution even to reach zero. In this way, LASSO permits input factors to be taken out from the model, leading to essentially a programmed feature selection.
Among ML algorithms, LASSO is a regression analysis method that selects variables and performs regularization at the same time, so that the prediction accuracy and interpretability of the statistical model it produces can be enhanced (Bühlmann & Van De Geer, 2011). With coefficient shrinkage, the LASSO procedure encourages sparse models with fewer parameters. Thus, it is well-suited for models showing high levels of multicollinearity or, like in our setup where there are many potential indicators and the Bitcoin futures sample period is relatively short compared to other futures products.
To automate the predictor elimination part of model selection, the sum of squared errors (SSE) for LASSO augments the SSE for ordinary least squares (OLS) with a punishment factor (Larger

where
While LASSO can improve OLS and Ridge regression via dropping weak predictors automatically, a practical disadvantage of it is the difficulty of finding the optimal regularization factor. We mitigate such concern by explicitly addressing
In this research, we use more than 70 inputs to predict Bitcoin futures returns. We are not sure about which inputs should be included in the model and models including different inputs are referred to as different versions. That is the model uncertainty problem which is usually ignored by standard statistical practice. A typical remedy for researchers would be arbitrarily choosing one modeling version out of many candidates under the assumption that the chosen one generated the data. As a result of ignoring the uncertainty inherent in model selection, this treatment causes riskier decisions and more biased inference than what they appear to be. Fortunately, aiming at minimizing such uncertainty, the literature offers an alternative BMA method featuring a coherent mechanism. Below we briefly review how BMA works. Mathematically, consider a regressing model indexed by

As there are

Assuming a constant

The model prior
Data
The dataset contains forty months ranging from December 1st, 2017 to March 30th, 2021. We obtain it by merging Bitcoin spot trading activities that occurred on the Bitstamp exchange and pricing records of cash-settled Bitcoin futures contracts transacted on the CME. One CME Bitcoin futures contract has a value of five Bitcoins valued by the USD reference rate, and a minimum five contracts are required for eligibility in block trade. These contracts expire the last Friday of each month and are listed for the current month and five following months, inclusive of the nearest two December contracts. According to recent CME reports, the Bitcoin futures average daily volume has grown from 1,000 contracts transacted per day to nearly 12,000 in 3 years since inception. In addition, the contracts’ average daily open interest has also seen a substantial increase from $77 million a day to a peak of $2.4 billion in the first quarter of 2021.
The variables on Bitcoin spot prices include timestamps, various prices (i.e., open, high, low, close, and volume-weighted average price), volumes denominated in both Bitcoin and the indicated currency, and the daily count of NotaNumber (NaN). NaN occurs when the Timestamp of one observation is missing. No trade is recorded in such a case, and the reason might be the exchange was down or there existed unforeseen technical errors in data reporting or gathering. The information about NaN’s is considered here because we suspect it might serve as a measure of illiquidity. Note that the spot data is not consolidated across exchanges. But it is to some extent representative since Bitstamp accounts for more than one-fourth of the world’s volume according to Bitcoincharts statistics. While the original spot price data is recorded in minute intervals, the futures contracts data is a continuous set of daily open, close, high, and low prices, with each price obtained by rolling over to the next contract 1 month before the maturity.
So, we first aggregate intraday high-frequency variables to the daily level and then merge this aggregated spot dataset with the futures dataset. For the open, high, low, and close prices, we choose the respective corresponding ones within a day. For volume and NaN, we sum up all minute variables along a day to obtain the daily value. The volume-weighted price is by definition the average. Note that, because all spot variables are in minutes, we can compute the daily volatility for each of them (except for the number of NaN’s) in a day. An initial pool of candidate predictors consists of 19 statistics, including Open, High, Low, Close, Vb, Vc, Wp, NaNs, Ovol, Hvol, Lvol, Cvol, Vbvol, Vcvol, Wpvol, Closef, Openf, Highf, and Lowf. Furthermore, we expand the pool by taking the difference between the day t and t−1 values for all variables stated above to get 38 variables. Finally, we double the number of variables by taking the squares of all 38 variables in order to capture the possibility of nonlinear relationships. Therefore, besides the 19 original statistics, we have 76 potential predictors at hand. We have also tried cross differences, interaction terms, and even higher moments. But they cannot survive the first round of variable selection, indicating that the current pool of candidate determinants can cover most information available. Details about the definition and naming rule can be found in Appendix.
In this paper, the outcome variables are the continuously compounded futures return, which is calculated by taking the natural logarithm of today’s open price quote for the current-month contract divided by its last-day value, and the moving volatility, which is computed as the rolling standard deviation of the logarithmic returns over the previous 24 days. To ensure consistency in the magnitude of estimated coefficients, we divide all potential predictors by their standard deviations before launching the automated two-stage variable selection process. Out-of-sample forecasts are implemented as we separate our data into two sets: the training and test sets. The training set includes 2/3 of the observations in the entire dataset, and the remaining 1/3 is for testing.
Empirical Results and Applications
The following two steps are implemented to pick the best predictors. Using the training dataset, we first adopt LASSO to find variables with the greatest predictive power for Bitcoin futures returns and volatilities. The LASSO λ is set at the value of .001 so that a handful number of predictors can be retained for BMA practices. One exception is for the Bitcoin futures return prediction at the 1-day forecasting horizon. LASSO’s λ is set to be .005 in this case due to the potentially severe multicollinearity problem.
As a second step, BMA is applied to conduct another round of predictor selection. More specifically, LASSO-selected predictors with Posterior Inclusion Probability (PIP) in Bayesian greater than .2 for returns and .5 for volatility are picked out for validation in later predictive regressions. Recall that PIP represents posterior inclusion probabilities, that is, the sum of posterior model probability for all model specifications wherein at least one covariate was included in the prediction. Intuitively, a larger PIP equates to a higher likelihood of the true model incorporating the predictors of interest.
Equipped with these predictors, we then run regressions of the forecast target, namely the futures returns and volatility, on explanatory variables that have survived our LASSO-BMA selection mechanism for both the training and test dataset. As most of the predictors selected turn out to be statistically significant predictors of Bitcoin futures outcome variables at various forecast windows, we exploit their usefulness in establishing profitable investment with daily short-run adjustment and efficient hedging strategies at the weekly to the monthly and bi-monthly longer-run horizon, respectively.
Next-Day Return and Volatility Prediction for Investment Strategies
Table 1 presents the results of regressing Bitcoin futures outcomes on factors selected by the stepwise LASSO-BMA method with training data. As can be seen, all three return predictors and eight volatility predictors are statistically significant at a 1% level. The significance is prevalent in both the training set for selection verification and the test set for out-of-sample forecasts. In terms of coefficient magnitude, the effects of predictors in the test set are much smaller than those estimated from the training set. Such a pattern only occurs in the next-day forecasting setup, implying that there are new daily price drivers specific to the testing period. This is also evident by the corresponding smaller R-squared. Nevertheless, factors identified in the training set still perform well.
Predictive Regression Results at 1-Day Horizon.
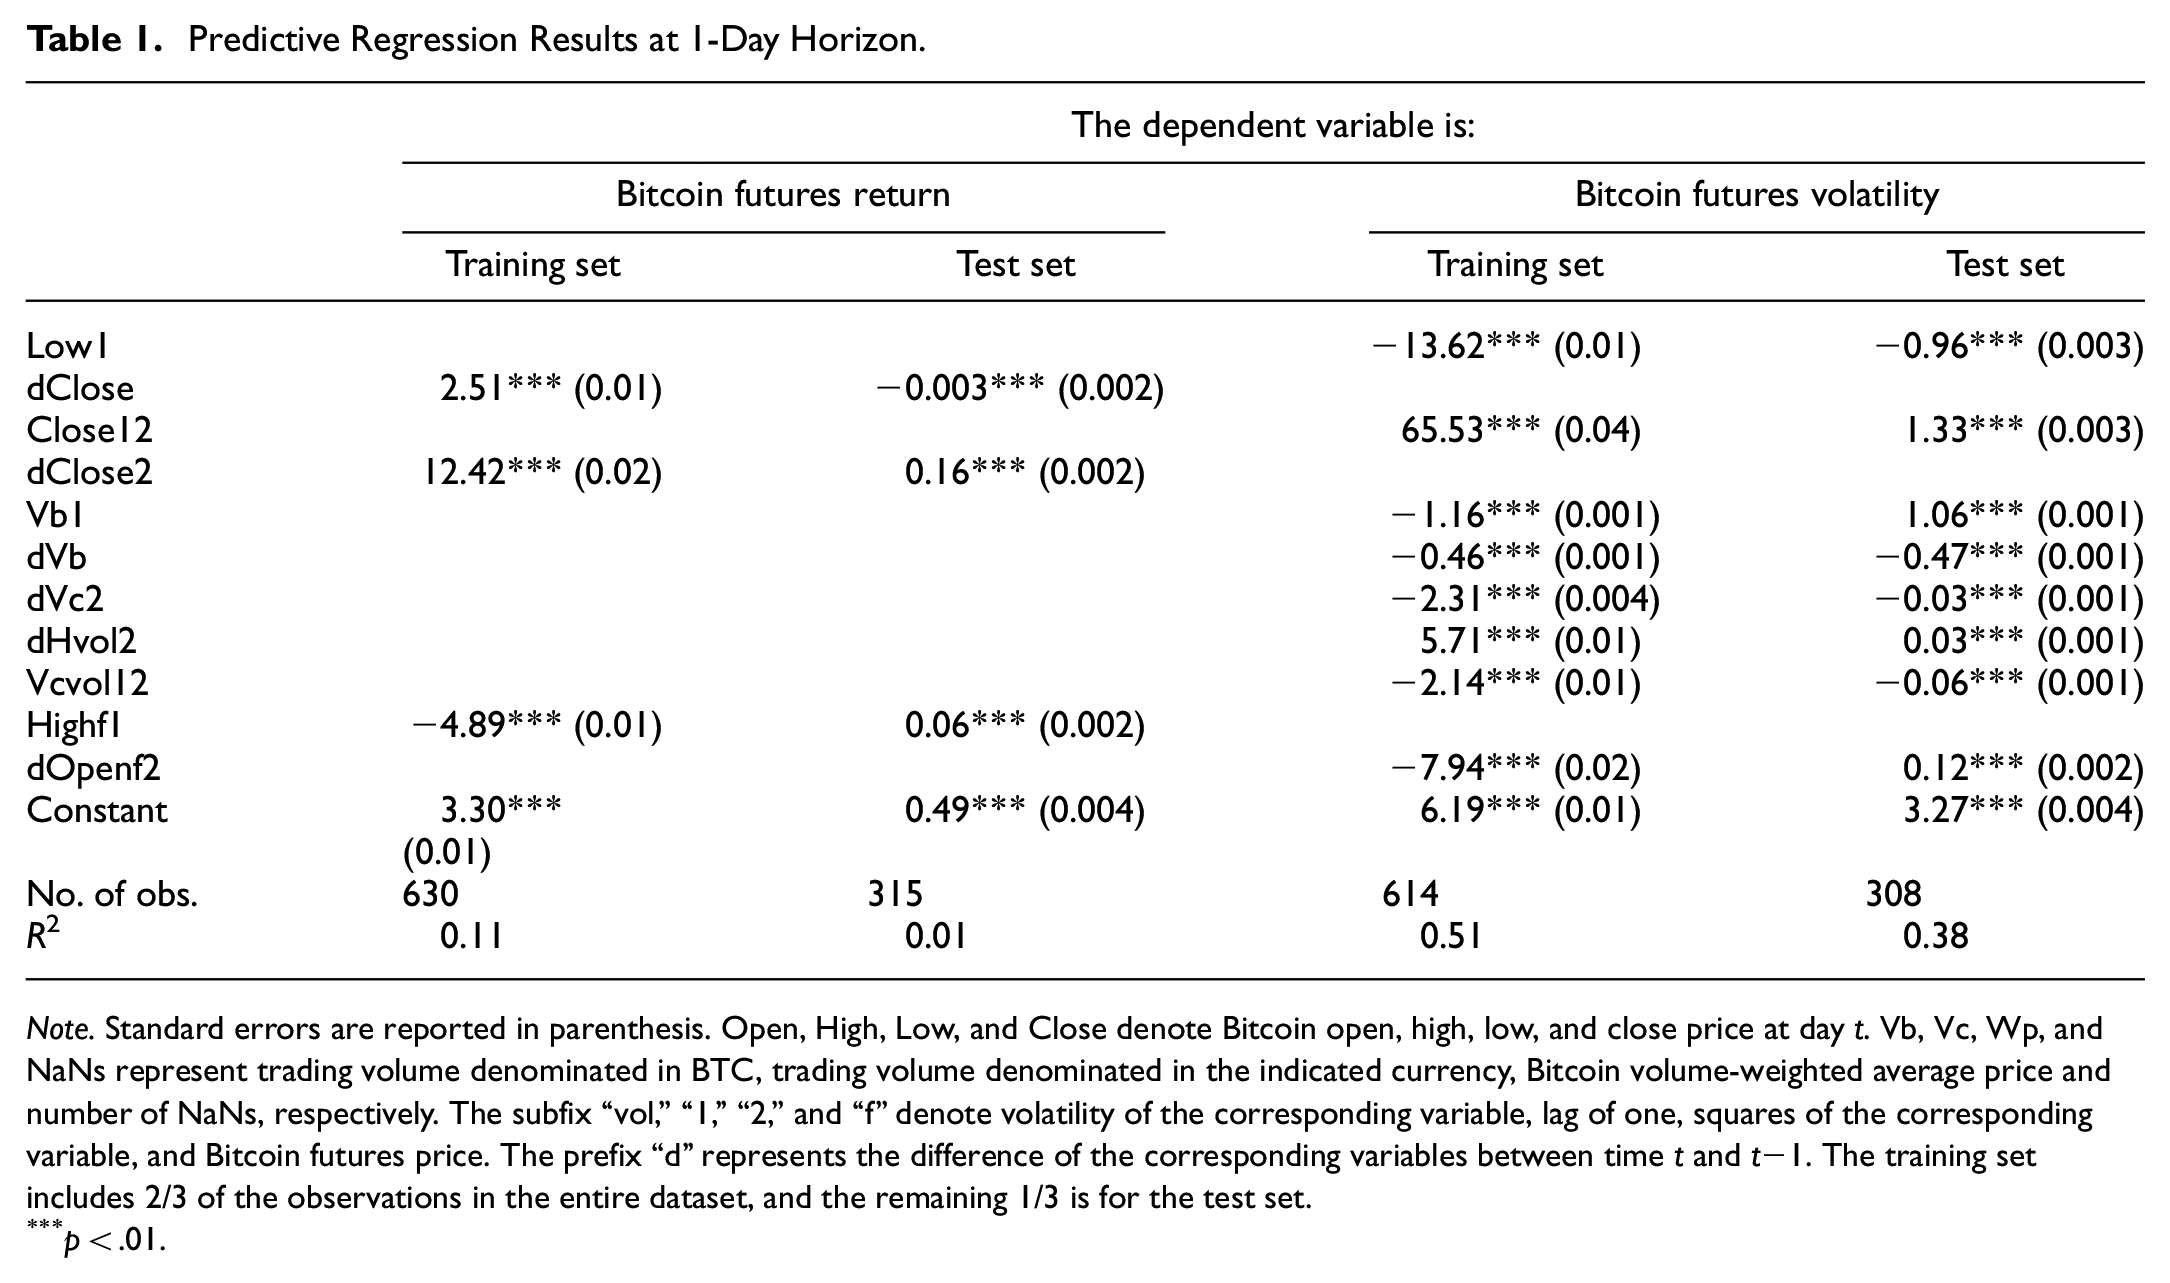
Note. Standard errors are reported in parenthesis. Open, High, Low, and Close denote Bitcoin open, high, low, and close price at day t. Vb, Vc, Wp, and NaNs represent trading volume denominated in BTC, trading volume denominated in the indicated currency, Bitcoin volume-weighted average price and number of NaNs, respectively. The subfix “vol,”“1,”“2,” and “f” denote volatility of the corresponding variable, lag of one, squares of the corresponding variable, and Bitcoin futures price. The prefix “d” represents the difference of the corresponding variables between time t and t−1. The training set includes 2/3 of the observations in the entire dataset, and the remaining 1/3 is for the test set.
p < .01.
In the specifications of return prediction, while dClose2 turns out to be significantly positively correlated with returns both in-sample and out-of-sample, the other two predictors change their signs when moving from the training set to the test set. Regarding the volatility predictive regression, Close12 and dHvol2 (Low1, dVb, dVc2, and Vcvol12) have consistently positive (negative) associations with Bitcoin futures price volatility. Vb1 and dOpenf2 have coefficient signs altered across different datasets. It merits a note that return and volatility prediction share no common predictor during our sample period, but drivers in either first- or second-moment form and from either spot or futures market emerge in both scenarios. These results confirm that variables sticking out from the LASSO-BMA selection indeed possess strong predictability.
This next-day forecasting ability can be used to adjust Cryptocurrency futures holdings to make profits. The simplest investment strategy goes as follows. First, in each day t in the test period, as long as the predicted volatility lies below some pre-specified threshold, investors can derive Bitcoin futures return for day t+1 based on the return predictors produced by the combined LASSO and BMA methodology as well as the coefficients estimated with the training sample. If this return estimation exceeds zero, investors should turn all pocket cash (if there is any due to previous futures liquidation) into additional futures on day t+1 or do nothing if no cash is left on day t. Else if the return forecast becomes negative, the action would be selling all futures on day t+1 if we held futures on day t or holding cash if the balance of futures is zero on day t. When the futures return estimation falls in a close neighborhood of zero, investors should stay put with prior exposure. We employ volatility forecasts to validate the above investment strategy with returns being replaced by their risk-adjusted versions. The results stay strong.
As some shocks may hide inside the dataset, we also need to capture structural breaks. Our proposed strategy can then be implemented again in different regimes defined by those identified time points. In addition, the Bitcoin market has been proven to be highly volatile during 2018 to 2021, incorporating sudden changes in price level and tendency simultaneously is a necessity. Thus, we first follow Narayan and Popp’s (2010) in constructing structural break tests to detect possible sample division rules. We find two threshold dates (i.e., 2019-04-29 and 2020-10-27, represented by the blue vertical dashed lines in Panel A of Figure 1) across which both the level and trend of Bitcoin spot prices have changed dramatically. Bitcoin futures price change follow the spot closely.

Comparing gross returns of Bitcoin futures investment strategies based on alternative prediction methods in different periods.
What we find is that our proposed forecasting techniques and investing strategies significantly outperform other benchmarks during the period of relatively stable Bitcoin price fluctuations (the middle subsample period from 2019-04-29 to 2020-10-27). Please refer to Panel B to D of Figure 1 for a graphical illustration of subsample comparison results. These three panels compare the gross return of employing the LASSO-BMA strategy and four benchmark returns of the LASSO-alone, OLS, neural networks, and buy-and-hold strategy during the same testing period. We conclude that our proposed way of investment can generate a more consistent and sizable premium than the other strategies, although it only beats the buy-and-hold strategy in volatile periods of Bitcoin futures markets. Thus, we can amend the current investment strategy by alternating between the LASSO-BMA and the buy-and-hold method according to the changing level of predicted futures volatility.
Secondly, we continue to use the first day (i.e., 2019-12-31, represented by the green vertical dashed lines in Panel A of Figure 1) when the Covid-19 breakout becomes official as a structural break. According to the World Health Organization (WTO) COVID-19 response timeline, this last day of 2019 is when WHO’s China Office picked up a media statement by the Wuhan Municipal Health Commission from their website on cases of “viral pneumonia.” Again, we repeat our forecasting and portfolio construction exercises before and after the world entered the pandemic era. Results in Panel A and B of Figure 2 show that our LASSO-BMA investment strategy based on exploring the futures forecasting power of high-frequency spot indicators performs moderately better in the pre-COVID subsample. However, it clearly underperforms others when the pandemic disrupts. This is consistent with the results shown above, that is there exist the structural breaks before and after COVID-19 breakout. Due to structural breaks after the COVID-19, building strategies based on the predictors selected by LASSO-BMA in-sample is not profitable as expected because the prediction power of the predictors selected are not as strong as before COVID-19 breakout.

Comparing gross returns of futures investment strategies based on alternative prediction methods for Bitcoin in pre- and post-COVID periods and for Ethereum with Ether and Bitcoin predictors.
Near-Term Return and Volatility Prediction for Hedging Strategies
In this section, we repeat the predictive regression exercise in the previous subsection for a range of longer horizons of 7, 30, and 60 days. All candidate predictors have gone through the same selection process for each horizon. But still, the predictability of selected indicators is preserved as demonstrated in Tables 2 and 3. When foreshadowing near-term returns, we discover different arrays of predictors for different forecasting windows. dClose2, Vb12, dVc2, Openf1, Closef1, and Openf12 display large and consistent predictive power in their model specification. They also maintained their sign when tested in the in-sample forecast dataset. In comparison to the stable performance of the above predictors, there are several variables including dClose, dLow2, dWp2, NaNs1, NaNs12, and dLvol that have relatively small coefficient magnitude. Since their contributions to forecasts are ignorable, we should worry less about the fact that their estimated signs are sensitive to the change from the training sample to the test sample. To summarize, we show that for different prediction horizons the predictors selected by LASSO-BMA are quite different. The implication for the results is that in practice when trying to predict Bitcoin returns, one may need to consider different groups of factors for different prediction horizons.
Predictive Regression Results for Return at 7/30/60-Day Horizon.

Note. Standard errors are reported in parenthesis. 7-, 30- and 60-day represent prediction horizons of 7, 30, and 60 days, respectively. Open, High, Low, and Close denote Bitcoin open, high, low, and close price at day t. Vb, Vc, Wp, and NaNs represent trading volume denominated in BTC, trading volume denominated in the indicated currency, Bitcoin volume-weighted average price and number of NaNs, respectively. The subfix “vol,”“1,”“2,” and “f” denote volatility of the corresponding variable, lag of one, squares of the corresponding variable, and Bitcoin futures price. The prefix “d” represents the difference of the corresponding variables between time t and t−1. The training set includes 2/3 of the observations in the entire dataset, and the remaining 1/3 is for the test set.
p < .01.
Predictive Regression Results for Volatility at 7/30/60-Day Horizon.

Note. Standard errors are reported in parenthesis. 7-, 30-, and 60-day represent prediction horizons of 7, 30, and 60 days, respectively. Open, High, Low, and Close denote Bitcoin open, high, low, and close price at day t. Vb, Vc, Wp, and NaNs represent trading volume denominated in BTC, trading volume denominated in the indicated currency, Bitcoin volume-weighted average price and number of NaNs, respectively. The subfix “vol,”“1,”“2,” and “f” denote volatility of the corresponding variable, lag of one, squares of the corresponding variable, and Bitcoin futures price. The prefix “d” represents the difference of the corresponding variables between time t and t−1. The training set includes 2/3 of the observations in the entire dataset, and the remaining 1/3 is for the test set.
p < .01.
Turning to new-term volatility prediction, we find two important predictors that are included in different forecasting windows and both of the two samples. High12 is unanimously estimated to have positive coefficients. NaNs1 seems to have negative estimated coefficients in the daily and monthly scenarios. Other predictors such as Vb1, dVb, and Vbvol1 also have consistent performance across the training and test set—the former two are only specific to the 7-day horizon with a positive and negative effect, respectively, and the latter exhibits a negative association with the Bitcoin futures volatility 60 days later. The conclusion is that the predictors selected by LASSO-BMA vary according to the forecasting window. This has further implication that in practice one should consider using different variables to predict Bitcoin futures volatility for different prediction horizons.
All in all, these longer-term return and volatility forecasts of Bitcoin futures contracts can help construct and efficiently adjust hedging strategies for investors exposed to the cryptocurrency spot market. In addition to betting on the future direction of the market and hedging risk, they can also be used to lock in an arbitrage profit, to change the nature of liability in receiving or giving out Bitcoins in the future, or to change the nature of an investment without incurring costs of selling one portfolio and buying another. For example, when the predicted level of basis risk is at a low level as implied by the predicted return and volatility for the Bitcoin futures, hedgers can initiate a short position on Bitcoin by shorting a futures contract to hedge against a price decrease in an existing long position. Conversely, a long hedger who plans to buy Bitcoins in the future and fears a price rise, triggering a loss, can implement the following strategy. When the Bitcoin spot price increases and causes a loss, the long futures position realizes a corresponding positive return that offsets the loss in cryptocurrency value.
Robustness Tests
The aim here is to make clear: it is our proposed predictor selection method, rather than the actual predictors obtained, that matters. To accomplish this goal, we repeat our regression exercises in the previous two subsections using a shorter pre-structural-shift sample period and an alternative coin of Ethereum and Ether futures. Moreover, we discuss how our analysis is related to the potential decomposition of Bitcoin futures’ total return.
We begin by running robustness regressions with the first half of our entire sample, that is, December, 2017 to August, 2019. To maintain about the same size of the training subsample as in the full sample, we now let the training set contain 5/6 of these halved observations, and the test set includes the rest 1/6. These twenty months seem to be unaffected by known trend changes in Bitcoin and by other exogenous shocks like the pandemic, the China-U.S. trade war, or strict government regulations on cryptocurrencies. It is shown that, although a different set of predictors emerge, their collective power for predicting Bitcoin futures prices remains highly significant.
As for the next exercise, while Bitcoin is the original and persistent leader in its field, we continue to validate our results with futures contracts on other cryptocurrencies that are among the top list by market capitalization as of the writing of the current paper. However, to the best of our knowledge, only Ethereum, which ranked second on our list, has its so-called “Ether futures” introduced by the CME on February 8th, 2021. On the one hand, we utilize our Bitcoin high-frequency-data-based indicators (over the entire year of 2021) to predict the Ether futures prices. On the other hand, we employ daily Ethereum spot quotes (1-minute-frequency Ethereum data is not available) to repeat our experiments. We discover that our proposed strategy remains valid but the investment strategy based on only daily factors becomes less useful (see Panel C of Figure 2). In Panel D of Figure 2, we attempt to predict Ether futures with Bitcoin variables and find that the corresponding investment strategies for Ether futures perform worst. This indicates the inapplicability of our procedure regarding cross-cryptocurrency-market forecasts. As a result, the overall implication is to exploit currency-specific information hidden in the high-frequency database, which can be extracted by our proposed LASSO-BMA two-step predictor selection procedure. Finally, regarding cryptocurrencies other than Bitcoin and Ether, if they have futures contracts launched, we expect that the predictive variables selected would vary according to different cryptocurrencies. That is, the predictability of different cryptocurrency futures returns is likely to be determined by different variables. Therefore, in practice, it would be better to focus on a different set of predictors for different cryptocurrencies.
Lastly, one may worry that our estimation could be biased when the current month’s Bitcoin futures contract is going to expire. When our investment strategy suggests continuing holding futures near maturity, investors would have to roll over their positions by closing current contracts and opening new ones for the same underlying currencies at the market rate. This causes either positive or negative contributions. Theoretically speaking, our way of directly computing futures return using daily price quotes would have captured the total return of futures contracts that consists of spot return, roll yield, and cash yield. In reality, CME Bitcoin futures markets were in contango over the past few years, leading to negative roll costs that detract about 10% annualized return from Bitcoin futures. As a result, even if we assume rolling occurs every month, our investment strategy can still deliver a positive total return despite a negative roll yield; let alone the fact that investors may hold the cash from time to time guided by our proposed simple investing principles (Tables 4 and 5).
Predictive Regression Results for the Test Set of the First-Half Subsample at Different Horizons.

Note. Standard errors are not reported to save space. Open, High, Low, and Close denote Bitcoin open, high, low, and close price at day t. Vb, Vc, Wp, and NaNs represent trading volume denominated in BTC, trading volume denominated in the indicated currency, Bitcoin volume-weighted average price and number of NaNs, respectively. The subfix “vol,”“1,”“2,” and “f” denote volatility of the corresponding variable, lag of one, squares of the corresponding variable, and Bitcoin futures price. The prefix “d” represents the difference of the corresponding variables between time t and t−1. The training set includes 5/6 of the observations in the entire dataset, and the remaining 1/6 is for the test set.
p < .1. ***p < .01.
Predictive Regression Results for the Test Set of the Ethereum Sample at Different Horizons.

Note. Standard errors are not reported to save space. Open, High, Low, and Close denote Ethereum open, high, low, and close price at day t. Vol represents the daily variance of Ethereum price fluctuations. The subfix “1,”“2,” and “f” denote lag of one, squares of the corresponding variable, and Ether futures price. The prefix “d” means taking the difference of the corresponding variables between time t and t−1. The training set includes 2/3 of the observations in the entire dataset, and the remaining 1/3 is for the test set.
p < .01.
Conclusions
The inception of Bitcoin futures contracts by major exchanges in December 2017 has drawn great attention from Bitcoin asset investors and has fundamentally changed the trading behaviors in the corresponding spot markets. Therefore, it is imperative for academia and industry to understand the short-term price movements of such derivative products and to identify the most relevant variables that are driving these price changes. This research fills the blank by combining LASSO and BMA methods to automatically build predictive models for returns and volatilities of Bitcoin futures contracts. We propose a novel way to use LASSO to select candidate variables with the strongest predictive power for the first round, and then use BMA to run the second round of predictor selection to mitigate model uncertainties. By doing this, we identify model-specific indicators for movements in Bitcoin futures contracts. Further validating regression results suggest that the predictors selected by this LASSO-BMA procedure indeed possess statistically significant predictability from both in-sample and out-of-sample perspectives. This is evident in adopting such a predictor-screen mechanism for future use of investment and hedging.
Looking ahead, it will be more interesting to study the properties of other derivatives such as Bitcoin options, strategy funds, and exchange-traded funds, as well as futures and forwards products launched on the basis of other types of cryptocurrencies. Also, scholars interested in international capital markets may prefer to investigate the function of futures for managing exchange risk inherent in the Bitcoin price movement, since Bitcoin is now internationally traded in various fiat currencies. Large institutional investors would like to have some reliable measures before they can participate in Bitcoin futures contracts. This constitutes the third direction of future research.
Our results matter for investors who are considering Bitcoin Futures as an alternative investment. Since Bitcoin is a relatively new addition to the investment universe, it is increasingly beneficial to get a more complete picture in terms of price movements in the underlying Bitcoin as well as the associated futures. While the returns of Bitcoin futures lag the returns of spot, there still exists the basis that to some extent can be predicted by the information hidden in intraday spot markets. Therefore, our findings could offer several advantages for various market participants. From the perspective of regulators, a better understanding of the market pricing of Bitcoin futures is good for promulgating policies that can enhance transparency, price discovery, and risk management capabilities in the digital asset universe. For exchanges and index providers, they have more confidence in expanding the platform of and benchmarks for fair and orderly Bitcoin trades. For example, CME has already introduced related products like the Micro Bitcoin futures, which is one tenth the size of a standard CME Bitcoin futures contract and S&P Dow Jones Indices have released a range of cryptocurrency futures indices including the S&P CME Bitcoin Futures Daily Roll Index. In the eyes of traders, futures contracts allow them to speculate on the direction of Bitcoin without holding a volatile asset class. At last, our results have implications for Bitcoin miners, who consider futures as a means to lock in prices that ensure a return on their mining investments without the risk of exposing themselves to steep price changes, and for spot cryptocurrency investors, who can better utilize Bitcoin futures to hedge again their positions in the spot market.
Footnotes
Appendix
We list all 76 candidate predictors explored in this paper as follows: Open1, High1, Low1, Close1, dOpen, dHigh, dLow, dClose, Open12, High12, Low12, Close12, dOpen2, dHigh2, dLow2, dClose2, Vb1, Vc1, Wp1, dVb, dVc, dWp, Vb12, Vc12, Wp12, dVb2, dVc2, dWp2, NaNs1, dNaNs, NaNs12, dNaNs2, Ovol1, Hvol1, Lvol1, Cvol1, dOvol, dHvol, dLvol, dCvol, Ovol12, Hvol12, Lvol12, Cvol12, dOvol2, dHvol2, dLvol2, dCvol2, Vbvol1, Vcvol1, Wpvol1, dVbvol, dVcvol, dWpvol, Vbvol12, Vcvol12, Wpvol12, dVbvol2, dVcvol2, dWpvol2, Openf1, Highf1, Lowf1, Closef1, dClosef, dOpenf, dHighf, dLowf, Closef12, Openf12, Highf12, Lowf12, dClosef2, dOpenf2, dHighf2, dLowf2.
These predictors are named by concatenating three components. The first component (if any) is a differential indicator denoted by the letter “d.” The second component that appears in the middle of the name is one of the statistics defined below. The third component (if any) is either “1,”“2,” or “12,” where “1” means one-day lag, “2” means the squared term, and “12” means being lagged and squared simultaneously. For instance, dClosef2 represents the squares of the difference between the Bitcoin futures close price evaluated at day t and the corresponding price recorded at day t−1.
Acknowledgements
We thank all seminar participants at the Shanghai Business School. The two authors contributed equally.
Declaration of Conflicting Interests
The author(s) declared no potential conflicts of interest with respect to the research, authorship, and/or publication of this article.
Funding
The author(s) disclosed receipt of the following financial support for the research, authorship, and/or publication of this article: This work was Supported by “the Fundamental Research Funds for the Central Universities” Zhongnan University of Economics and Law (No. 2722021BZ042), and by the General Program of National Natural Science Foundation of China (No. 72071211)
Ethics Statement
Ethical approval is not applicable for this article.