
Abstract
Energy sustainability, as well as climate change mitigation, is an immediate challenge facing the world, especially for large developing countries such as China and India. This study analyses the solar photovoltaic (PV) potential of Jiangxi, China, using three dominant technologies including conventional PV, PV/PCM (Phase Change Material), and PV/T-PCM (Thermal-Phase Change Material). We employ a lifecycle assessment by investigating the spatial differences of radiation conversion rates across major cities. Two sets of scenario analyses are also examined: (1) fixed installation capacity; and (2) fixed government investment. Each set has three alternative scenarios to distinguish the power generation potential, investment requirement. The results show that under the “fixed capacity” scenarios, the conventional PV can generate 313 GWh/year, and the PV/T-PCM can yield more than 340 GWh/year. The result would change substantially under the “fixed investment” scenarios, in which the annual solar power from conventional PV is more than 1,736 GWh. The scenario analysis points out that if the total investment rather than total capacity is fixed, the power generation from solar PV systems can be maximized, but the total cost would increase considerably as well. Amortization of the installation costs that would potentially alleviate the firms’ fiscal burden is also discussed.
Keywords
Introduction
Energy is crucial for social, economic, and technological developments. While fossil energy has been considered to be non-sustainable and result in global climate shift, searching for and applying renewable energy technologies becomes of particular importance to all countries. China has been ascending progress in the past 40 years and emerges as a leading economy, but during the phase of rapid economic growth, its energy consumption is mainly based on fossil fuels that significantly contribute to climate change and numerous environmental pollutions (Friedlingstein et al., 2014).
While many renewable technologies such as wind energy, hydropower, nuclear, and solar PV have been examined and installed in China (United Nations Framework Convention on Climate Change [UNFCCC], 2008), until 2013 the proportion of fossil fuels to total energy use still take as high as 89.98%, and the total emission from fossil utilization is more than 10 × 1010 t CO2 (D. Li et al., 2016). Friedlingstein et al. (2014) point out that the smog and haze released from fossil use have caused many environmental and health concerns such as increased respiratory problems, eye diseases, and other health hazards that would severely damage China’s economy. Thus there is an urgent need for the Chinese government to adopt alternative clean and renewable energy that replaces the use of fossil fuel which improves energy security and the environment. Under such circumstances, the government has promoted several renewable projects in recent years.
Solar energy is such an alternative because it is not only abundant worldwide but also environmentally friendly, and thus it has attracted great attention from countries (Meng et al., 2014). Solar Photovoltaic (PV) is the technology is used to convert solar radiation into electrical power. This technology has matured over time and is widely applicable and used in different regions of the world to have a lower impact on the physical environment. T. Li et al. (2013) show that approximately 51% of the total solar radiation is potentially useful for power generation. While substantial loss could occur during the radiation conversion process, solar energy has been growing rapidly, Rourke et al. (2009) and Gong and Kulkarni (2005) point out that with the innovative development of solar PV panels the energy conversion from solar radiation would be more efficient, thereby reducing production and operational cost.
When the temperature of the solar panel rises, the overall efficiency of the solar PV panel reduces. To improve efficiency and reduce production costs associated with solar PV systems, several technologies have been innovated. For example, the PV/T-PCM (thermal and phase change material) and PV/PCM (phase change material) systems cool the panels using water and air so that the collector installed in the panels can work more efficiently (Abhat, 1983; Hasanuzzaman et al., 2016; Simonetti et al., 2018). In general, the two power systems can be combined to generate thermal and electrical energy simultaneously (Dursun, 2012; Jun et al., 2011).
The rising temperature of the solar panel severely affects the efficiency and power generation and, the magnitude of the efficiency reduction can be 0.65%/°C/° and only 5% to 20% of the solar radiation can be converted to electrical power. Ma et al. (2014) and Skoplaki and Palyvos (2009) show that the efficiency-temperature coefficient for PV panel is ranging from −0.4%/°C to −0.45%/°C, and to deal with this issue thermal management is inevitable to improve PV efficiency during operation of PV panels (Islam et al., 2016). Many techniques are used to reduce the temperature of PV panels like the use of Phase Change Materials (PCM) is considered a potentially viable option that can help to solve the rising temperature issue. It can absorb enough amount of latent heat without rising panel temperature. This system is regarded as PV/PCM, as illurtrated by the Jet Propulsion Laboratory (Waqas et al., 2018).
A study was completed in UAE (United Arab Emirates) and concluded that by addition of PCM material with PV panel can enhance electrical energy up to 5.9% in UAE climate conditions. Same as Mexico, Eastern Asian economies have the great viability of the application of PCM with PV panels while some studies suggest that the addition of PCM can reduce the efficiency due to poor heat transfer (Japs et al., 2016). With the addition of PCM temperature of the PV panel can be reduced up to 24.9°C and the output of energy can be improved up to 11.02% while PV-PCM is not considered economically viable because the price is high (Zhao et al., 2019). Further Nijmeh et al. (2020) conducted a study in Jordan to analyze the performance of PV/PCM and conventional PV, study concludes 3.4% excessive electrical power observed from PV/PCM while investment is economically unattractive in current conditions.
The photovoltaic-thermal with Phase Change Material (PVT-PCM) systems combine to give the energy storage and energy recovery strategies (Carmona et al., 2021). The use of an additional layer of PCM with PV thermal systems create the dual benefits first it cools the panel secondly heat storage. The use of PCM with PVT improved system efficiency up to 42.8% combined while efficiency from conventional PV was 13.59% only. The photovoltaic module can convert only 15% to 20% of energy into electrical energy while remaining transformed into heat and it drops the overall efficiency. So it is the optimal option to harness electrical and thermal energy from hybrid Photovoltaic system PVT/PCM it improves heat transfer and performance of the overall system (Fayaz et al., 2019). Hybrid PVT-PCM module improves electrical efficiency up to 7.43% if we compare it with a convention PV system, additionally daily combined efficiency of Hybrid PVT/PCM module is 31.35% while if we consider the electrical efficiency which is 13.12% (Carmona et al., 2021).
Solar radiation and temperature are the two important factor for power generation, higher solar radiation higher will be the solar power generation and temperature effects negatively higher temperature leads to the lower efficiency of the PV module, efficiency of the solar panel improve with the rise of solar radiation in perils Malaysia (Daut et al., 2012). same as lower solar radiation having the significant influence over different solar systems in Nigeria (Ibrahim et al., 2019) with the rise of solar radiation power generation from crystalline silicon solar cell rises and vice versa, and with the increase of temperature electricity generation decreases (Karafil et al., 2016; Xiao et al., 2014). Solar radiation greatly influences the performance of the PV/PCM system and thermal conductivity enhancement fins are suggested to reduce the temperature of the solar system (Hasan et al., 2017).
PVT/PCM is a useful technique among all the other system this system observed solar radiation and convert it to electrical and thermal energy while all the energy is not useful. Power generation from an efficient PVT/PCM system improves the electricity generation and thermal output and loss of energy are also low. Solar radiation has the highest impact on thermal power (Kazemian et al., 2021). Efficiency and performance of PV system greatly affected by variation of solar radiation and it leads to an effect on voltage, current, and power in India (Vidyanandan, 2017). The installation of PCM with PV system can improve electrical and thermal power under the following condition firstly if the PCM thickness is 1.5 cm secondly solar radiation of 1,000 W/m2 and lastly if the melting temperature of PCM 45°C and ambient temperature at 10°C (Preet et al., 2017). Many studies have analyzed potential solar power generation from PV in the least developed and developed regions of the world while potential power generation from China’s population zones like Jiangxi is hardly available in the literature. Therefore, the local government aims to explore how the use of solar power may alleviate environmental problems and increase the supply of renewable energy in different cities.
The first objective of the study is to explore electricity production from solar resources in a central Chinese province, Jiangxi, a province with a population of 46.2 million and an area of 166,900 km2. The reason why we choose this province as the study area is because it lacks energy and the local government has been promoting the development of renewable energy in recent years. Since its major cities such as Nanchang and Ganzhou have, on average, more than 1,800 sunny hours per year, solar PV technology is of particular interest to the decision-makers.
Second, this study is to analyze the potential electricity generation by three technologies including conventional solar PV, PV/PCM, and PV/T-PCM to explore the electricity generation potential of each technique possibility across the major cities of Jiangxi province, as well as the economic viability of each technology. In addition, this study investigates two opinions proposed by the local government to assess the influences under various promotion policies. Specifically, this study examines the proposals regarding fixed capacity and fixed investment, of which we further discuss how the distribution of solar panels will influence power generation and profitability. Specifically, this study addresses two important questions.
(1) Power generation potential from solar resources under various technologies in Jiangxi, China?
(2) What are economic costs and potential energy generation under fixed capacity and fixed investment scenarios?
By the completion of the tasks, this study tries to make the following contributions. First, this study helps to explore the potential solar power generation by the application of three competing technologies in 11 major cities of Jiangxi province and collectively to the entire province. This study helps to understand the technology-specific conversion efficiency in the face of variation in regional characteristics. Second, we estimate the investment requirement associated with each technology and explore the potential change in the capital when different technologies are applied. The results thus help the investors and government officials gain knowledge and make more accurate decisions when they face competing alternatives. This study also helps the local government to understand which technology is applicable in a specific region. Third, this study investigates the profitability in the face of different long-term interest rates because the costs of solar panel systems can usually be amortized. With this application, this study provides a hint regarding the necessity of promotion policies and the importance of government subsidies.
Theoretical Background of Solar PV Techniques
Three solar PV technologies are generally examined and implemented across countries (Kazemian et al., 2018), and this study will first introduce the background of these alternatives and address their power generating efficiency under various conditions. For example, at high temperatures, the electrical efficiency of the conventional PV is reduced, and to overcome this shortage a phase change material (PCM) is used to divert the heat and cool down the PV cell. While PV/PCM mode is improved technology, it can only convert solar radiation into electricity. Another innovative technology called PVT/PCM is explored that can convert radiation into either electricity or heat, depending on necessity. This section will discuss the theoretical background behind these technologies and show how they are working.
Progress of Conventional Solar PV System
Solar energy was firstly discovered in 1839 and the first effectively working solar cell was designed in 1882. While there is a long history of solar energy, the conversion efficiency remains low (i.e., less than 4%) until 1954, and thus the application of solar PV systems is limited to laboratory or small scales (Wang, 2010).
Great progress in the radiation conversion process has been made in recent years, thereby making solar energy an attractive possibility to generate electricity, especially in the face of a threat from climate change and future fossil shortage. In general, solar cells are electronic devices that convert solar radiation into electricity, and they are widely used to produce renewable electricity worldwide (Mughal et al., 2018). Here we present how the conventional solar PV system is operated.
The solar energy per square meter is estimated by the method provided by Chang (2009) in which the PV panel is assumed to be installed on a single-axis, facing south, tilted at an angle β to the horizontal surface with an idealized solar tracking system.
The panel system is depicted in Figure 1, in which the total instantaneous global radiation (IT) on the tilted panel is the summation of three components: (1) direct beam (IbT); (2) diffusion (IdT); and (3) deflection from the ground (IrT), which can be expressed as follows:

where


Based on Morcos (1994) and Yakup and Malik (2001), ρ is generally assumed to be .2. Chang (2009) demonstrates that the instantaneous angle θtrk among direct beam and the normal of the tracked panel and the instantaneous slope of the panel Ω can be expressed as follows:


Here, α is the angle that tracks how the system rotates from positions at a limited maximum value of 45° to protect the cell from damage. θz is zenith angle and


The solar declination δ is the angle between the line joining the centers of the sun and the Equatorial plan, which is determined as

This is the so-called “Sine model” that can be used to determine the sine wave function to approximate the changes occurring during a day. Chang (2009) points out that this methodology can be utilized to observe the daily radiation at any point in time, and the radiation at any instant can be obtained by multiplying the daily radiation and normalized sine coefficient n. Using these equations the primary parameters affecting the power generation potential of conventional solar PV technologies thus can be investigated.
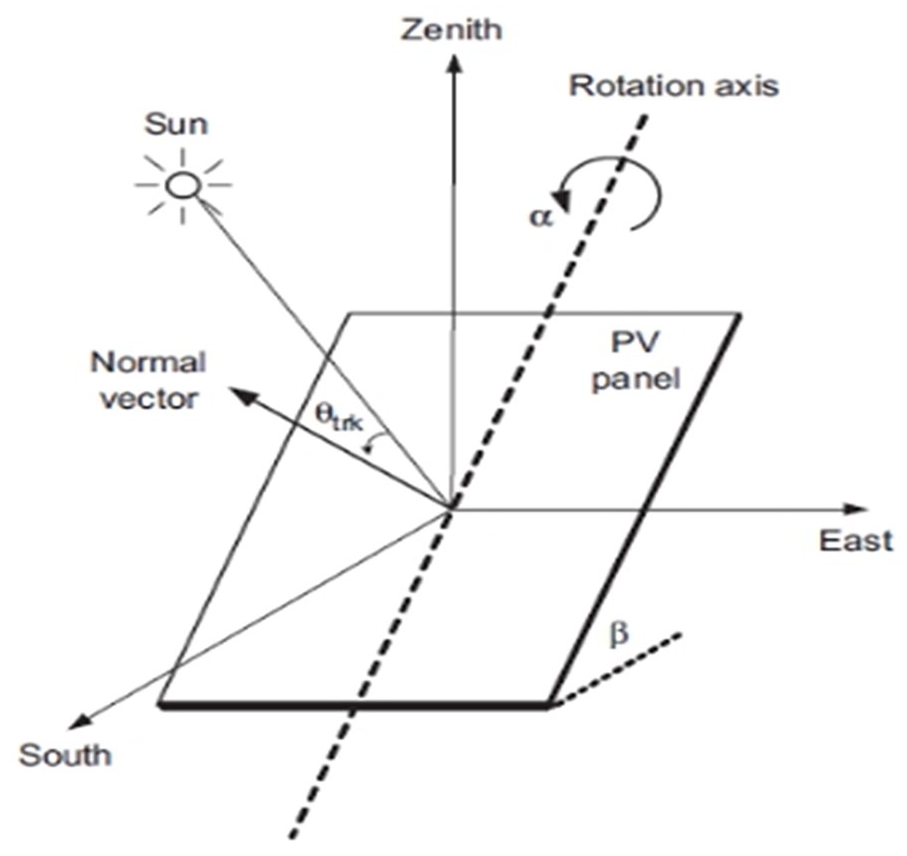
Geometry of a PV panel.
Advances in Phase Change Materials (PCM)
In the conventional PV panels, only 15% to 20% of the solar radiation can be converted into electrical energy and the rest dissipates as the heat, increasing the temperature of the solar panel up to 40°C and reducing the overall efficiency. PV/PCM mode overcomes this shortage by using the phase change materials to cool down the panel without additional energy requirement (Ma et al., 2019). In addition, PV/PCM has the properties like high thermal conductivity, chemically stability, large latent heat of fusion, non-corrosive, and non-toxic (Stritih, 2016) that make it more attractive to the industry.
According to Ma et al. (2019) study in which they state that for the temperature of a single PV module (TPV) and the atmosphere ambient temperature Tamb, TPV is normally higher than Tamb, and the energy balance equation can be as follows:

where Psun (W/m2) absorbed solar power density by the front surface facing the sun and Prad stands for thermal radiation loss to the ambient:

The right-hand side of equation (11) is the net thermal energy power that exists in the PV module itself, and it is obvious that if the Pnet is greater than 0, the temperature of the PV module will increase immediately. In equation (12) the ε represents the emissivity of PV, F stands for the view factor, and σ is a Stefan–Boltzmann constant. Tsky is the effective temperature of the sky while Pcon represents the thermal loss parasitically to the ambient during system convection and conduction. Following the Law of Cooling, Pcon can be estimated as below:

where hcon represents heat transfer coefficient that incorporates the coefficients during conductive and convective hear transfer stages.

Here the Pe denotes the electricity generation power, which is a function of the working temperature under certain solar radiation intensity that is decreasing with temperature.
Here, the different heat transfer conditions at the back surface will make the Tpv, the Pe remain the same. The additional term of equation (16) denoted as Pcool is defined as cooling power density, representing the heat transfer density from the PV module to the PCM.

where Hpv-PCM denotes the heat transfer coefficient between PV and PCM.
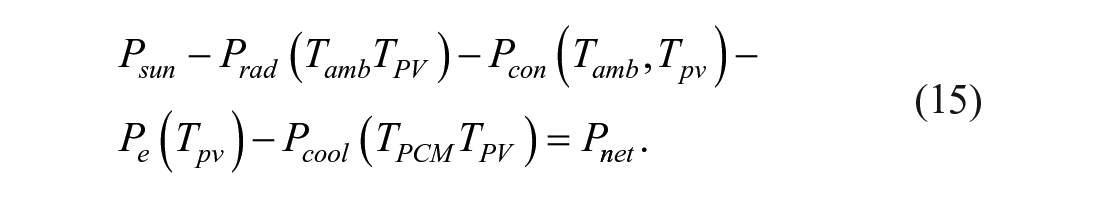
Shows general information of PV and PCM panels: (a) PV/PCM panel, (b) outdoor experimental setup consisting of PV and PV/PCM, and (c) schematic of a typical PV/PCM module and its energy flow.
In Figure 2 we compare the conventional PV and PV/PCM systems. From Figure 2, it is clear that the conventional PV system has a glass cover on top, EVA films on the top and bottom with silicon cells, along a TPT back sheet in between. The PV/PCM system consists of an additional layer of phase change materials or high thermal conductivity materials under the conventional PV module. The amount of the heat that can be absorbed depends also on the density of the material and subsequently its weight-thickness of the applied layer; therefore, the thickness of the PV module is usually less than 1 cm with a PCM container around 4 cm in diameter. It is worth noting that the shape of the PV/PCM module displayed in Figure 2 may also be displayed in other innovative designs while the insights are generally the same (Ma et al., 2019).
PV/T-PCM as an Innovative Approach
While power generation from the solar radiation is not stable and sometimes is at low energy density, by implementing the phase change materials into the photovoltaic thermal (PVT) system some studies find that the electrical power and overall efficiency would be greatly improved (Lin et al., 2014; Meng et al., 2014). Additionally, Malvi et al. (2011) and Gaur et al. (2017) show the balance energy model that the conjunctive application of PVT/PCM mode would result in a 9% rise in electrical output, along with a merely 20°C rise in average water temperature.
Analysis of Kazemian et al. (2018) indicates that the ethylene glycol and phase change material can be used as the coolant in the PVT systems. They show that the energy entropy, exergy, and thermodynamic can be explored to understand the overall performance of the mechanical system. Consequently, to achieve the optimal efficiency of the PV units, following the first and second thermal laws the energy and exergy of the PVT/PCM system can be referred to the following equations:

Or equivalently, the equation (17) can be expressed as follow:

According to the above equation Ein, Eout, and Eloss refer to the energy rate related to the input, output, and losses, receptively. In this equation, Esun is equal to the effective solar radiation and Geff refers to the PVT system that can be expressed as below:

where τg is the glass cover transmissivity, αcell the cell absorptivity, and G is the rate of the total solar radiation that can be calculated as follows:

where the Gbeam and Gdiffuse are the beam and diffuse components of solar radiation.
Figure 3 represents the PVT/PCM system in which the cooling system is installed with PV/PCM panel. A small pump is installed to recirculate the water through the panel so that the working fluid would take the system heat which is exchanged in a heat exchanger. After that, the heated water goes to the reservoir for further utilization.

Schematic diagram of the PVT/PCM system.
Comparison and Experimental Examination Across Technologies
Solar cell harnesses the solar energy and converts this energy into electrical power while with the rise of solar cell temperature voltage, power generation, and overall efficiency from convention PV module decline (Baloch et al., 2015; Hosseinzadeh et al., 2018) Various active and passive method is used for the thermal management of PV module. Phase Change Material (PCM) is an effective material to reduce PV module temperature, the heat stored in PCM has various applications. Organic paraffin is an affordable and non-hazardous PCM material, the chemical and physical properties of the material remained unchanged during various melting and freezing cycles. Photovoltaic Thermal/Phase Change Material is the latest among all other systems used to reduce panel temperature. This system has dual benefits firstly thermal performance increased up to 5% secondly electrical output also increased comparatively the conventional PV Module (Kazemian et al., 2018; Stritih, 2016).
In this section, we analyze and compare the electrical, thermal, and overall efficiency of each technology, and the installed module of each technology is illustrated in Figure 4.

Installation of PV, PV/PCM, and PVT/PCM systems.
Table 1 illustrates the power potential under various systems. Per square electrical power of conventional PV, PV/PCM, and PVT/PCM are 87.9, 91.61, and 95.65 W/m2, respectively. The PVT/PCM could produce a higher amount of electrical energy compared to the other two solar power systems. If we consider the efficiency of the power system PVT/PCM generates the thermal and electrical energy simultaneously and thereby making it more efficient. In Table 1 we see that the overall average efficiency of PVT/PCM is 84.49%, which is much higher than those of the conventional PV (12.91%) and the PV/PCM (13.42%).
Power Potential Under Various Solar PV Systems.

Source. Kazemian et al. (2018).
Hossain et al (2019) and Ma et al. (2018) perform the efficiency test of PVT/PCM with the PV module in Malaysian, along with the energy and economic analysis to understand the technical and economic consequences. In Table 2 we can see that the electrical, thermal, and exergy efficiency of the PVT/PCM is still much more efficient than others. At 4 l/min (LPM) the maximum power output is 160.29 W for PVT/PCM, which is 14% higher than that of the traditional solar electrical efficiency at 4.72%. The break-even cost of the solar PV is US$469.25 but the maintenance cost of the system is zero if we compare it with the cost of PCM at US$ 1313.29. This is costly because after 5 to 6 years the PCM must be replaced change. In general, the electricity output of the PV/PCM system increases by 5.18% relative to the conventional PV system (Ma et al., 2018).
Electrical, Thermal, and Exergy Efficiency.

Source. Hossain et al. (2019).
Development of Solar PV in China
China has been greatly emphasized and engaged substantial resources in the development of clean energies which help control environmental problems such as climate change and sustain domestic energy supply to meet growing energy demand (J. Li, 2014). Renewable energy such as solar energy, wind energy, geothermal energy nowadays is considered to be applicable in China (Denholm et al., 2010; Saidur et al., 2011; UNFCCC, 2008).
Solar radiation that is widely used for producing electricity to meet the energy demand of the country is abundantly available. China is a country having an area of 9.6 million square kilometer, and thus a substantial solar resource can be exploited in many regions.
Development of Solar PV in Jiangxi Province
Solar PV is the technology used to convert solar radiation into electrical power. This technology has matured over time and is widely applicable and used in different regions of the world because it has very little impact on the environment. As the development of PV panels becomes more efficient, the production and operational cost of solar panels reduce considerably (Gong & Kulkarni, 2005), substantially expanding the generation of solar power in the last decade. For example, in China, the installed capacity of solar panels in 2010 was only 1,025 MW but in 2019 it approaches 205,072 MW. However, solar power generation is at a commercial level in Jiangxi province until 2015. After 2015 the government has paid more attention to this renewable source and we can see that the total installed capacity has increased from 440 MW in 2015 to 5,360 MW in 2018. The capacity information is displayed in Table 3.
Installed Capacity of Solar PV (MW).

Source. IRENA (2020a).
Solar PV Potential in Jiangxi Province
Before we estimate the solar energy potential of Jiangxi province, it is necessary to know the sunny hours of the study area. In this study, 11 major cities of Jiangxi province will be separately examined to investigate the influence of local characteristics and then aggregated to the provincial power potential. By doing so the regional sunny hour is estimated by the 9-year average of the publicly available data. Since the solar radiation is not equal across months, the sunny hour is reported monthly, as shown in Table 4.
From 2011 to 2019 Average Monthly Sunny Hours (by City).

Source. The original climate data is retrieved from https://www.worldweatheronline.com
To estimate monthly solar PV potential, we will need to multiple the sunny hours by energy conversion rates of alternative PV systems. Specifically, the regional monthly solar PV potential is estimated by the following equation:

where net power potential is the sum of
Table 5 presents the annual solar PV potential of major cities under various solar PV systems, and the by-month power potential is displayed in Supplemental Material Appendix A. With the conventional PV technology up to 2,431.9 kWh could be generated annually, which is slightly less than 2,534.6 kWh from PV/PCM and 2,646.4 kWh from PVT/PCM. It is also clear that the maximum power potential occurs in Nanchang at 238 kWh under conventional PV technology. In general, the PV/PCM and PVT/PCM yield 4.1% and 8% more electricity than conventional PV technology, respectively. However, the result is on a per square meter basis that to explore the city-wide or province-wide power potential, we need to investigate the installation pattern of each city. The next section discusses the potential electricity generation of each solar PV alternative under various proposed policies.
Solar Energy Potential (kWh/m2) Under Various Technologies.

Techno-Economic Analysis Framework
First, this study takes an average of 9-year (2011–2019) monthly sunny hours of all the major cities of the Jiangxi province. We then utilize the life cycle assessment to calculate the energy generation during the life of a power plant. Since we already estimate the power potential under various solar PV systems from Kazemian et al. (2018), we can employ equation (21) to investigate power generation potential of various technologies for each city. This is represented in Table 5.
Scenarios analysis helps the local government to take the informed decision regarding the solar power generation. Two sets of scenarios are proposed to further investigate the development efficiency of solar power generation in Jiangxi province. The first set focuses on the “Fixed Capacity” and the second one examines the changes of development efficiency in the face of “Fixed Investment.” Each set is further decomposed into three subsets so that a more detailed analysis can be examined. We first proposed that if we have 94 million US dollars for allocation in three different technologies and cities and installation of 40 W panel with the cost of installation of each power generation module are taken as $12.48, $15.24, and $17.89 per 40 W panel under PV, PCM, and PVT/PCM modes, respectively. Based on this assumption we estimate that approximately 7.55 (PV), 6.16 (PCM), and 5.25 (PVT/PCM) million panels can be installed. In total, 1.362, 1.683, and 1.663 GWH/m2/year can be generated by fixed investment conditions, respectively.
Second, under fixed installed capacity scenarios, 80 MW plant is considered for calculation purposes and we have to install 2 million panels in all the 11 major cities of the Jiangxi province, where the installation in each city can be equally, unequally, or only in the 5 cities with the largest solar energy potential. It is estimated that on average, (1) each city utilizes 12.18 ha of land with installation of 181,818 panels in equally capacity scenario; (2) 8.89 to 13.11 ha of land with proportional installations for unequal capacity scenario, and (3) each of the five highest power potential cities utilize 27 ha of land to install solar panels. Similar allocation occurs to the fixed investment scenarios while the capacity is now replaced by the capital constraints. With this setup we are able to calculate the installation cost and power generation potential for each city under conventional PV, PV/PCM, and PVT/PCM.
Scenarios Under Different Capacities and Fixed Investments
In this section, we present the solar PV potential of two proposed policies under an installed area of 134 ha. To obtain more robust results, three installation alternatives that under each policy will be investigated. Specifically, the first proposed policy is to fix total capacity and the second one is to balance the total investment. By comparing the power generation and subsequent economic and consequences among installation possibilities, more general information on solar PV implementation can be gained by the decision-makers.
Total Capacity Scenarios
Scenario I: Equally sharing capacity
Because the government usually provides beneficial policy or financial support to the city that develops renewable energy, the more renewable energy is produced in that city, the more financial supports would be received. Therefore, based on the concern of city-wide equity, the first option in total capacity policy is to equally share solar panels across cities so that each city would equally benefit from the solar energy development.
The total proposed installation area is 134 ha, which is about 12.18 ha for each city. Given the proposed 80 MW installation capacity and using the 40 W panel, each city will be able to install 181,818 panels. Under the per square meter power potential displayed in Table 5, we can estimate the total power potential from this panel allocation. The result is displayed in Table 6. The potential power generation from the conventional PV, PV/PCM, and PVT/PCM is 296.25, 308.76, and 322.37 GWh, respectively. Since the proposed capacity is equally shared, the power potential across technologies is the same as the technological efficiency described in Table 5. However, the increase in installation cost of PVT/PCM is much higher than others because this technology involves a more complicated design that drives up the production cost. Therefore, the installation cost of PVT/PCM is 43.73% and 17.34% more than that of conventional PV and PV/PCM modules. In general, about 296 to 322 GWh can be generated from the “equally sharing capacity” scenario, and the result depends on the technology selected and how much the government is willing to invest.
Cost (Million US$) and Power Generation (GWh) Under Equally Sharing Capacity.

Scenario II: Unequal capacity across cities
While equally, sharing capacity ensures equity across cities, a loss of energy generation would occur because the city with the least power potential would also participate, thereby reducing the total power generated from other cities. In this scenario, we suppose the power generation is as important as the equity issue, and the installation of the panels should also take the local characteristics into account. Thus the number of panels installed in each city depends on the weight of the combination of local sunny hours and radiation strength. For example, since in Nanchang city per square meter power potential is higher than that in Jiujiang city, 195,800, panels will be installed in Nanchang and 187,000 panels will be installed in Jiujiang. Based on the assumption, the city-level power potential and the installation costs are estimated and displayed in Table 7.
Cost (Million US$) and Power Generation (GWh) Under Unequal Sharing Capacity.

It is not surprising that the total solar generation in this scenario is higher than that in the equal sharing panel scenario because cities with greater power potential are now installing more solar panels. With this implementation, the energy generation from the conventional PV, PV/PCM, and PVT/PCM systems slightly increases to 298.67, 311.28, and 325 GWh, respectively. The total installation cost remains the same because per panel cost is not changed and the total number of panels used does not vary. This result implies that a tradeoff between equity and efficiency does exist and thus the government should always take this relationship into account.
Scenario III: Capacity for Top 5 cities with greatest solar potential
In this scenario, we further assume that the priority of the solar energy development is purely on the maximal production of renewable energy rather than on the city-wide equity, and under such circumstances, the panels will be merely installed in five cities with the highest power potential. The result is displayed in Table 8. The power generation of the conventional PV system will further increase by 5.7% to approximately 313 GWh, with 326.3 GWh for PV/PCM and 340.6 GWh for the PVT/PCM module. The result shows that the power potential of PVT/PCM is 30.44% higher than that of the conventional PV system, with only 18.36% more investment requirement, implying that PVT/PCM is more cost-effective than the conventional PV system.
Cost (Million US$) and Power Generation (GWh) From High-Radiation Cities.

Total Investment Scenarios
Unlike the “total capacity” policy, in this section, we introduce the influence of budget constraints on Jiangxi’s solar energy development, and three scenarios that discuss the allocation of government investment on solar panels will be investigated.
Scenario IV: Equally sharing investment
The Jiangxi province has proposed an investment of $94 million on solar energy development in 2019. Since the production and installation costs among solar technologies are different, the total installed capacity would also vary. The production and installation cost for the 40 W conventional PV, PV/PCM, and PVT/PCM is $12.48, $15.24, and $17.89, respectively. Given the budget constraint of $94 million, the total number of panels that can be installed is 7.55 million for the conventional PV, 6.16 million for the PV/PCM, and 5.25 million for the PVT/PCM modules. Accordingly, the power generation from the conventional PV, PV/PCM, and PVT/PCM is 1,669, 1,419, and 1,263 GWh, respectively.
Under the “fixed investment” policy two points merit more discussion. First, the total power generation in the “fixed investment” policy is much higher than that in the “total capacity” policy because the investment from this policy is much greater, and thus more panels can be installed. Second, the power generation from the PV/PCM and PVT/PCM is lower than that from the conventional PV module because the installation cost of these two modules is much higher. The result implies that the influence of policies on solar energy development could be substantial, and thus determination of the prior policy in advance is important to achieve efficient development of solar energy (Table 9).
Cost (Million US$) and Power Generation (GWh) Under Equally Sharing Investment.

Scenario V: Unequally sharing investment
In this scenario, since the total investment is bounded, the number of solar panels of each system is the same as the first scenario; however, the distribution of the panels in each city will be different, depending on the solar energy potential of the city. Under such circumstances, the power generation from the conventional PV, PV/PCM, and PVT/PCM is 1,683.13, 1,431.23, and 1,273.55 GWh, respectively. It is obvious that the net solar energy generation increases slightly, but the energy efficiency of the conventional PV is still 15% higher than the PV/PCM and 25% higher than the PVT/PCM. The result also indicates that a substantial reduction of solar energy in the Jian city is expected because its radiation strength is relatively lower than in other cities. Thus the panels originally installed in Jian city will be distributed to others, and thus we can see that the increase in total solar energy production comes from the cities with the most potential cities. The results are presented in Table 10.
Cost (Million US$) and Power Generation (GWh) Under Unequal Equally Sharing Investment.

Scenario VI: Investment in Top 5 cities with greatest solar potential
In this scenario, we see that if the government aims to maximize the total solar energy production, installing all solar panels in the cities with the highest power potential would be desirable. If this is the case, the conventional PV would yield 1,763.5 GWh of electricity per year or 1,499.9 GWh from PV/PCM or 1,334.5 GWh from PVT/PCM. The results are displayed in Table 11. It is worth noting that in such a scenario, the power generation is highest among the six scenarios, but the equity issue is greatly ignored because for cities with relatively lower radiation strength, no panels can be installed and no subsidy will be expected.
Cost (Million US$) and Power Generation (GWh) Under-Investment Sharing in Five Cities.

Discussions and Policy Implications
This study investigates the solar power generation in Jiangxi province by the application of three technologies, along with a discussion on two alternative policies to understand the influences of distribution of solar panels on net power potential. By comparing the scenarios there are useful insights that merit more discussions to offer the decision-makers more information for the large-scale development of solar energy.
Discussion
Climate change impacts
Fossil fuels are used for electricity production across the world and such utilization releases substantial CO2 emissions that speed up global climate change. While solar energy provides a pathway to mitigate climate change, the influences of climate impacts on regional characteristics may also be incorporated. For example, the GHG emissions would stay in the atmosphere for hundreds to thousands of years, and this means that a gradual increase in the global temperature would be expected, implying a different climate pattern from the past. In this study, the sunny hour used to estimate the power potential is based on the historical average, but this measure may vary significantly in the future because the climate conditions are likely to be affected by the climate change occurring today. Therefore, future studies might take the climate impacts into account so that the solar energy potential could be appropriately forecasted.
Technology innovation on solar power system
The development of solar energy is continuously undergoing innovation and discoveries. As we move toward a more eco-friendly future, the pioneers in this field are looking for more and more affordable solutions to harness its potential to the highest. In the past few years, we have seen a lot of milestones in solar energy storage, wearable solar tech, solar efficiency, and even solar design tech. One dominant innovation called concentrated solar power (CSP) demonstrates that a substantial cost reduction in solar energy production may be expected shortly. The IRENA (2020b) points out that in 2025 the per kW cost associated with renewable energy agency investment would decrease from $1,810 to $790, and the levered cost of electricity could be reduced from $0.13 to $0.06 kWh.
The capital acquisition could be important for system installation
This study also shows that capital requirement for solar energy development is considerable, and thus how to use the funds efficiently is keyed to the successful development of renewable energy. Since the useful life of a solar panel is usually between 10 and 20 years, we need to allocate the investment to its useful life so that the costs and benefits from solar energy systems can be properly matched.
To analyze the influences of borrowing rates on cost allocation, this study considers three interest rates for the borrowing period of 10-year. The result is displayed in Table 12. In general, with a lower borrowing rate, the annual cost associated with the solar system would reduce substantially. Additionally, under the “fixed investment” policy that will invest $94 million in solar system installation, the annual investment is only $11.59 million. If this is the case the fiscal burden of the system installation could be greatly reduced, thereby stimulating the development of solar energy.
Investment and Amortization in 10 years.

The result also indicates that the firm’s balance sheet and income statement would be improved because by matching the revenues to the installation cost the fluctuation in net income can be alleviated. Taking 10% borrowing rate as an example, by selling the 190 million kWh for 12.5 cents/kWh, the potential revenue from solar energy is approximately $23.75 million and the annualized cost is estimated to be $15.3 million, and thus the annual net income could be stabilized at $8.45 million. If the borrowing rate decreases further to 6% and 4%, the net income would increase by $2.53 million to $3.71 million, respectively.
Policy Implications
Based on the discussions of the insights and results, several useful policy suggestions could be derived for decision-makers to design or promote the more appropriate policies so that the local characteristics can be well embedded to improve solar energy development:
(1) The subsidy is keyed to renewable energy development. Usually, renewable energy has priority to connect to the grid at a higher than ongoing market price because renewable energy is promoted to improve energy and environmental security. Meanwhile, the Chinese government often provides low-interest loans or subsidies to firms that develop various renewable energy. For example, in Jiangxi, the average annual interest rate of the borrowing is about 10%, and if the government can provide a low-interest loan, then it will reduce the firm’s interest payment by approximately $3.13 million per year, and this saving would be enjoyed throughout the lifetime of the project.
(2) Establishment of the emission trade market. Renewable energy could offset CO2 emissions, but to realize the monetary benefits of emission reduction requires a mature emission trade market; otherwise, no firm can receive any return from emission reduction. In China, there is no such market and the firms are unable to capture the benefits from the emission reduction associated with renewable energy development, implying a lower economic incentive for firms because only revenues from energy sales can be realized. This situation could be even worse when the emission price increases. For example, in the European Union, the emission price has increased from about €5 in 2016 to more than €25 in 2019, and this value from emission trade cannot be received by any Chinese firms. Therefore, to encourage the development of solar energy (and other renewable alternatives) the establishment of an emission market to turn emission offset into revenues might be the ultimate priority to the country.
(3) Capacity first or Capital first does matter. We use multiple scenarios to demonstrate that the solar power potential could be greatly affected by policies. Since the government officers have not proposed a final plan regarding the installation of the system, the Jiangxi province therefore would not be able to explore its actual solar energy potential. For example, in the “fix capacity” policy the investment required for solar energy development is only one-fifth of that in the “fixed investment” policy. Given the same panel cost, the net power potential would also vary significantly, and thus the policy must be determined in advance so that the industry can estimate the net benefits before they invest valuable capital.
Conclusions
In this study, we have analyzed three technologies such as conventional PV, PV/PCM, and PVT/PCM for energy generation in Jiangxi province. This study explores the economic viability and energy generation from each technology under six different scenarios so that the results help researchers and policymakers to understand the general picture of the large-scale development of solar energy
To avoid the fluctuation of sunny hours across years, we use the average climate data from 2009 to 2019 and perform a basic analysis of solar energy potential in Jiangxi province. After that this study discusses two sets of policies, for which the first set is the “fixed installation capacity” and the second one is the “fixed government investment.” The results show that under the “fixed capacity” policy if the equity is taken into account, the power potential for the conventional PV, PV/PCM, and PVT/PCM is 296.25, 308.76, and 322.37 GWh, with the installation cost of $24.90, $30.50, and $35.79 million, respectively. The result would change substantially under the “fixed investment” scenarios, in which the annual solar power from conventional PV is more than 1,736 GWh while PV/PCM and PVT/PCM can potentially generate 1,499.9 and 1,334.5 GWh annually if the investment is made in five cities having the greater sunny hours. If energy security is a more ultimate concern of the government, then power generation could be greatly increased, but some of the cities would encounter losses, subsidy helps to potential improvement in employment and reduce the losses.
In general, the PV/PCM and PVT/PCM are more efficient in converting the solar radiation into electricity, but their production and installation costs are also much higher than that of conventional PV, and thus if budget constraint does exist, their completion power would be reduced. In addition, while the large-scale development of PV/PCM and PVT/PCM is not currently viable because of the complexity in installation, they may be feasible shortly when innovations are made to reduce production costs. Another limitation to this study is that if we take the uncertain climate impacts into account, the sunny hours will no longer be based on the historical data, and thus a proper prediction of the future climate pattern will be necessary to explore the true energy potential. Solar radiation strength also plays an important role to produce electricity. Since it generally differs from city to city, its influence on power generation potential should be carefully assessed. Finally, the cost of each technology could vary substantially and thus the regional conditions should be incorporated to explore the net benefits.
Supplemental Material
sj-docx-1-sgo-10.1177_21582440221108166 – Supplemental material for A Techno-Economic Analysis of Solar Energy Developmental Under Competing Technologies: A Case Study in Jiangxi, China
Supplemental material, sj-docx-1-sgo-10.1177_21582440221108166 for A Techno-Economic Analysis of Solar Energy Developmental Under Competing Technologies: A Case Study in Jiangxi, China by Muhammad Aftab Rafiq, Liguo Zhang and Chih-Chun Kung in SAGE Open
Footnotes
Declaration of Conflicting Interests
The author(s) declared no potential conflicts of interest with respect to the research, authorship, and/or publication of this article.
Funding
The authors thank for the financial support of National Natural Science Foundation of China (72073054; 41861042; 72163006).
Supplemental Material
Supplemental material for this article is available online.
References
Supplementary Material
Please find the following supplemental material available below.
For Open Access articles published under a Creative Commons License, all supplemental material carries the same license as the article it is associated with.
For non-Open Access articles published, all supplemental material carries a non-exclusive license, and permission requests for re-use of supplemental material or any part of supplemental material shall be sent directly to the copyright owner as specified in the copyright notice associated with the article.