
Abstract
One of the questionnaires that will be used to evaluate social learning environments such as Facebook is the Online Social Learning Environment Instrument (OSLEI). The aim of this study was to evaluate the OSLEI using alternative method of analysis via Rasch model toward 49 undergraduate students in Malaysia. To date, no study has evaluated the OSLEI through the lens of Rasch model analysis among Malaysian samples. Firstly, the OSLEI underwent content validation by three experts. The results of the overall percent agreement on eight constructs (perceived usefulness, usage of learning groups, learning outcomes, affective outcomes, self-efficacy, trust, privacy, and teaching member presence) of the OSLEI was 86% for 48 items. Next, 10 measurement properties of Rasch model analysis were employed with the OSLEI. The results revealed that 23 respondents needed to be dropped. Subsequently, the data from the remaining 26 respondents proceeded to Rasch Model analysis of the 43 items in the OSLEI. The results of the item analysis revealed that 13 items and the construct of privacy needed to be dropped. The findings demonstrated that 35 items were robust, valid, and reliable, and could be used to measure online social learning environments.
Introduction
In recent years, the Coronavirus disease 2019 (COVID-19) pandemic has necessitated that most teaching and learning activities be conducted via online learning platforms (Ali, 2020; Daniel, 2020; Lapitan et al., 2021). The learning environment may potentially impact the effectiveness of such activities, especially during the current difficulties. One of the online learning environments identified thus far is the online social learning environment, which has been described in Chawinga’s (2017) work. This term refers to an environment in which students can share knowledge and information, co-create content, and disseminate resources among their peers and lecturers, whereby they are equipped with the ability to control and manage their own learning progress. Furthermore, it allows them to undertake sharing sessions and discussions on pertinent information with their peers and lecturers, which can occur in either a formal or an informal setting.
Accordingly, Raspopovic et al. (2017) have revealed that the social learning environment can offer an interactive learning space for student-teacher communication. Similarly, students are motivated by its presence to engage in active learning through collaborative problem-solving tasks, which is possible via the implementation of the appropriate pedagogical methods. In particular Noyens et al. (2019) emphasized the importance of such learning environments due to their capability to foster students’ social integration, thereby supporting the learning process of less-motivated students throughout the educational field.
Theoretically, the incorporation of online social learning environments is possible by utilizing various social learning tools. Tangentially, social networking tools such as Twitter, Facebook, Myspace, and Instagram allow researchers the space to conduct research and assess the implementation of such tools as a platform for learning, especially in view of the multitude of different emerging online social learning tools. Facebook, in particular, is one of the most popular social networking tools; this is reflected in the growing body of research and interest dedicated to online learning in the educational field in the context of this platform as an online social learning environment. According to Giannikas (2020), Facebook consists of interactive elements that are conducive to a learning environment for tertiary education. Similarly, scholars such as Jumaat et al. (2019) have underlined its status as a platform that advocates social interactions and meaningful learning. Thus, Facebook is undeniably proven to offer extensive potential for the purpose of online learning.
During COVID-19, Facebook has emerged as one of the most widely utilized alternative tools for conducting online teaching and learning activities (Docimo et al., 2020; Mbatha, 2020). Its usage in such activities throughout this period is deemed highly attractive according to many educators and students, especially those hailing from educational institutions (Azlan et al., 2020; Chung et al., 2020). The platform is denoted as being capable of facilitating student-instructor interactions; Facebook offers a new, all-encompassing, and exciting learning climate for students and instructors, as well as serving as an alternative platform to enable students to collaborate on any subject matter (Lee et al., 2021). Concurrently, student participation (Camus et al., 2016) and peer-to-peer learning (Dalsgaard, 2016) are encouraged via this tool.
Moreover, previous scholars such as Wu and Chen (2015) and Ahern et al. (2016) are among those who have underlined positive findings pertaining to the use of Facebook for teaching and learning purposes. In light of its potential use in the online social learning environment, a robust instrument is necessary to measure its function as an online social learning environment. One such instrument is a questionnaire proposed by Hong and Gardner (2014) to measure online social learning environment, which has been tested using statistical analysis, such as Confirmatory Factor Analysis (CFA). Its reliability and validity have been ascertained using Cronbach’s alpha values, Exploratory Factor Analysis (EFA), and CFA, which are widely employed methods for such assessment.
Cronbach’s alpha values, EFA, and CFA were used to validate the online social learning environment instrument in a previous study, and the results showed that it was appropriate for the selected samples. Cronbach’s alpha values, EFA, and CFA, on the other hand, do not deal with measurement quality at the item level because neither analysis used a rigorous and comprehensive analysis like the Rasch model analysis (Embretson & Hershberger, 1999; Park et al., 2021).To overcome the limitations of Cronbach’s alpha values, EFA, and CFA, Rasch model analysis was utilized to assess the items in the current study, which builds on Hong and Gardner’s (2014) questionnaire, dubbed the Online Social Learning Environment Instrument (OSLEI).
To date, no studies have successfully evaluated the above mentioned questionnaire by utilizing Rasch model analysis. This type of analysis may offer a robust assessment that can be used with a small sample, thus providing a detailed evaluation of the study respondents and item analysis. For example, Vogel and Engelhard (2011) opted to incorporate a sample size of just 44 participants for their examination of two instructional approaches for teaching and learning French grammar by employing Rasch model analysis. When dealing with small sample sizes in Rasch analysis, one of the potential concerns is that it is less precise, and item calibration instability may arise. However, O’Neill et al. (2020) discovered that in Rasch analysis, lowering sample size has little influence on person-ability estimation.
Similarly, Rasch model analysis has been undertaken in several studies to establish the validity and reliability of the questionnaires incorporated. The scholars and their respective works include the following: Che Lah et al. (2021) evaluated an online problem-solving skills inventory (OPSI) among 49 samples, while Clinton et al. (2014) examined Ethical Issues Scale (EIS) among 59 samples. According to their findings, Rasch model analysis is a powerful tool for establishing validity and reliability with small sample size. Thus, the current study opts to evaluate the OSLEI by using evidence from Rasch model analysis that focus on applied measurement in education.
Practically, this work aims to evaluate the OSLEI via the use of comprehensive techniques, whereby robust evidence is obtained by implementing Rasch model analysis. Interestingly, it will contribute to the evaluation of the questionnaire and it has had a significant impact on the literature across different contexts; in particular, the study identifies which respondents are fit to participate in the OSLEI assessment, identifies redundant items in the instrument, confirms its constructs, reports on its item and respondent reliability, and ascertains which items can be deemed robust and valid.
Literature Review
Online Social Learning Environment Instrument (OSLEI)
Hong and Gardner (2014), as the pioneers of this instrument, proposed a questionnaire to measure Facebook as a social learning environment for teaching and learning purposes. Eight dimensions were thus measured using a total of 45 items, namely perceived usefulness (5 items), usage of learning groups (13 items), learning outcomes (7 items), affective outcome (4 items), self-efficacy (6 items), trust (3 items), privacy (3 items), and teaching member presence (4 items). Then, the validity and reliability of the original instrument were reported by using the values generated from CFA, Composite Reliability (CR), Average Variance Extracted (AVE), Cronbach’s alpha, and discriminant validity index. The instrument was evaluated using a sample of 258 students enrolled in the University of Auckland with a commerce background.
The scholars then revealed that all reliability, average variance extracted, and Cronbach’s alpha values achieved acceptable construct validity and reliability (Hong & Gardner, 2014). According to Awang (2015), the minimum value for composite reliability is .6 and the average variance extracted is .5. Accordingly, the values generated by the constructs for both elements are as follows: perceived usefulness (CR = .909, AVE = .715), usage of learning groups (CR = .89, AVE = .576), learning outcomes (CR = .924, AVE = .634), affective outcome (CR = .879, AVE = .644), self-efficacy (CR = .909, AVE = .633), trust (CR = .908, AVE = .832), privacy (CR = .878, AVE = .707), and teaching member presence (CR = .838, AVE = .721).
Hong and Gardner (2014) also reported the Cronbach’s alpha values obtained, which were as follows: perceived usefulness (.867), usage of learning groups (.852), learning outcomes (.904), affective outcome (.816), self-efficacy (.871), trust (.798), privacy (.792), and teaching member presence (.613). Besides, the instrument yielded discriminant validity values indicating that no constructs were redundant, namely perceived usefulness (.845), usage of learning groups (.759), learning outcomes (.796), affective outcome (.803), self-efficacy (.814), trust (.912), privacy (.841), and teaching member presence (.849).
However, several limitations have been highlighted regarding the validity and reliability of the original instrument. First, the previous analysis required a large sample. This is a requirement of CFA, for which the minimum sample size is between 100 and 150 depending on the number of constructs. Second, CFA assesses each item without eliminating unfit respondents from the analysis, thus rendering the analysis less comprehensive and robust than Rasch model analysis. Moreover, Hong and Gardner’s (2014) instrument has been revealed to contain redundant double-barreled items.
Therefore, this study modifies the instrument proposed by Hong and Gardner (2014), which is then named the Online Social Learning Environment Instrument (OSLEI). The OSLEI consists of two parts (Parts A and B) and includes several adjustments, such as the addition of new infographic items. Furthermore, the inclusion of several items with a specific element allows the measurement of the online social learning environment in Part B, while some items are modified due to their double-barreled property. To date, an evaluation of the OSLEI has yet to be undertaken using a Malaysian sample via Rasch model analysis implementation, rendering this work critical to ensure that it is a more valid and robust instrument following its analysis using such a powerful method.
Rasch Model Analysis
Rasch (1966) is a Danish mathematician who is credited for developing the Rasch measurement model as a special case of the general linear model (GLM). The Rasch model is based on the Item Response Theory (IRT), which allows the calculation of the probability of correct responses to the test items and the strength of endorsement for the rating scale items (Shea et al., 2012). The model analysis thus serves as a powerful and comprehensive method, establishing the instrument’s validity and reliability and providing a detailed analysis of the respondents who complete the instrument. Similarly, respondents who have yet to answer the questionnaire can also be easily detected. Rasch model analysis can also easily classify fit respondents based on their level into several categories with Rasch probability.
Furthermore, the Rasch measurement model is capable of transforming ordinal data to ratio data, allowing data to be obtained for many types of appropriate analyses. This is attributable to the data being of the highest-ranking type for analysis. Moreover, Rasch model analysis could increase the questionnaire validity for conducting research. Besides that, Rasch model analysis also could categorization of each item in the questionnaire used into several levels, such as easy, moderate, and difficult items. Concurrently, the Rasch model analysis permits the detection of redundant items and the rating scale in the questionnaire, while also revealing the Cronbach’s alpha value, item reliability, and person reliability. Thus, Rasch model analysis is justifiably named as a powerful tool geared for establishing the reliability and validity of questionnaires.
In theoretical terms, subjecting instruments to Rasch model analysis is an increasingly popular method for education-based works, particularly in educational filed (Bode & Wright, 1999). To date, a multitude of studies has implemented this method in education and online learning-focused contexts, such as Lah and Tasir’s (2018) validity and reliability measurement of an online social presence questionnaire. Meanwhile, Yang et al. (2018) assessed an instrument which measures Grade 4 to 8 students’ understanding of interdisciplinary science throughout multiple semesters. Yan’s (2018a, 2018b) work validated the self-assessment practice scale (SaPS). Meanwhile, the psychometric properties of the Motivated Strategies for Learning Questionnaire (MSLQ) were evaluated by Bonanomi et al. (2018) among high school students, whereas Toland et al. (2021) evaluated the Assessment, Evaluation, and Programing System Test—Third Edition (AEPS-3). Other comparable studies also include Rahayu et al.’s (2021) validation of an Indonesian version of the “What is happening in this Class?” (WIHIC) questionnaire. In brief, these prior works have revealed that Rasch model analysis is a powerful analytical tool capable of providing valid, reliable, and robust items for their respective instruments.
Furthermore, evaluation of instrument utilization has gradually been deemed acceptable with Rasch model analysis in the field of applied measurement in education, as evidenced by the works of authors such as Abbakumov et al. (2020) who explored formative assessments in MOOCs, Randall and Engelhard (2010) who measured high stakes reading assessment and DeMars (2021) who conducted Violation of Conditional Independence in the Many-Facets Rasch Model.
According to Bond and Fox (2007), Rasch model analysis is a comprehensive assessment tasked with probing the validity of an instrument. Coe (2008) and Wilmot et al. (2011) are of the opinion that its incorporation offers evidence of the relationship between questionnaire items and the respondents. Its analysis encompasses elements such as rating scale, items, persons, and other facets, such as raters (Pomeranz et al., 2008). Alternatively, Tennant and Conaghan (2007) have listed 11 measurement properties of Rasch model analysis as follows: (i) model chosen, (ii) appropriate ordering categories, (iii) fit of items, (iv) fit of person, (v) summary statistics, (vi) local independence of items, (vii) response dependency, (viii) unidimensionality, (ix) presence of Differential Item Functioning (DIF), (x) targeting of the scale, and (xi) person separation reliability.
In light of the empirical evidence identified by conducting validity and reliability testing via Rasch model analysis, scholars have been driven to employ this method to evaluate their instruments. Examples of such scholars and their works include Rahayu et al. (2021) and Eddy et al. (2021). Performing the analysis renders it easier for researchers to trace the respective responses of respondents to specific items and the manner in which each item can fit or is suitable for the questionnaire. Thus, this study employs Rasch model analysis to evaluate the OSLEI as alternative method, thereby addressing the gap in the literature with regard to the application of this method to establish robust items in the instrument. This will generate a powerful method to establish validity and reliability of questionnaire.
Method
Instrument
This study adapted a questionnaire from Hong and Gardner (2014), with some adjustments made to several items, and thus renamed it as the OSLEI. It includes two parts—Part A and Part B—which denote the sections on Demographics and Online Social Learning Environment, respectively. Part B consisted of eight constructs, namely: (i) perceived usefulness (4 items); ii) usage of learning groups (8 items); (iii) learning outcomes (7 items); (iv) affective outcome (4 items); (v) self-efficacy (10 items); (vii) trust (3 items); (vii) privacy (3 items); and (viii) teaching member presence (4 items). A 5-point scale was thus employed for the respondents to answer each item as follows: 1 = Strongly Disagree, 2 = Disagree, 3 = Somewhat Disagree, 4 = Agree, and 5 = Strongly Agree. A summary of the constructs and items included in the OSLEI’s Part B is provided in Table 1.
Constructs and Items in Part B.

Software
Two software programs were utilized in this study, namely IBM’s Statistical Package for Social Sciences (SPSS) and WINSTEPS software version 3.72. The first program was employed to analyze Part A of the OSLEI (i.e., frequencies and percentages), while the second program undertook the assessment of the 10 measurement properties in the Rasch model analysis in Part B.
Procedure of Analysis
Content analysis of the OSLEI was first performed by three experts, following which items in Part A were subjected to descriptive analysis while Rasch model analysis was performed on items in Part B which employed rating scales items which are the respondents need to answer five-point scale such as 1 = Strongly Disagree, 2 = Disagree, 3 = Somewhat Disagree, 4 = Agree, and 5 = Strongly Agree. The 10 measurement properties of Rasch model analysis evaluated included: (i) person infit mean-square (MNSQ), (ii) person infit z-standardized (ZSTD), (iii) person point measure correlation, (iv) item infit MNSQ, (v) item infit ZSTD, (vi) item point measure correlation, (vii) item measure value, (viii) standardized residual correlation, (ix) dimensionality, and (x) summary statistics.
In this study, the misfit respondents were analyzed by using three measurement properties, namely person infit MNSQ, person infit ZSTD, and person point measure correlation. Once they were identified, they were dropped, while the remaining fit respondents would proceed with item analysis. Here, item infit MNSQ and item infit ZSTD were performed on the OSLEI, whereby the item point measure correlation was then carried out after the items were deemed fit. Next, singling out redundant items was ensured by assessing the measurement properties of item measure value and standardized residual correlation on the instrument, followed by unidimensionality evaluation to ensure its validity in measuring the element requiring measurement. Subsequently, the reliability of the items and respondents in the OSLEI was reviewed by using summary statistics.
Measurement Properties of Rasch Model Analysis
In this work, the OSLEI was subjected to the 10 measurement properties of Rasch model analysis and the resulting outcomes are detailed in Table 2.
Measurement properties of Rasch model analysis in OSLEI.

Participants
The OSLEI was administered to the study participants and the first part of the questionnaire gathered their demographic information, such as gender, experience in online learning, and experience of using Facebook for teaching and learning purposes. However, Rasch model analysis was not employed for these demographic items. According to Linacre (1994), performing Rasch model analysis necessitates a minimum requirement of five to six respondents per instrument. Therefore, a total of 49 undergraduate students (18 males and 31 females) enrolled in one course, namely a multimedia applications and web design course at a university in Malaysia, were selected as the study sample by using a purposive sampling technique. According to Etikan et al. (2016) the purposive sampling techniques also known as judgement sampling, it is intentional choice based on the included qualities of the participants. The rationale of using purposive sampling in this study is to focus on particular characteristics of a population that are of interest.
The inclusion criteria for respondents for this study selection included: (i) enrolment in a computer-based subject, (ii) being equipped with any experience in an online learning environment, and (iii) experience of using Facebook in teaching and learning activities. These criteria have been chosen since this study focused on particular characteristics of samples. Demographic results subsequently revealed that all respondents (100%) had experience with online learning and used Facebook for teaching and learning purposes.
Results
Percent Agreement Validity of the OSLEI
The content validity of OSLEI was determined by consulting three educational technology specialists, all of whom were senior academics at one of Malaysia’s institutions. Their selection was based on their extensive teaching experience of more than 15 years, as well as their standing as specialists in online learning. As a guideline, percent agreement was utilized to achieve the assessor scores as per the suggestion of Nordin and Bakar (2008). The scores given by the assessors to evaluate the constructs are: 1—items unsuitable for measurement, 2—measurable item, and 3—item requiring improvement. Here, the percent agreement outcome for each construct is as follows: perceived usefulness (100%), usage of learning groups (83%), learning outcomes (62%), affective outcome (100%), self-efficacy (60%), trust (100%), privacy (100%), and teaching member presence (83%). Furthermore, the overall percentage agreement validity of the OSLEI is 86%. Table 3 displays the details of the instrument’s percentage agreement
Percent-Agreement OSLEI.
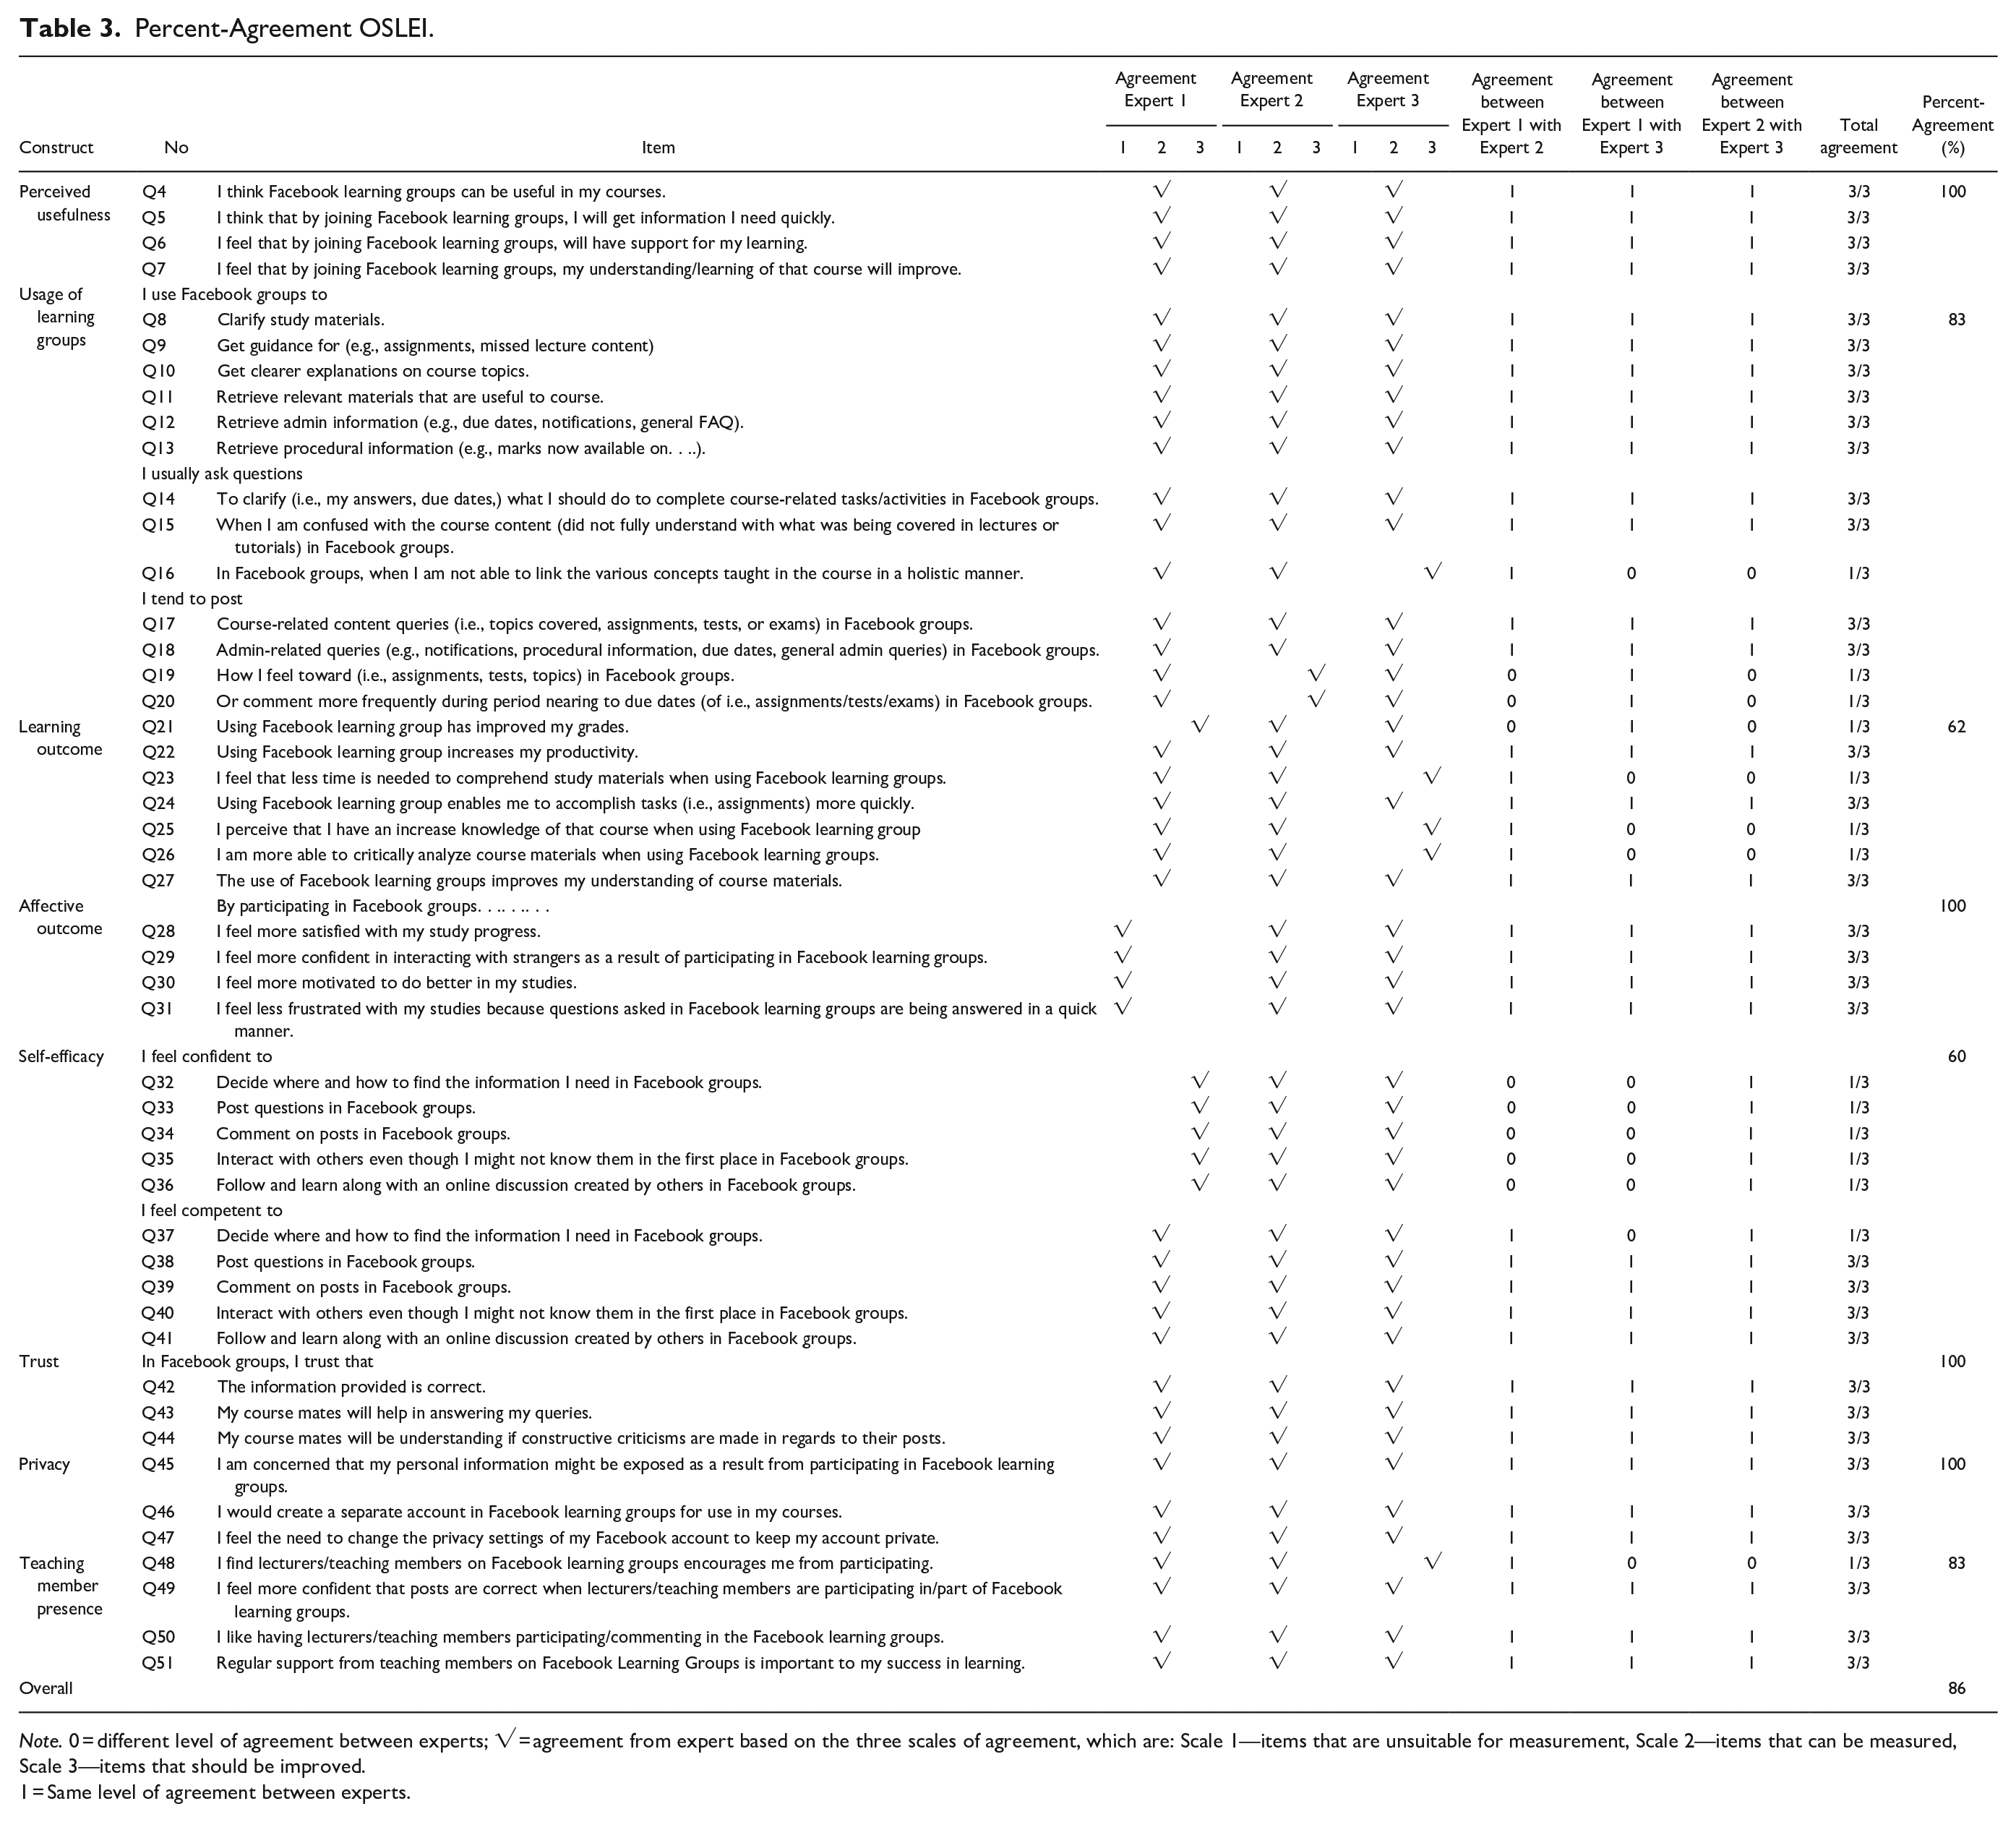
Note. 0 = different level of agreement between experts; √ = agreement from expert based on the three scales of agreement, which are: Scale 1—items that are unsuitable for measurement, Scale 2—items that can be measured, Scale 3—items that should be improved.
1 = Same level of agreement between experts.
Person infit MNSQ and ZSTD of the OSLEI
Table 4 displays the results of person infit MNSQ and ZSTD. The values from the first analysis revealed that eight respondents should be dropped due to their non-adherence to the person infit MNSQ and ZSTD criteria. The respondents were: respondent number 6 (MNSQ: 7.54, ZSTD: 9.9), respondent number 37 (MNSQ: 2.96, ZSTD: 6.3), respondent number 21 (MNSQ: 2.24, ZSTD: 4.9), respondent number 12 (MNSQ: 1.86, ZSTD: 4.1), respondent number 3 (MNSQ: 1.79, ZSTD: 2.6), respondent number 18 (MNSQ: 1.64, ZSTD: 2.2), respondent number 10 (MNSQ: 2.96, ZSTD: 6.3), and respondent number 28 (MNSQ: 1.61, ZSTD: 2.1).
Summary for Person Infit MNSQ and ZSTD of OSLEI.

Note. MNSQ = Mean square, 0.4 < x < 1.5; ZSTD = z-standard, − < x < +2.
Furthermore, another 14 respondents were to be dropped due to their non-adherence to the person infit ZSTD criteria. They were: respondent number 39 (ZSTD: −2.2), respondent number 38 (ZSTD: −2.4), respondent number 35 (ZSTD: −2.2), respondent number 16 (ZSTD: −3.3), respondent number 29 (ZSTD: −3.0), respondent number 30 (ZSTD: −2.5), respondent number 1 (ZSTD: −3.7), respondent number 32 (ZSTD: −3.7), respondent number 31 (ZSTD: −4.0), respondent number 19 (ZSTD: −4.5), respondent number 41 (ZSTD: −4.4), respondent number 42 (ZSTD: −5.4), respondent number 25 (ZSTD: −4.0), and respondent number 44 (ZSTD: −4.5).
In the second analysis, only one respondent needed to be dropped due to non-adherence to the person infit MNSQ and ZSTD criteria (respondent number 4; MNSQ: 1.53, ZSTD: 3.0). According to Linacre (2002) and Wright et al. (1994), the recommended value for the person infit MNSQ should be within the range of 0.4 < x < 1.5, whereas Aziz et al. (2013) have suggested that the value of person infit ZSTD should be within the range of −2 to +2. In total, 23 out of 49 respondents were removed from the analysis because they yielded values outside the range of the criteria above.
Person Point Measure Correlation of the OSLEI
The remaining 26 respondents retained in the study were then subjected to person point measure correlation in the OSLEI, which yielded interesting outcomes. In particular, all 26 values generated by these respondents were positive, meaning that they were retained for the subsequent process. Aziz et al. (2013) have suggested that the value of the person point measure correlation should be positive for person polarity. Table 5 depicts the results of the person point measure correlation in the OSLEI, whereby all 26 respondents proceeded with item analysis accordingly.
Person Point Measure Correlation of OSLEI.

Note. Point measure correlation = positive value.
Item Infit MNSQ and ZSTD in the OSLEI
An assessment for the item infit MNSQ and ZSTD in the OSLEI (i.e., 48 items in Part B) was performed based on the 26 respondents retained thus far. The first analysis revealed that six items should be dropped due to non-adherence to the item infit MNSQ and ZSTD criteria, specifically three, two, and one items non-adhering to the item infit MNSQ and ZSTD, item infit MNSQ, and item infit ZSTD, respectively. The three items that were non-adherent to the item infit MNSQ and ZSTD criteria were: item number Q47 (MSNQ: 2.15, ZSTD: 2.9), item number Q46 (MSNQ: 2.24, ZSTD: 3.7), and item number Q45 (MSNQ: 1.77, ZSTD: 2.1). Meanwhile, the two items that were non-adherent to the item infit MNSQ criteria were: item number Q10 (MSNQ: 1.58) and item number Q15 (MSNQ: 1.52), whereas the one item non-adherent to the item infit ZSTD criteria was item number Q37 (ZSTD: −2.6).
According to Linacre (2002) and Wright et al. (1994), the range of item infit MNSQ values should be within 0.4 < x < 1.5, whereas the value of item infit ZSTD should be within −2 < x < +2, as suggested by Aziz et al. (2013). Thus, the privacy construct was dropped, because none of its items (i.e., Q45, Q46, and Q47) adhered to the criteria of item infit MNSQ and ZSTD. Table 6 shows the results of item infit MNSQ and ZSTD in the OSLEI that needed to be dropped.
Item infit MSNQ and ZTSD of OSLEI.

Note. MNSQ = Mean square, 0.4 < x < 1.5; ZSTD = z-standard, −2 < x < +2.
Item Point Measure Correlation of the OSLEI
The remaining 42 OSLEI items retained thus far were then subjected to item point measure correlation, which also indicated a positive value for all items. Thus, no items were dropped in this step. This echoes Aziz et al. (2013) statement that the point measure correlation for items analyzed should yield a positive value. Tables 7 and 8 below provides the results of item point measure correlation for all 42 items retained in the OSLEI.
Item Point Measure Correlation of OSLEI.

Note. Point measure correlation = positive value.
Summary of Item Measure Value in OSLEI.

Note. MNSQ = Mean square; ZSTD = z-standard.
Item Measure Value in the OSLEI
Next, the item measure values of all 42 retained OSLEI items were ascertained. This analysis identified the redundancy of some items. This was revealed following the measurement of the same items under one construct, yielding the same measure value. Accordingly, the results revealed that two items in the learning outcomes construct measured the same thing, namely Q23 “I feel that less time is needed to comprehend study materials when using Facebook learning groups” and Q24 “Using Facebook learning group enables me to accomplish tasks (i.e., assignments) more quickly.” Meanwhile, four items (i.e., Q9 “I use Facebook groups to get guidance for (e.g., assignments, missed lecture content,” Q11 “I use Facebook groups to retrieve relevant materials that are useful to course,” Q16 “I usually ask questions in Facebook groups, when I am not able to link the various concepts taught in the course in a holistic manner,” and Q18 “I tend to post admin-related queries (e.g., notifications, procedural information, due dates, general admin queries) in Facebook groups” were detected to measure the same thing in the usage of learning group construct, whereas two items (i.e., Q13 “I use Facebook groups to retrieve procedural information (e.g., marks now available on)”and Q20 “I tend to post or comment more frequently during period nearing to due dates (of i.e., assignments/tests/exams) in Facebook groups.” measured the same thing in the same construct. Moreover, items Q4 “I think Facebook learning groups can be useful in my courses” and Q7 “I feel that by joining Facebook learning groups, my understanding/learning of that course will improve” measured the same thing in the perceived usefulness construct.
The above outcomes proved the redundancy of several items, requiring them to be dropped. Identifying the retained items necessitated the implementation of criteria selection based on item infit MNSQ near to 1 and infit ZSTD near to 0 as per the recommendations of Aziz et al. (2013). Thus, items that were retained were items Q23 (infit MNSQ: 0.85, infit ZSTD: −0.5) and Q9 (infit MNSQ: 0.96, infit ZSTD: 0), whereas items Q13 (infit MNSQ: 0.85, infit ZSTD: −0.5) and Q20 (infit MNSQ: 0.85, infit ZSTD: −0.5) generated the same value for their infit MNSQ and infit ZSTD properties.
Furthermore, the selection of retained items is based on those generating a high value of item point measure correlation, namely items Q13 (0.29) and Q20 (0.59). Moreover, items Q20 (infit MNSQ: 0.85, infit ZSTD: −0.5) and Q7 (infit MNSQ: 1.05, infit ZSTD: 0.3) were also retained in line with the recommendations of Aziz et al. (2013), as shown in Table 7. However, six items were dropped due to non-adherence to the item measure value criteria, namely: item Q24 (infit MNSQ: 0.71, infit ZSTD: −1.1), item Q11 (infit MNSQ: 0.93, infit ZSTD: −2), item Q16 (infit MNSQ: 1.21, infit ZSTD: 0.8), item Q18 (infit MNSQ: 1.34, infit ZSTD: 1.2), item Q13 (infit MNSQ: 1.33, infit ZSTD: 1.1), and item Q4 (infit MNSQ: 0.83, infit ZSTD: −0.5). They were found to be misfits in the instrument based on the item measure value analysis.
Standardized Residual Correlations of the OSLEI
The subsequent step of standardized residual correlations was then undertaken for the remaining 36 items retained in the OSLEI. This analysis further proved that no items were redundant. According to Linacre (2002), this value should be <.7. Table 9 depicts the adherence of all items to this suggestion, except for items Q5 and Q6 (0.85). Thus, one of these items should be dropped. The selection of retained items was guided by the following criteria: the MNSQ should be close to 1 while the ZSTD should be close to 0 (Linacre, 2002). Thus, item Q5 (infit MNSQ: 0.96, infit ZSTD: 0) was retained, as it adhered to the criteria above, whereas item Q6 (infit MNSQ: 0.84, infit ZSTD: −4) was dropped due to its non-adherence. This was the only 1 out of 36 items to be dropped in this analysis.
Standardized Residual Correlations.
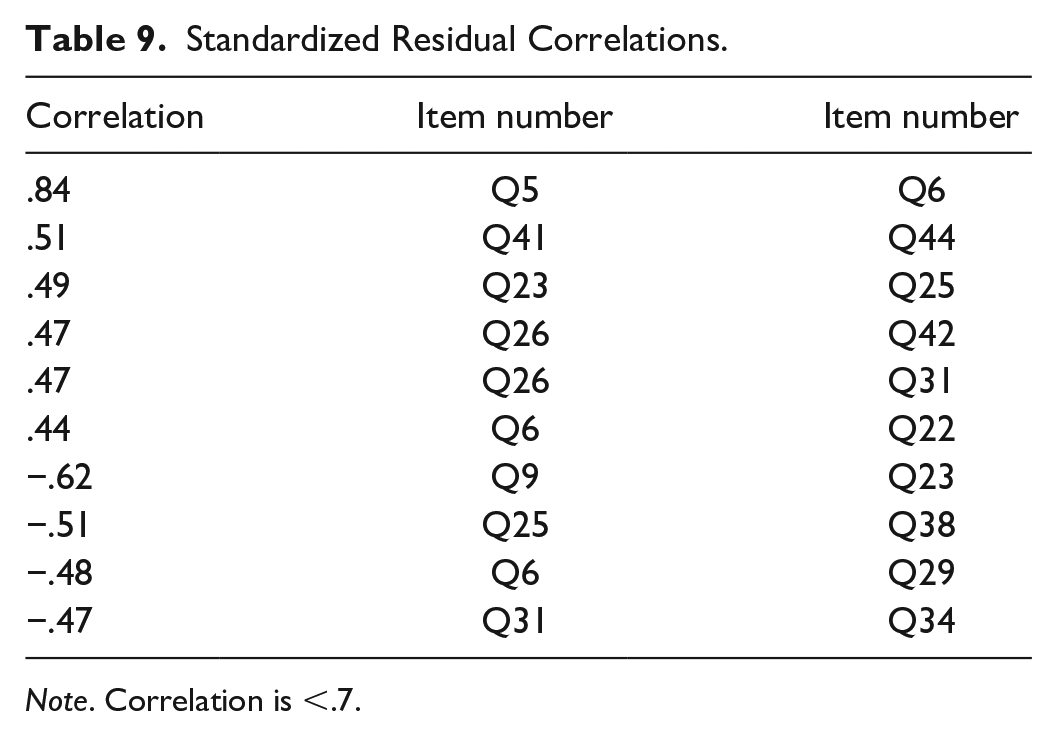
Note. Correlation is <.7.
Unidimensionality of the OSLEI
Next, all 35 retained items of the OSLEI proceeded to unidimensionality analysis, which would substantiate its accuracy in measuring the social learning environment. Here, the residual Principal Component Analysis (PCA) provided the percentages of raw variance explained by the measures and unexplained first contrast for the instrument. According to Fisher (2007), the value of the former element should be > 40% to ensure the instrument’s validity in terms of measuring what it is supposed to measure, whereas the suggested value of the latter element is <15%. As such, the results obtained revealed that the raw variance explained by the measures was 39.2%, while the unexplained first contrast was 9.7% prior to Rasch model evaluation of the OSLEI, whereas these values were increased and decreased, respectively, to 43.4% and 7.5% following the assessment. Thus, the OSLEI was proven to be a valid instrument to measure the online social learning environment. Table 10 below portrays the unidimensionality results of the OSLEI in detail.
Unidimensionality of OSLEI.

Summary Statistics of the OSLEI
The next step denoted an analysis of the summary statistics for the remaining 35 items retained thus far in the OSLEI, revealing that the value of person separation was 4.6, which is very good, according to Fisher’s (2007) suggestion that this value should be in the range of 4 to 5. Person reliability was .95, which is excellent, as recommended by Fisher (2007), who suggests a range of 0.94. Cronbach’s alpha was .95, which is excellent, according to Ghandi (2012), as the recommended range is 0.9 to 1.0. Item separation was 1.21 which is acceptable, based on the criteria suggested by Fisher (2007); and item reliability was .59, which is acceptable, as recommended by Fisher (2007). Table 11 provides the summary statistics generated for the 35 items, for which 26 respondents were thus retained.
Summary Statistic for OSLEI.

Robust Items in the OSLEI
Table 12 provides a summary of the 35 items deemed robust in the OSLEI after it had been subjected to the Rasch model analysis. In particular, the first construct of perceived usefulness was measured by two robust items, namely Q5 and Q7, while the second construct of usage of learning group was measured by seven robust items, namely Q8, Q9, Q12, Q14, Q17, Q19, and Q20. Next, the third construct of learning outcomes was measured by six robust items, namely Q21, Q22, Q23, Q25, Q26, and Q27, whereas the fourth construct of affective outcome was measured by four robust items, namely Q28, Q29, Q30, and Q31. Following this, the fifth construct of self-efficacy was measured by nine robust items, namely Q32, Q33, Q34, Q35, Q36, Q38, Q39, Q40, and Q41, while the sixth construct of trust was measured by three robust items, namely Q42, Q43, and Q44. Finally, the last construct of teaching member presence was measured by four robust items, namely Q48, Q49, Q50, and Q51.
Summary of OSLEI (Part B) Evaluation With Rasch Model Analysis.
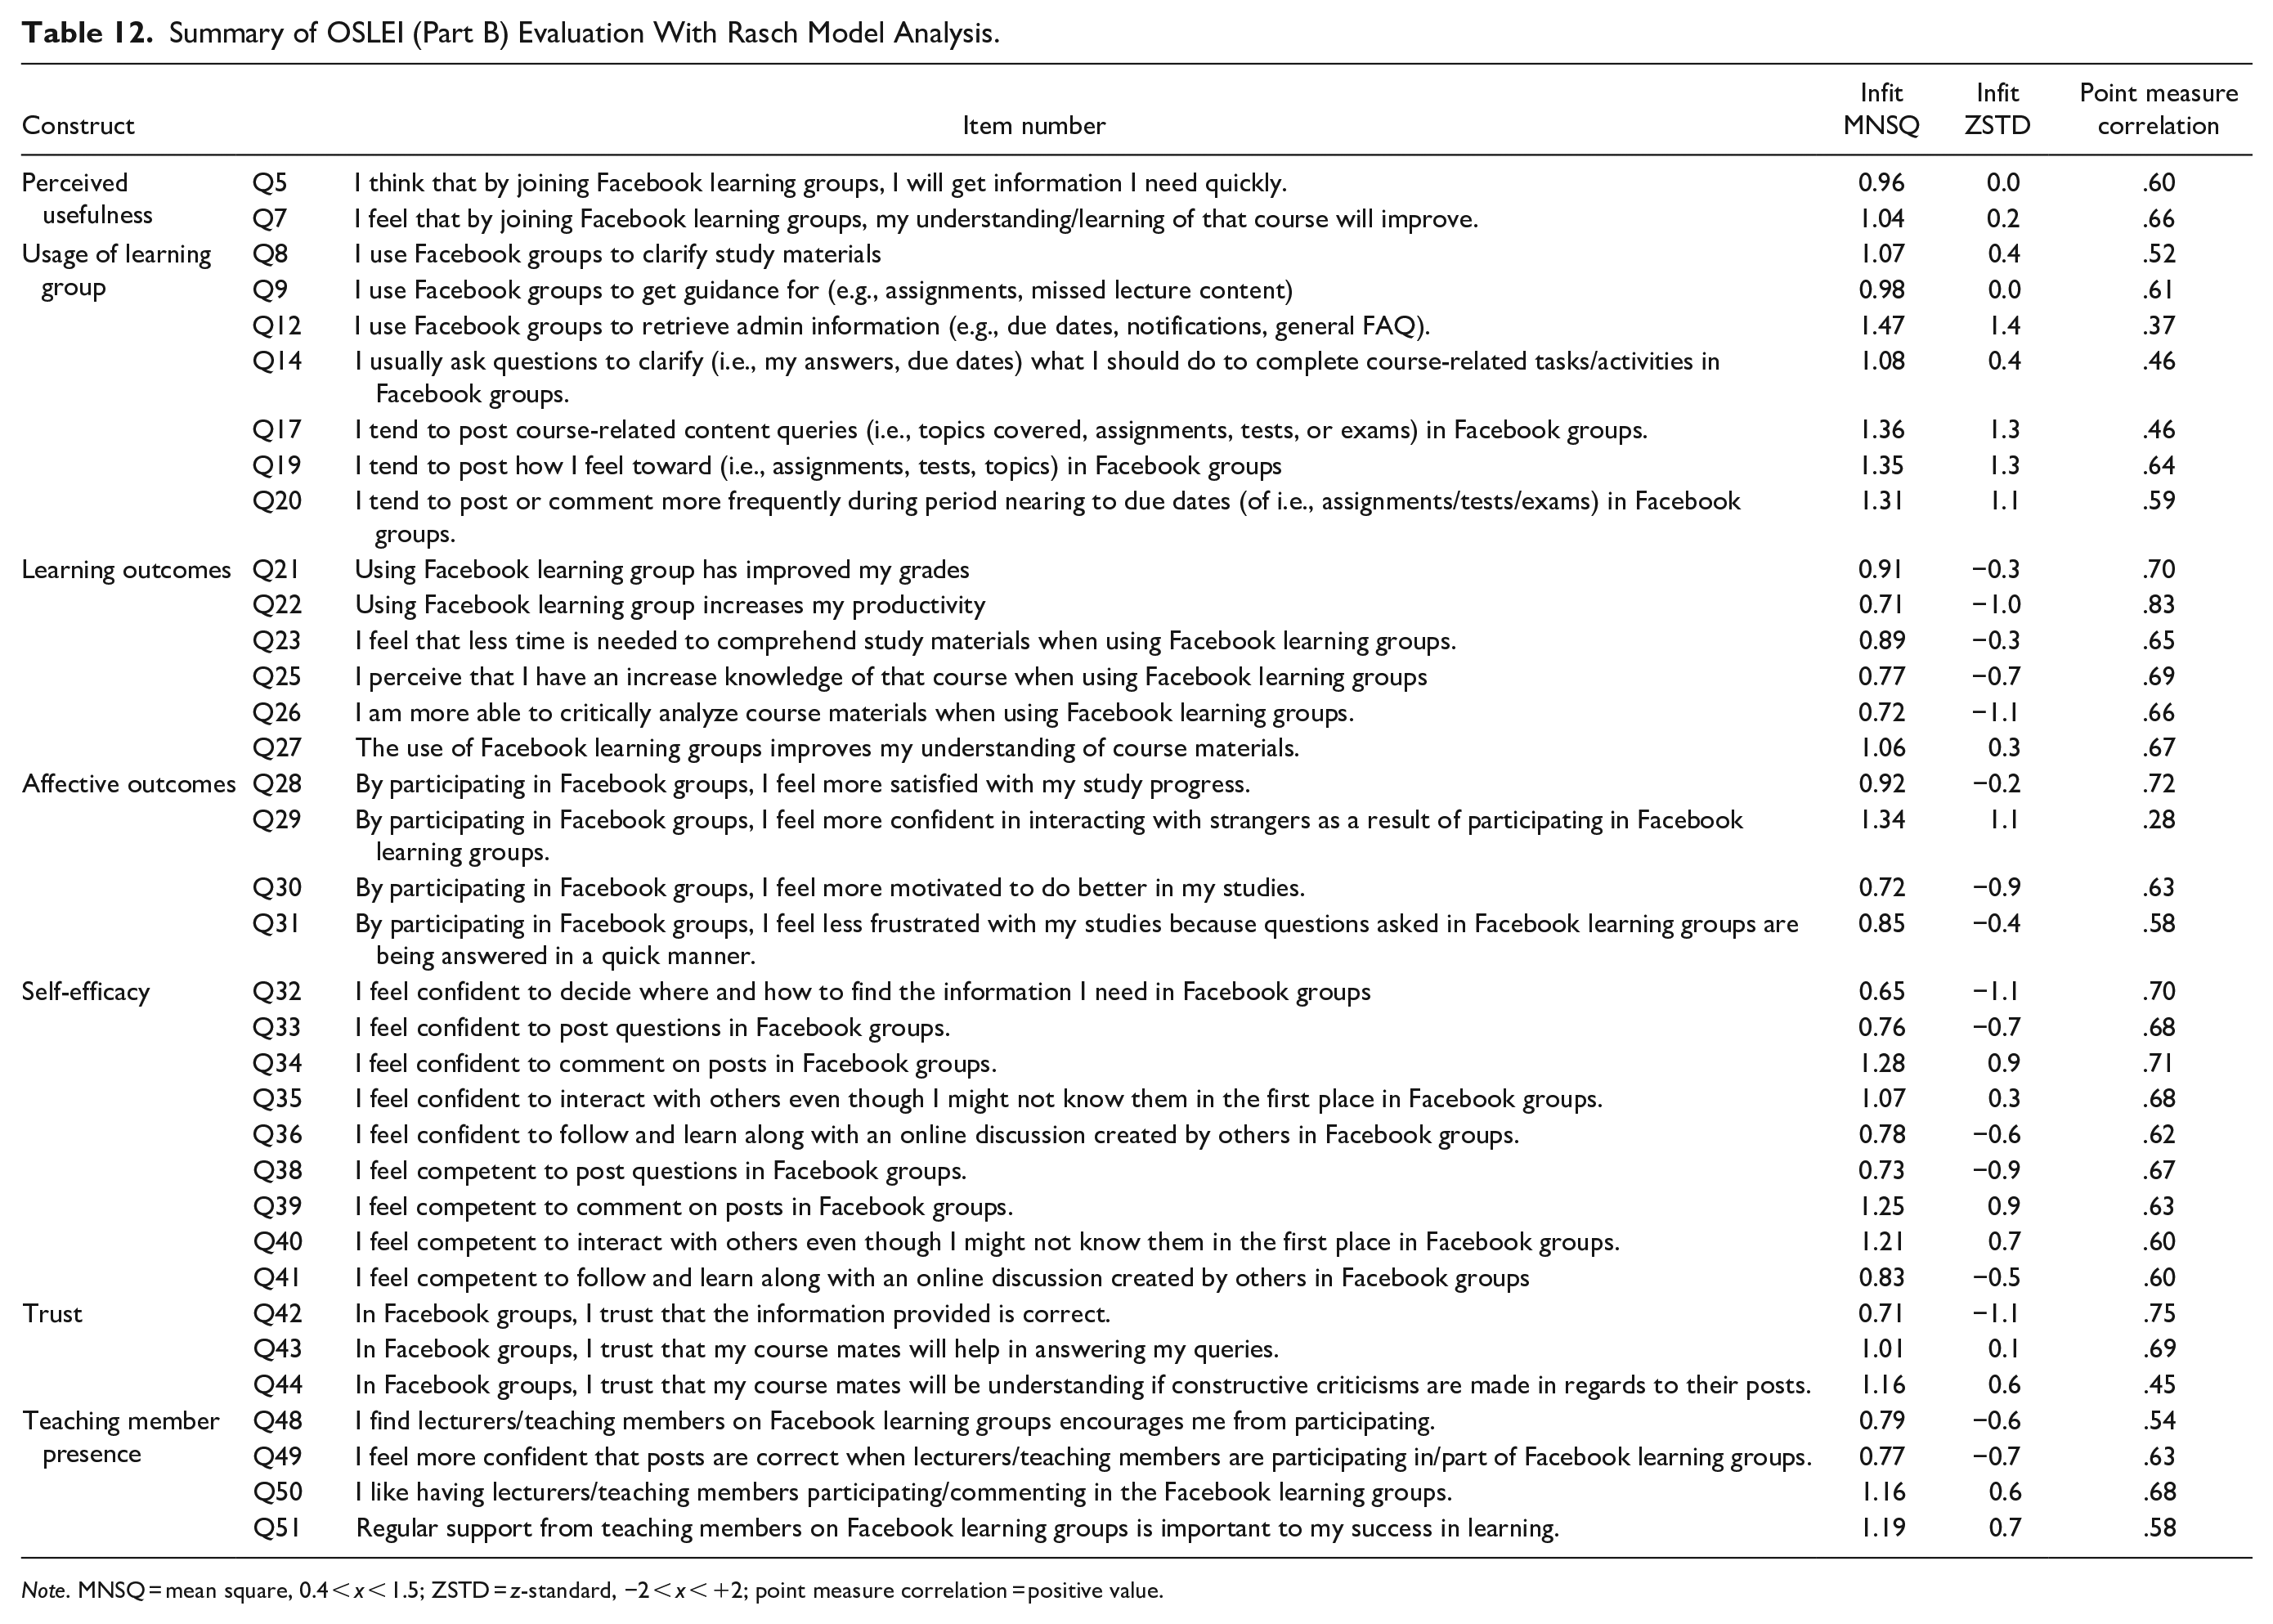
Note. MNSQ = mean square, 0.4 < x < 1.5; ZSTD = z-standard, −2 < x < +2; point measure correlation = positive value.
Discussion
The current study aimed to evaluate the quality of OSLEI items by using Rasch model analysis, whereby percentage agreement was conducted pre-analysis and no items were deleted. Rasch analysis is also capable of evaluating a person’s fit analysis. This is crucial since the majority of the studies related to educational technology have been ignored to validate the persons, who are important for the real measurement (Islam et al., 2020). Following the person fit assessment, 26 respondents were determined to be valid for further incorporation in evaluating the item fit of the OSLEI instrument, whereas 23 respondents were dropped for non-adherence to the criteria as per their values generated. Theoretically, a Rasch model analysis is capable of respondent analysis even for a small sample of 5 to 10 respondents (Linacre, 1994). Thus, the 23-person respondent pool identified for this study was deemed valid and reliable, with misfit respondents being detected and analyzed before proceeding to item analysis. Pallant and Tennant (2007) suggested the removal of such misfit respondents and items to prevent any influence on the resulting study findings. Moreover, Rasch model analysis is able to detect respondents that answered the OSLEI without reading the items properly.
In the analysis of item infit MSNQ and ZSTD, six items (i.e., Q47, Q46, Q45, Q10, Q15, and Q37) were dropped, as they were considered infit in the OSLEI. Following this, the Rasch model analysis proved their inability to measure the online social learning environment accurately. Moreover, the privacy construct was dropped altogether because all of its items were determined as misfits. Alternatively, the item point measure correlation revealed positive values for all retained items, indicating their appropriateness for measuring the environment. Meanwhile, the item measure values led to the identification of six redundant items, which measured the same thing in their respective constructs. In particular, the items consisted of one item (Q24) in learning outcome, four items (Q11, Q16, Q18, and Q13) in usage of learning group, and one item (Q4) in perceived usefulness.
Similarly, utilizing the standardized residual correlations also revealed redundant items in the instrument, resulting in one item being dropped (Q6). Regardless, the validity of the OSLEI was confirmed via its unidimensionality, whereby the value was increased after 13 items were dropped. Meanwhile, all 35 fit items in the instrument were proven by the raw variance explained by measures and unexplained variance in first contrast, which was 43.1% (increasing from 31%) and 4.4% (decreasing from 7.6%), respectively. These outcomes successfully met the minimum requirement of unidimensionality for Rasch model analysis as per Fisher’s (2007) suggestion, thereby proving the 7 constructs and their 35 items valid for measuring the online social learning environment.
Furthermore, all 35 retained items in the OSLEI were strongly supported by summary statistics following Rasch model analysis, whereby the values obtained for person separation, person reliability, item separation, and item reliability were 4.6, .95, 1.21, and .59, respectively. The outcomes for the first two values were very good and excellent, respectively, whereas the latter two values were deemed acceptable as per Fisher’s (2007) criteria. Besides, these values successfully met the minimum requirements set out by Fisher (2007) according to the rating scale for ascertaining instrument quality. Similarly, all 35 retained items in the OSLEI yielded strong support following the Rasch model analysis in view of a high Cronbach’s alpha value (.95). Here, Gandhi (2012) has underlined that a value of .9 to 1.0 is excellent for internal consistency.
Accordingly, the study findings imply that the OSLEI is a culturally valid instrument to assess social learning environments such as Facebook for the Malaysian population in the setting of educational field. Linacre (1994) has previously indicated that 5 to 10 responses per item are considered sufficient; however, the strength of this study revolves around the large number of respondents retained for further use in the item analysis for the OSLEI. However, Rasch model analysis does not require a large number of respondents. Besides, the instrument strength examined in this study was reinforced via a secondary content analysis carried out by three field experts following item drop in comparison with other instruments.
Even though only 35 items were retained in the OSLEI, the instrument was deemed valid and reliable for measuring an online social learning environment; in theory, the number of items is not important as long as the instrument can measure what it is supposed to measure. According to Harvey et al. (1985), four items are sufficient to measure a construct, while Cook et al. (1981) have recommended a minimum of three items in a construct to attain internal reliability. Hinkin (1998) suggests a minimum of four to six items to provide evidence of validity. In this study, the perceived usefulness construct only contained two items, but the instrument validity was 43.1% following Rasch model analysis. This value increased after the deletion of misfit items. Concurrently, the construct’s Cronbach’s alpha value was .95, suggesting a very high internal consistency reliability.
Thus, the current assessment of the OSLEI by using Rasch model analysis was highly valid and accurate to measure the online social learning environment in the educational setting, whereby the items assessing the environment were strongly reliable in the context of applied measurement in education. Following the analysis, all 35 items retained revealed more robust constructs for measuring said environment. In general, Rasch model analysis is known for its ability to provide empirical evidence of a powerful tool for the measurement context, such as a questionnaire (Salzberger, 2000). Additionally, the study findings offer a comprehensive reference for educational researchers seeking to employ this method with other instruments, such as for the evaluation of questionnaires in the context of social research.
Conclusion
Practically, this study contributes with revealed that 26 respondents and 35 OSLEI items were deemed valid and reliable following a comprehensive and powerful evaluation using Rasch model analysis. These 35 items undoubtedly contribute to the rigid item in OSLEI that can be used to measure online social learning environment. This instrument was modified from the original instrument, rendering it contributary to the body of literature in providing robust items to measure an online social learning environment, such as Facebook. Furthermore, this study contributed to the context of the research method thanks to its approach of evaluating questionnaires in the educational field by using an alternative method, namely Rasch model analysis. The critical analysis thus confirmed the robustness of items in the OSLEI for use in appropriate evaluation of questionnaire.
In particular, Rasch model analysis suggested dropping the privacy construct and only 35 items were retained, which were valid for measuring Facebook as an online social learning environment. In conclusion, measuring the platform as such an environment would render it meaningful to utilize 35 robust items of the OSLEI. Similarly, Rasch model analysis is particularly well known for its strength in establishing the reliability and validity of instruments for the purpose of practical assessment, research, and evaluation of questionnaire. Last but not least, others researcher are encouraged to employ Rasch model analysis as one of alternative method to evaluate the questionnaire through rigorous methodology. Previous study used CFA analysis to establish the validity and reliability of the questionnaire. When applying Rasch Model Analysis, this study contributes to determining if the questionnaire will be more accurate, rigid, and powerful.
Limitations and Future Research
This study is not without limitations, one of which is the selected sample. The respondents are chosen from only one university, thereby suggesting that a sample comprising people of different geographical backgrounds would generate an interesting assessment. Similarly, this study is limited by the students and their backgrounds, specifically undergraduate students enrolled in a multimedia applications and web design course. Thus, it is suggested that future research should employ a sample consisting of respondents from different subject areas or courses, allowing generalization of the results based on their educational backgrounds. Besides, this study focuses only on undergraduate students, but postgraduates could be selected instead in future works, as these students are also involved in online learning during COVID-19. Lastly, this study does not undertake an analysis of the rating scales used, which makes it possible for future works to include additional evaluation such as calibration structure by using Rasch model analysis. This step may ensure the accuracy of the rating scales used for the OSLEI.
Footnotes
Acknowledgements
The authors would like to thank the Universiti Pendidikan Sultan Idris and Universiti Teknologi Malaysia for their support in making this research possible.
Declaration of Conflicting Interests
The author(s) declared no potential conflicts of interest with respect to the research, authorship, and/or publication of this article.
Funding
The author(s) received no financial support for the research, authorship, and/or publication of this article.