
Abstract
The Education Value-Added Assessment System (EVAAS), the value-added model (VAM) sold by the international business analytics software company SAS Institute Inc., is advertised as offering “precise, reliable and unbiased results that go far beyond what other simplistic [value-added] models found in the market today can provide.” In this study, we investigated these claims, as well as others pertaining to the validity or truthfulness of model output, by conducting analyses on more than 1,700 teachers’ EVAAS results (i.e., actual EVAAS output to which no other external scholars have had access prior) from the Houston Independent School District (HISD). We found the EVAAS to perform, overall, in line with other VAMs in terms of validity and reliability, although it yielded possibly more biased value-added estimates than other VAMs due to differences in teacher’s EVAAS scores based on school-level student composition factors.
Introduction
In the simplest of terms, value-added modelers construct and use value-added models (VAMs) to predict what students would achieve if they were taught by the average teacher, after which they calculate the differences between students’ actual scores and those predictions and average those differences together to yield teachers’ value-added estimates. This is typically done using student growth over time on large-scale standardized test scores (i.e., the large-scale standardized tests required of all states in Grades 3–8 and once in high school by No Child Left Behind [NCLB], 2001), while statistically controlling for confounding variables, including students’ prior test performance. Some modelers also control for student-level background variables (e.g., free and reduced lunch [FRL], English language learner [ELL], gifted, special education [SPED] status) and for classroom- and school-level variables (e.g., class size, school resources, community variables).
The logic behind the use of VAMs in teacher evaluation systems is that VAMs allow for richer analyses of test data from which valid (i.e., accurate, defensible, well-founded) inferences can be drawn, after which valid decisions can be made about teachers given their effects. By using such VAM-based estimates, people external to teachers (e.g., principals, superintendents, state departments of education, educational policymakers) can more objectively hold teachers accountable for their purportedly causal impacts on their students’ achievement over time. Subsequently, by being held accountable with both positive and negative incentives and consequences attached, teachers may also be more motivated to improve their instruction, and students may consequently learn and achieve more as a result.
In this study, we analyzed whether VAM-based estimates from the Education Value-Added Assessment System (EVAAS) multivariate response model (MRM; described in detail below) might yield valid, reliable, and unbiased inferences. The EVAAS is the oldest and one of the most popular VAMs used in the United States, and it is the VAM now sold and held proprietary by SAS Institute Inc. (i.e., SAS).
Study Significance
Although scholars have conducted similar research on VAMs and the EVAAS, no external researchers of whom we are aware have published studies based on actual EVAAS output. Rather, researchers have used simulation data or other data to replicate EVAAS estimates using that which is publicly available about model specifics (see, for example, Lockwood & McCaffrey, 2007; McCaffrey et al., 2004; Vosters et al., 2018; see also W. L. Sanders et al., 2009; W. L. Sanders & Wright, 2008).
While authors of these simulation studies have, according to EVAAS developers, evidenced that the EVAAS model is indeed “robust” (W. L. Sanders & Wright, 2008, p. 1), and authors of these studies have made strides in terms of the further development of the EVAAS as well as other VAMs in general, authors of these same studies have also raised legitimate concerns about the EVAAS. Subsequently, having been debated for over one decade now are issues including but not limited to those pertaining to the actual robustness and, hence, accuracy of EVAAS output, primarily surrounding: (a) missing data and the extent to which data not missing at random might cause selection bias (see also Lockwood et al., 2007); (b) bias, as related but caused by the lack of statistical controls used, or not typically used with the EVAAS (see, for example, Amrein-Beardsley, 2014; W. L. Sanders & Wright, 2008), that even if used may not be sophisticated enough to effectively counter the biasing effects of extraneous, student demographic variables that contaminate teachers value-added estimates (see Paufler & Amrein-Beardsley, 2014, in press; see also Koedel et al., 2015) about whether unbiased estimates might ever be produced by either EVAAS model or any such VAM, and especially the EVAAS’s univariate response model (URM; see also Chetty et al., 2014a; Rothstein, 2009, 2010, 2014; Vosters et al., 2018); (c) the correct matching of teachers to their students, also proportionally when students are taught similar subjects by different teachers, taught in team teaching scenarios, and so on; (d) regression to the mean, as caused (or countered) by shrinkage estimation via best linear unbiased prediction (BLUP) or empirical Bayes estimation methods (see also McCaffrey et al., 2008; Raudenbush & Bryk, 2002); and the like. For a more comprehensive review of these issues, still of debate, please see Amrein-Beardsley (2008) and W. L. Sanders and Wright (2008). See also these and other issues (e.g., validity, transparency) as pertinent to the EVAAS and VAMs in general, forthcoming.
That being said, nobody to date has had access to what is still the model’s highly secure source code (see, for example, VAMboozled, 2016). In addition, because EVAAS outputs have also been held as proprietary, no scholars other than those internal to SAS have had access to this output to test whether it is valid, reliable, and unbiased, as claimed. Hence, our study is certainly unique, and also of much “added value” in terms of this particular VAM.
EVAAS
The EVAAS is advertised as “the most comprehensive reporting package of value-added metrics available in the educational market.” The EVAAS offers states, districts, and schools “precise, reliable and unbiased results that go far beyond what other simplistic [value-added] models found in the market today can provide” (SAS Institute, n.d.). The EVAAS helps states/districts support teachers improve upon their instruction by accessing “valuable diagnostic information,” enabling them to become more “proactive,” make more “sound instructional choices,” and use “resources more strategically to ensure that every student has the chance to succeed.” Using the EVAAS ultimately allows educators “to shrink the gap between education rhetoric and education reform” (SAS Institute, 2016a).
The EVAAS comes in different versions for different states and for different large and small school districts. For each consumer, EVAAS modelers choose one of two primary linear mixed models. These include the preferred MRM, 1 which was used to generate the data under examination in this study, which essentially entails a multivariate repeated measures analysis of variance (ANOVA) approach 2 (see Figure 1).

The EVAAS multivariate response model (MRM) teacher-level equation. 1
The second model is the URM 3 that essentially entails a traditional analysis of covariance (ANCOVA) approach 4 (see Figure 2), which resembles certain hierarchical linear model (HLM) approaches 5 (W. L. Sanders, 2003, 2006; W. J. Sanders et al., 2005; W. L. Sanders et al., 2009; Vosters et al., 2018; Wright et al., 2010). The better the test data available, even if taken from different types of standardized achievement tests (e.g., large-scale standardized tests that are aligned to either national or specific state standards, again, as per NCLB (2001)), the better the model used (i.e., the URM), and the better (i.e., more valid, reliable, and unbiased) the model estimates (W. L. Sanders, 2003, 2006; Wright et al., 2006, 2010). However, it should be noted here that recent evidence offered in Vosters et al. (2018) suggests that the EVAAS’s URM may be inferior to the EVAAS’s aforementioned MRM, if one is to deduce from Vosters et al. (2018) that the MRM is akin to the other VAMs to which Vosters et al. (2018) compared the EVAAS URM (i.e., Vosters et al. estimated the URM in comparison with other VAMs, and not the MRM per se).

The EVAAS univariate response model (URM) projection equation. 2
Regardless, growth scores are ultimately aggregated to yield teacher-level value-added estimates. Depending on where teachers’ EVAAS estimates fall, as compared with the similar teachers to whom they are compared (e.g., within districts), EVAAS modelers categorize teachers hierarchically along a continuum (W. L. Sanders, 2003, 2006; W. L. Sanders et al., 2009; W. L. Sanders & Wright, 2008; Wright et al., 2006). Teachers whose students grow significantly more than the average and surpass projected levels of growth are identified as adding value. Teachers whose students grow significantly less and fall short of projected levels are identified as detracting value. Teachers whose students grow at rates that are not statistically different from average (i.e., falling within one standard deviation of the mean) are classified as “not detectibly different” (NDD). Average scores are calculated relative only to other teachers in the district.
Prior analyses of EVAAS data conducted by SAS-affiliated researchers (i.e., W. L. Sanders, 2003, 2006; White et al., 2011; Wright et al., 2006, 2010) have supported EVAAS’s valid, reliable, and unbiased results. However, some of this evidence falls under question as it has not been externally vetted by the academic community or published in accessible outlets. For example, White et al.’s (2011) reliability analysis using 3 years of EVAAS data found correlations among teachers’ EVAAS estimates from one year to the next to be significantly high (i.e., ranging from r = .70 to r = .80), yet their paper reporting these results is officially (un)titled, also as an “Unpublished report” cited in SAS Institute (2012). As such, while SAS’s claim regarding the validity, reliability, and (lack of) bias of the EVAAS might be uncertain or even suspicious to some (Collins, 2014; Eckert & Dabrowski, 2010; Gabriel & Lester, 2013; Kappler Hewitt, 2015; Kupermintz, 2003), it is likely that the population to whom the EVAAS is marketed (i.e., state and district decision makers) may take this marketing claim at face value. True or not, this claim is likely influencing said decision makers, which makes it worthy of direct external examination.
Methodological Concerns About the EVAAS
Much controversy surrounds VAMs in general (see, for example, American Educational Research Association [AERA] Council, 2015; American Statistical Association [ASA], 2014; Harris & Herrington, 2015; National Association of Secondary School Principals [NASSP], n.d.), and the EVAAS. While some researchers have published white papers or other reports supporting the general tenets of the EVAAS (see, for example, W. L. Sanders et al., 2009; SAS Institute, 2016a; White et al., 2011), others (Amrein-Beardsley, 2008; Amrein-Beardsley & *Collins, 2012; Capitol Hill Briefing, 2011; Collins, 2014; Eckert & Dabrowski, 2010; Gabriel & Lester, 2013; Kappler Hewitt, 2015; Kupermintz, 2003) have demonstrated that the marketing claims to sell the EVAAS are void of externally reviewed or vetted evidence. This is largely because to date, no full-blown externally vetted reviews of the EVAAS have been conducted, primarily because of the lack of accessible data and access to the source code SAS still holds and carefully guards as proprietary. While model specifics might be more transparent than prior (SAS Institute, 2016a, 2016b; Wright et al., 2010), the community of external scholars has still not returned a scientific stamp of approval.
Rather, many of the researchers who have conducted external research on the model have put EVAAS sponsors’ similar marketing claims and pronouncements into question. While some have replicated the model or its components to test it independently or in comparison with other models (e.g., McCaffrey et al., 2004), and they have found that, overall, the model is sound, others have conducted research on EVAAS use in practice. Beyond noting the model’s arguable strengths (e.g., statistical sophistication, the power of the analytics system), these researchers have also advanced a set of contemporary concerns about the EVAAS, principally surrounding: (a) validity, concerning the extent to which the EVAAS yields trustworthy inferences (Amrein-Beardsley & *Collins, 2012; Ballou & Springer, 2015; Collins, 2014; Derringer, 2010; Gabriel & Lester, 2013; Holloway-Libell, 2015; Kappler Hewitt, 2015); (b) reliability (or precision, hereafter referred to more generally as reliability), concerning the extent to which teachers’ EVAAS scores remain at least somewhat consistent over time (Amrein-Beardsley & *Collins, 2012; Ballou & Springer, 2015; Collins, 2014; Kappler Hewitt, 2015); (c) bias, concerning the extent to which EVAAS estimates are biased by the nonrandom sorting of students into classrooms given whether EVAAS’s statistical controls (or lack thereof) work as intended (Collins, 2014; Kappler Hewitt, 2015; Koedel et al., 2015; McCaffrey et al., 2004); (d) fairness, concerning how teachers are held accountable in comparison with those with or without certain test data or class sizes (Ballou & Springer, 2015; McCaffrey et al., 2009); and (e) transparency, concerning how EVAAS estimates are understood and used in practice (Amrein-Beardsley & *Collins, 2012; Collins, 2014; Gabriel & Lester, 2013; Harris, 2011; Kappler Hewitt, 2015; Nelson, 2011). Regarding transparency, the EVAAS is still often popularly recognized as “the black box model,” as argued primarily by teachers for being perceptibly more inaccessible and enigmatic than other VAMs (Derringer, 2010; Gabriel & Lester, 2013). However, the extent to which practitioners have conflated this “black box” term with the fact that the EVAAS is also statistically complex and difficult for the average practitioner to understand is uncertain. Nevertheless, teachers argue that if this model is used to evaluate them, they should have the right and the professional support to open and access the alleged “black box” (Collins, 2014; Kappler Hewitt, 2015).
While the aforementioned concerns have been brought to light, EVAAS sponsors have worked to counter the warnings and cautionary tales that have come from said researchers (W. L. Sanders et al., 1997, 2009; W. L. Sanders & Horn, 1998; W. L. Sanders & Wright, 2008; White et al., 2011; Wright et al., 2010), and EVAAS sponsors have “taken the brunt of the detractors” (W. L. Sanders et al., 2009, p. 1). Yet, little is still known about this model’s levels of validity, reliability, and (a lack of) bias.
Purpose of the Study
In this study, we conducted several analyses to help fill the aforementioned research void surrounding this particular VAM. Although similar analyses have previously been conducted on VAMs and the EVAAS, our study is especially unique and of “added value” in that we were able to obtain actual EVAAS output that we secured via ongoing litigation surrounding the EVAAS in Houston (i.e., Houston Federation of Teachers v. Houston Independent School District, [hereafter referred to as Houston], 2017). This is also important given that several teacher-evaluation lawsuits have been filed in districts in which the EVAAS is the VAM being used for consequential personnel decisions in Tennessee (i.e., Lisa Trout and Mark Taylor v. Knox County Board of Education) and in Houston (see next and see also Houston Independent School District [HISD] v. Mia Thymes, Hercilia Leon, Mary McWilliams, and Glenda Drew), but in which such access was not granted.
Please note, however, that while we obtained EVAAS output via this lawsuit, we did so after EVAAS estimates were calculated by SAS. We did not have access to any data that SAS retrieved from Houston and that SAS, thereafter, organized, inputed, and cleaned prior to sending back to Houston their EVAAS estimates. More specifically, while we could have possibly retrieved the raw data files that Houston sent to SAS, we were not given any of SAS’s decision rules pertaining to the organization, imputation, and cleaning of the data, even after a court request. In addition, we were not provided access to SAS’s algorithms, proprietary secrets, and the like, also after a court request. Indeed, only one of the four expert witnesses working with the plaintiffs in this lawsuit was granted this type of access, but to no avail (see forthcoming).
Hence, this might be seen as a study limitation in that we could not, for example, calculate our own VAM scores and compare them with the EVAAS estimates that we would have also had to calculate ourselves (i.e., replicate). Conducting this type of comparative study would have also helped us to control for or hold constant varying teacher–student rosters and the noise in the data, for example, due to the large-scale standardized tests used in Houston and throughout the state of Texas (i.e., the State of Texas Assessments of Academic Readiness [STAAR]). In addition, the data sent from SAS to Houston only contained the categorical EVAAS ratings, rather than the raw EVAAS estimates (from which the categorical ratings are derived). The lack of access to the underlying continuous EVAAS estimates also limits the generalizability of results and comparability of this study to others. Hence, our results should be interpreted with caution in that a state or district with a different test in use might yield different EVAAS estimates than another.
However, it is still important to note that we were granted access to actual EVAAS output, again, via court order, and for the first time of which we are aware. Hence, and also for the first time of which we are aware, we were able to effectively assess the EVAAS’s levels of reliability, validity, and bias, in Houston, to assess the aforementioned claims, as also marketed to Houston. Furthermore, while we only had access to the EVAAS categorical output, those categorical ratings were what were used to make the highly consequential decisions for Houston teachers that were brought forth in the aforementioned lawsuit. Thus, we still see the results from this study as being especially useful in a policy context. In addition, while states and districts may have access to their own EVAAS output, if also under contract with SAS, we are unaware of any district that has either granted external researchers access to these data to replicate the EVAAS data or conducted any similar studies. We are also unaware of states or districts that have conducted any of this research themselves, as also admittetedly incapable, at least in the case of Houston. Indeed, Houston leaders testified that they simply trusted (or had to trust) SAS, given SAS’s statistical expertise, to honor and deliver on that which they marketed to Houston and to that which they agreed within their contract (Houston, 2017).
Finally, it is important to note that had we been granted access to the data, the aforementioned decision rules, and the like, this would have likely been futile in that we very likely would not have been able to replicate the Houston teachers’ EVAAS estimates anyway. The Houston court ultimately ruled that it was impossible to replicate the estimates that SAS generated in that (a) the case’s aforementioned expert witnesses was “unable to replicate the scores despite being given far greater access to the underlying computer codes” than available prior (Houston, 2017, p. 1177); (b) “without access to SAS’s proprietary information—the value-added equations, computer source codes, decision rules, and assumptions—EVAAS scores remain[ed] a mysterious ‘black box,’ impervious to challenge” (Houston, 2017, p. 1179); (c) even simple data entry (not to mention organizational, imputation, cleaning, etc.) mistakes and glitches in the computer code caused incorrect scorings (Houston, 2017, p. 1177); (d) simple mistakes lead to many others and “alter[ed] the scores of every other teacher in the district” (see also Ballou & Springer, 2015); and, ultimately; (e) the EVAAS scoring system was ruled as being built on a “house of cards fragility” (Houston, 2017, p. 1178).
Nonetheless, using the EVAAS data secured via the lawsuit, we specifically investigated the following research questions about the EVAAS model’s levels of (a) validity, assessed by investigating the statistical (cor)relationships between HISD teachers’ observational scores 6 and EVAAS estimates; (b) reliability, assessed by examining teachers’ EVAAS estimates over time; and (c) bias, defined by the extent to which teachers’ EVAAS estimates might be influenced by the types of students nonrandomly assigned to classrooms, also given the statistical controls built into the EVAAS to block said bias.
Supporting Literature
Validity
As per the Standards for Educational and Psychological Testing (AERA et al., 2014; hereafter referred to as the Standards), validity “refers to the degree to which evidence and theory support the interpretations of test scores for [the] proposed uses of tests” (p. 11). Likewise, “[v]alidity is a unitary concept,” as measured by “the degree to which all the accumulated evidence supports the intended interpretation of [the test-based] scores for [their] proposed use[s]” (p. 14).
When establishing evidence of validity, one must be able to support with evidence that accurate inferences can be drawn from the data being used for whatever inferential purposes are at play (Cronbach & Meehl, 1955; M. T. Kane, 2006, 2013; Messick, 1975, 1980, 1995; Popham, 2011). We examined convergent-related evidence of validity (i.e., “the degree of relationship between the test scores and [other] criterion scores” taken at the same time; Messick, 1989, p. 7) to assess the extent to which measures of similar constructs converged.
Gathering evidence of convergent-related evidence of validity is necessary to assess, for example, whether teachers who post large and small value-added gains or losses over time are the same teachers deemed effective or ineffective, respectively, using other measures of teacher effectiveness (e.g., observational scores, student or parent survey scores) collected at the same time. In this study, we defined this as the extent to which the measure in question (i.e., EVAAS scores) correlates with other measures that are assumed to measure the construct (i.e., teacher quality) in question.
Research evidence suggests that VAM estimates of teacher effectiveness do not strongly correlate with the other measures typically used to measure it (e.g., observational scores). While some argue that non-VAM measures are at fault, others argue that all measures are at fault as all are flawed in some way. Hence, while some might also argue that knowing there is a low correlation between any VAM and any set of observational scores tells us nothing about whether either one, neither, or both measures are useful, some might inversely argue that should these indicators be purposefully mapped onto a general construct called teaching effectiveness, and should high-stakes decisions be attached to output, these correlations must be higher before high-stakes consequences can be attached. We align our thinking in this piece with the latter approach.
If all measures used to measure teacher effectiveness, including VAMs, were reliable and valid, effective teachers would rate as such, more or less consistently, from one year to the next, across the indicators used. Conversely, ineffective teachers would rate poorly, more or less consistently, from one year to the next, across indicators used. However, this only occurs in slight magnitudes, whereby the correlations being observed among both mathematics and reading/language arts value-added estimates and teacher observational or student survey indicators are low to moderate 7 in size (Grossman et al., 2014; Harris, 2011; Hill et al., 2011; Polikoff, 2014; Rothstein & Mathis, 2013; see also Koedel et al., 2015). These correlations are also akin to those observed via the Bill & Melinda Gates Foundation’s Measures of Effective Teaching (MET) studies (T. Kane & Staiger, 2012; see also Polikoff & Porter, 2014).
Reliability
As per the Standards (AERA et al., 2014), reliability is defined as the degree to which test- or measurement-based scores “are consistent over repeated applications of a measurement procedure [e.g., a VAM] and hence and inferred to be dependable and consistent” (pp. 222–223) for the individuals (e.g., teachers) to whom the test- or measurement-based scores pertain. In terms of VAMs, reliability (also known as intertemporal stability; see, for example, McCaffrey et al., 2009) should be observed when VAM estimates are more or less consistent over time, regardless of the type of students and perhaps subject areas teachers. This is typically captured using “standard errors, reliability coefficients per se, generalizability coefficients, error/tolerance ratios, item response theory (IRT) information functions, or various indices of classification consistency” (AERA et al., 2014, p. 33).
In terms of VAMs, reliability is observed when VAM estimates are more or less consistent over time, mostly regardless of the types of students, grade levels, or subject areas teachers teach. If deemed reliable, VAM estimates can reflect stable indicators of teacher effectiveness. This is critical when VAM outputs are to be attached to high-stakes consequences upon which the stability of these measures over time also rely. Without adequate reliability, valid interpretations and use are difficult to defend. What is also becoming increasingly evident across research studies is that VAMs are often unreliable, unstable, and sometimes “notoriously” unhinged (Ballou & Springer, 2015, p. 78). While “proponents of VAM[s] are quick to point out that any statistical calculation has error of one kind or another” (Gabriel & Lester, 2013, p. 4), the errors prevalent across VAMs are large enough to warrant caution before high-stakes consequences are attached.
Several researchers have found that the possibility of teachers being misclassified (i.e., as adding value one year and then not the following year) can range from 25% to 59% (Schochet & Chiang, 2013; Yeh, 2013). While reliability can be increased with 3 years of data, there still exists a 25% chance that teachers may be misclassified (Raudenbush & Jean, 2012). In addition, after including 3 years of data the strength that more data add plateaus (Brophy, 1973; Harris, 2011; Sanders as cited in Gabriel and Lester (2013)).
Bias
As per the Standards (AERA et al., 2014), bias pertains to the validity of the inferences that stakeholders draw from test-based scores. The Standards define bias as the set of “construct-irrelevant components [associated with] test scores that differentially affect the performance of different groups of test takers and consequently the . . . validity of interpretations and uses of their test scores” (p. 216). Biased estimates, also known as systematic error, are observed when said criterion performance varies for “people belonging to groups differentiated by characteristics not relevant to the criterion performance” (p. 222) of measurement.
Specific to VAMs, because schools do not randomly assign students to teachers, and students’ capabilities and motivations invariably differ, students’ test-based data and thus teachers’ test-based data can be biased. Bias is observed when VAM estimates of teacher effectiveness correlate with student background variables other than the indicator(s) of interest (i.e., student achievement over time). If VAM-based estimates are highly correlated to biasing factors, it becomes impossible to make valid inferences about the causes of student achievement growth (Messick, 1989, 1995).
Many VAM researchers agree that estimates of teachers who teach smaller classes, disproportionate percentages of gifted students, ELLs, SPED students, students who receive FRL, and students retained in grade are most adversely impacted by bias (Ballou & Springer, 2015; McCaffrey et al., 2009; Newton et al., 2010; Rothstein, 2009, 2010, 2014). In perhaps the most influential study on this topic, Rothstein (2009, 2010) illustrated VAM-based bias when he found that a student’s 5th grade teacher was a better predictor of students’ 4th grade growth than was the student’s 4th grade teacher. While others have certainly called into question Rothstein’s work (see, for example, Goldhaber & Chaplin, 2015; Koedel & Betts, 2009), over the past decade, VAM-based evidence of bias has been investigated at least 33 times in articles published in high-quality peer-reviewed journals (Lavery et al., UNDER REVISION). Still of great debate is whether statistically controlling for potential bias by using complex statistical approaches to account for nonrandom student assignment makes such biasing effects negligible or “ignorable” (Rosenbaum & Rubin, 1983; see also Chetty et al.,2014a, 2014b; Koedel et al., 2015; Rothstein, 2014).
Method
Data Population and Subsamples
We acquired our data via the above-mentioned HISD lawsuit. More than 97% of HISD teachers were represented from more than 90% of HISD schools. The data set included teachers’ EVAAS estimates from the 2010–2011 to 2014–2015 school years and teachers’ final yearly observational (i.e., Instructional Practice [IP]) scores from the 2011–2012 to 2014–2015 school years, along with a variety of teacher-level demographic variables including (a) teachers’ years of experience, (b) full contract or probationary contract status, (c) subject area taught, and (d) grade-level taught. We added school-level variables from the HISD website to the data set, including (a) percentage of minority (i.e., non-White) student enrollment, (b) percentage of ELL enrollment, (c) percentage of students who were FRL eligible as a proxy for socioeconomic status, (d) percentage of students receiving SPED services, and (e) overall student enrollment as a proxy for school size. We then identified “high” and “low” schools for each variable as schools in the top and bottom quartiles, respectively, so we could compare teachers based on these differences.
To address our first research question (i.e., EVAAS validity), we narrowed the original data set to include only those teachers who had EVAAS and IP scores for the most recent 3 years (i.e., 2012–2013 [Year 1], 2013–2014 [Year 2], and 2014–2015 [Year 3]). This narrowed sample included 1,788 unique teachers, which was 15.8% (n = 1,788/11,335) of the original sample, representing 231 schools (80.5% of HISD; n = 231/287).
To address our second and third research questions (i.e., EVAAS reliability and bias, respectively), we narrowed the original data set to include only those teachers who had an EVAAS score, regardless of whether they had an IP score, for the most recent 3 years (i.e., 2012–2013 [Year 1], 2013–2014 [Year 2], 2014–2015 [Year 3]). This sample included 2,036 teachers, which was 18.0% (n = 2,036/11,335) of the original sample, from 240 schools (83.6% of HISD; n = 240/287). We confirmed that the two subsamples used to address our research questions were representative of HISD as a whole (see Table A1 in the supplementary online material included for additional details at http://bit.ly/1rmYKIJ).
Data Analyses
In terms of convergent-related evidence of validity, we investigated the (cor)relationships between HISD teachers’ EVAAS-derived estimates and their IP by analyzing the correlations between the two. We calculated Pearson’s r correlations between teachers’ EVAAS and IP scores for each year, and then also determined whether the differences between the correlations from year to year were significant using Fisher’s Z test 8 (Dunn & Clark, 1969, 1971)
In terms of reliability, we investigated the distribution of EVAAS scores per teacher over time, as well as determined the correlation among scores over the same period of time. For comparative purposes, we also calculated correlations among teachers’ IP scores over the same period of time. We conducted chi-square tests to determine whether the EVAAS score distributions and degree of score variation significantly differed from year to year and determined what percentages of teachers moved among score categories from year to year. We also examined whether there were any teacher- or school-level differences in stability, and for comparative purposes, we conducted the same analyses for teachers’ IP scores.
We investigated the issue of bias by comparing EVAAS scores per multiple teacher- and school-level subgroups, as described above. We calculated descriptive statistics for teachers’ EVAAS scores by school-level subgroup and examined whether differences were statistically significant using t tests or fixed effects ANOVA.
Results and Discussion
Descriptive Statistics
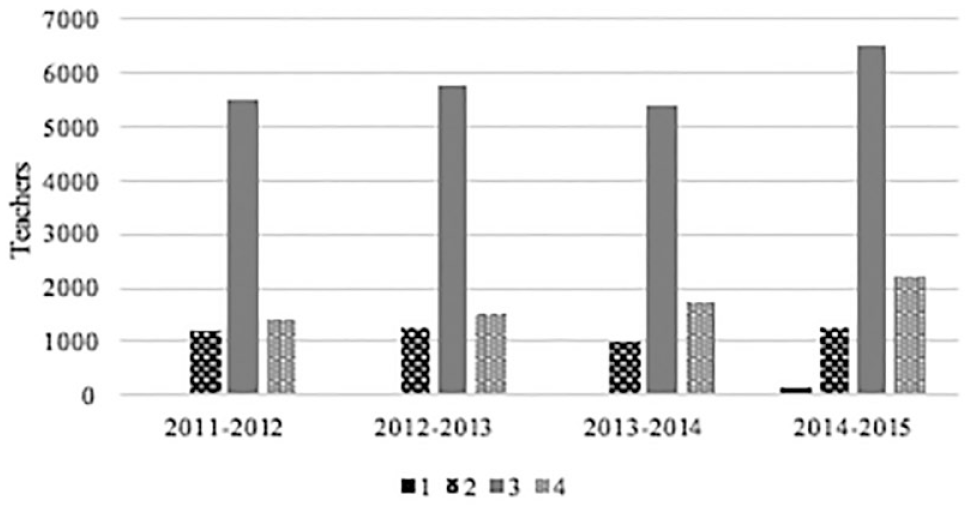
Across the 11,335 teachers in the original (i.e., non-narrowed) data set, the mean of each year’s EVAAS score was at or slightly above the EVAAS scale and sample median of 3.00, with specific year means ranging from 3.08 to 3.38. The distribution of EVAAS scores in the original data set per year was, accordingly, somewhat positively skewed (see Table 1). Inversely, as the mean of each year’s IP score ranged from 3.02 to 3.08, which was higher than the IP scale median of 2.50 and sample median of 3.00, the distribution of IP scores in the full data set per year was negatively skewed (see Table 2). Overall, the majority of teachers in the original data set were rated as effective or highly effective (i.e., at a rating of 3 or 4). This negatively skewed distribution falls in line with other research on observational scores (Weisberg et al., 2009), whereby the distribution of scores are (too often, as Weisberg et al. argued) highly negatively skewed (see Figures 3–4).
Mean EVAAS Scores, Per Year.

Note. EVAAS scores were on a scale of “1” to “5” with “1” indicating “highly ineffective” teaching and “5” indicating “highly effective” teaching. EVAAS = Education Value-Added Assessment System.
Mean IP Scores, Per Year.

Note. IP scores were on a scale of “1” to “4” with “1” indicating “highly ineffective” teaching and “4” indicating “highly effective” teaching. IP = Instructional Practice.

Distributions of EVAAS scores, per year.
Distributions of IP scores, per year.
Validity
We found that the correlations between HISD teachers’ EVAAS and IP scores were comparable to other VAMs on the market, in that correlations were weak, at best, for all 3 years (Year 1: r = .30, p < .001; Year 2: r = .28, p < .001; Year 3: r = .34, p < .001). Hence, results from this set of analyses indicate that the EVAAS, at least as evidenced in HISD, offer results that have evidence of validity similar to other VAMs. However, it should be noted that these results could have in part resulted from poor performance of teachers’ IP scores (i.e., a weak correlation with teachers’ IP scores could also indicate weaknesses in teachers’ IP measures). Notwithstanding, and given the typically unvalidated observational instruments used in other studies cited in this area of research (e.g., the TAP System for Student Learning and Achievement, the Danielson Framework, the Marzano Causal Teacher Evaluation Model; see also Sloat et al., 2017), the indicators here suggest that the EVAAS is about on par with other VAMs, in terms this form of validity.
Variations by teacher
When disaggregating by teacher subgroups, correlations between teachers’ EVAAS and IP scores for all years were not significantly different than the three sets of correlations noted above. Although no subgroups’ correlations significantly differed from the overall correlations, they did significantly increase from Year 1 to Year 3 for science teachers (r = .19 [Year 1] to .41 [Year 3]; z = 2.32, p = .020) and Year 2 to Year 3 for elementary-grade teachers (r =.23 [Year 2] to .36 [Year 3]; z = 2.22, p = .027).
Variations by school
Across school-level variables, correlations significantly increased for teachers in schools with low ELL populations in Year 3 compared with both Year 1 (r = .25 [Year 1] to .38 [Year 3]; z = 2.29, p = .021) and Year 2 (r = .25 [Year 2] to .38 [Year 3]; z = 2.24, p = .025). Correlations were also significantly higher in Year 3 compared with Year 2 for teachers in schools with lower populations of FRL students (r = .26 [Year 2] to .38 [Year 3]; z = 2.04, p = .041) and students receiving SPED services (r = .21 [Year 2] to .32 [Year 3]; z = 2.17, p = .030). Finally, for teachers in schools with large total enrollments, the correlation was significantly higher in Year 3 versus Year 1 (r = .26 [Year 1] to .36 [Year 3]; z = 2.50, p = .024).
Reliability
Correlations between teachers’ EVAAS estimates across years were moderate, 9 at best, and statistically significant. The correlation between Year 1 and Year 2 scores was r = .52 (p < .001), between Year 2 and Year 3 scores was r = .49 (p < .001), and between Year 1 and Year 3 scores was r = .41 (p < .001). These correlations indicate that there is a moderate linear relationship between teachers’ EVAAS estimates from year to year.
Overall, the distributions of teachers’ EVAAS scores per year all significantly differed from each other (Year 1 vs. Year 2: χ2 = 126.20, p < .001; Year 1 vs. Year 3: χ2 = 255.27, p < .001; Year 2 vs. Year 3: χ2 = 103.81, p < .001; see Table 3).
Distributions of EVAAS Scores Over Time.

While a plurality of teachers’ EVAAS scores were either identical from year to year or only one scale point different, many teachers also received dissimilar EVAAS scores over the same period of time (see Table 4).
Teachers’ Variations in EVAAS and IP Categorical Scores Over Time.

Note. EVAAS scores are on a 5-point scale, whereas IP scores are on a 4-point scale and, therefore, there cannot be 4-point variation between years. EVAAS = Education Value-Added Assessment System; IP = Instructional Practice.
Between Year 1 and Year 2, 37.9% of teachers (n = 771/2,036) had no variation in scores and 31.8% of teachers (n = 648/2,036) varied in score by 1 point. However, 23.2% (n = 472/2,036) of teachers varied by 2 points, and 7.2% (n = 145/2,036) had scores that varied 3 or 4 points between years. Score variations between Year 2 and Year 3 were comparable. Similarly, just under 35% of teachers received the same EVAAS scores within one category from their prior scores from year to year. This more plainly illustrates what the aforementioned correlations (e.g., r = .30, .28, .34) also showed.
At first glance, the differences in variation could possibly have been due to the fact that the range of potential EVAAS scores was greater than that of IP scores (i.e., EVAAS scores ranged from 1 to 5, whereas IP scores ranged from 1 to 4). To determine whether the differences in variation between indicators were significant, we conducted a binomial test, which indicated that EVAAS scores varied significantly more than IP scores, both from Year 1 to Year 2 (t = 19.77, p < .001) and Year 2 to Year 3 (t = 24.84, p < .001). Nearly 71% of teachers had no variation in IP scores from year to year. Teachers’ IP scores were much more stable over time as compared with their EVAAS scores, as IP scores had milder variation, although this could also be due to the fact that teachers’ IP scores in HISD and elsewhere (Weisberg et al., 2009) are typically negatively skewed (see Figure 5).
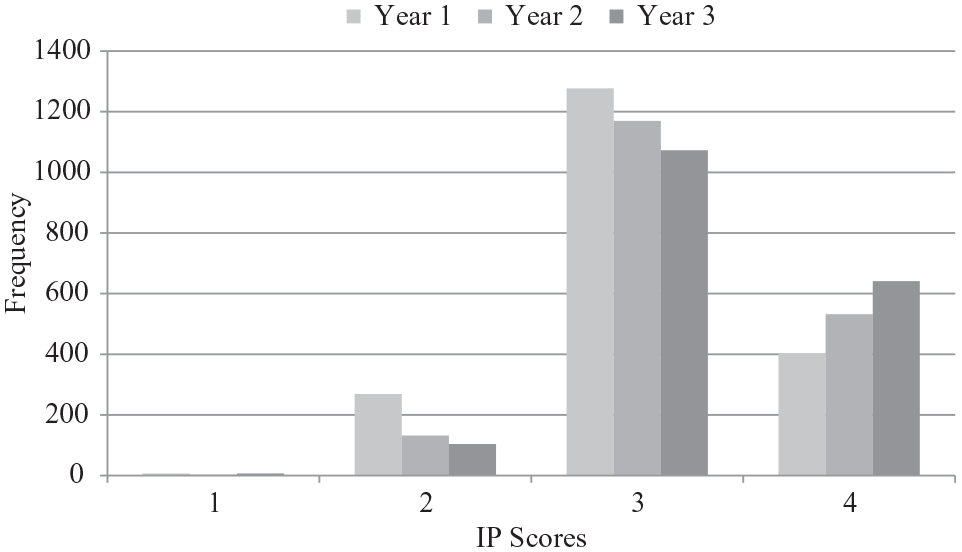
Frequency and distribution of IP scores, per year.
Overall, the indicators of reliability seem to be a bit above-the-average VAM (e.g., Brophy, 1973; McCaffrey et al., 2009; Sass, 2008; see also Harris, 2011; Lockwood & McCaffrey, 2009; Newton et al., 2010; Raudenbush & Jean, 2012; Schochet & Chiang, 2013; Yeh, 2013), although this evidence directly contradicts the 3-year year-to-year reliability coefficients noted by White et al. (2011; i.e., r = .70 to r = .80). However, given this statistic was presented in an untitled, unpublished document (i.e., White et al., 2011, as cited in SAS Institute (2012)), and given the amount of variation we found in our data, it is our opinion that our finding does not support the claim that the EVAAS (in addition to other VAMs) offers, at least in Houston, “precise, reliable [emphases added] and unbiased results” (SAS Institute, n.d.).
Variations by teacher
The majority of correlations for subgroups of teachers were similar and not significantly different than the overall correlations. While a few significant differences were noted between teacher types (e.g., those with the least amount of experience—2 or fewer years—yielded a significantly lower correlation between their Year 1 and Year 2 EVAAS scores compared with the correlation across all teachers at the same time), none of these differences evidenced patterns of note whereby we could substantiate with evidence that certain teachers’ EVAAS scores were more or less stable over time than others.
Variations by school
Across school categories, all correlations but one were similar and not significantly different than the overall correlations, and most correlations were moderate, at best (ranging from r = .37 to r = .58). Of note was that teachers who taught at schools with the highest populations of ELL students had a significantly lower correlation between their Year 1 and Year 2 EVAAS scores compared with all schools overall (p = .031). In addition, correlations were significantly stronger for teachers in schools with relatively higher proportions of racial minority students (r = .58), as compared with teachers in schools with relatively lower proportions of racial minority schools (r = .50), between Year 1 and Year 2 (p = .037) and between Year 2 and Year 3 (low minority, r = .55; high minority, r = .43; p = .004). Related, teachers in schools with relatively lower populations of ELL, FRL, and SPED students also had significantly less variation in their EVAAS estimates between Year 2 and Year 3, as compared with teachers in schools with relatively higher populations of ELLs (p < .001), students eligible for FRL (p = .002), and students receiving SPED services (p < .001).
Bias
Given the (lack of) information present in our data set, we were unable to use any methods to control for teacher sorting or the nonrandom sorting of students into teachers’ classrooms. However, because the EVAAS is the primary system in which developers claim that the statistical controls and mechanisms that they built into the EVAAS block bias caused by both types of sorting, we tested this claim. More specifically, we tested whether indeed or to what extent such evidences of bias were indeed blocked as claimed (see also W. L. Sanders et al., 2009; W. L. Sanders & Horn, 1994, 1998; Wright et al., 2010).
Variations by teacher
Most teacher subgroups had EVAAS scores that followed a similar pattern for all teachers, in that scores significantly increased from Year 1 to Year 2 and Year 1 to Year 3, and scores in Year 2 did not significantly differ from Year 3 (see Table A2 in the supplementary online material for additional details: http://bit.ly/1rmYKIJ).
Teachers with the least amount of experience had significantly lower scores than all other teachers in Year 1, F(5, 1976) = 6.915, p < .001, and had significantly lower scores than teachers with 3 to 6 years of experience in Year 2, F(5, 1976) = 4.185, p = .001. Teachers on full contracts yielded significantly higher EVAAS scores than teachers on probationary contracts across years (Year 1: t = 6.281, p < .001; Year 2: t = 4.337, p < .001; Year 3: t = 3.776, p < .001). Again, this suggests that EVAAS scores are possibly biased against teachers on probationary contracts who are new to the district, or in line with current research and common sense, that EVAAS scores are signaling that full-contract teachers (who also have relatively more experience) are demonstrably more effective than those who are probationary and/or new (see also Darling-Hammond, 1995). These similarities between years of experience and contract status might be an indicator of evidence of validity in that these correlations fell in their expected directions.
As per teachers’ subject areas, mathematics teachers had significantly higher scores in Year 1 compared with all other subject area teachers except for English/language arts teachers, F(4, 1345) = 7.890, p < .001. Per teachers’ grade level, both elementary and middle school teachers yielded significant increases in scores from Year 1 to Year 2 and Year 2 to Year 3, but there were no significant differences in scores within any of the grade-level teachers for any year.
Variations by school
Most teachers had EVAAS scores that followed a similar pattern of scores for all teachers in that scores significantly increased from Year 1 to Year 2 and from Year 2 to Year 3. However, unlike teacher subgroups, teachers within several school types also yielded statistically significant differences in scores between Year 2 and Year 3 (see Table A3 in the supplementary online material for additional details: http://bit.ly/1rmYKIJ).
As per the proportions of students from racial minority backgrounds, teachers in schools with the lowest relative populations of minority students had significantly higher scores in all 3 years compared with teachers in schools with the highest relative populations of minority students (p < .01 in Year 1; p < .001 in Years 2 and 3). Nearly identical findings held true for teachers who yielded relatively lower EVAAS scores and taught relatively larger populations of FRL and SPED students (p < .001 in Years 1–3 for both group comparisons). Finally, teachers in schools with the lowest relative ELL populations had higher scores than teachers in schools with the highest relative ELL populations for Year 2 (p < .01) and Year 3 (p < .001) (see Table A3 for additional details on the differences in EVAAS scores between these groups).
These findings suggest that teachers in schools with the lowest relative populations of minority, FRL, SPED, or ELL students are more effective. Or, perhaps, and in line with current research on other VAMs (Amrein-Beardsley & *Collins, 2012; Capitol Hill Briefing, 2011; Hill et al., 2011; McCaffrey et al., 2004; Newton et al., 2010; Rothstein, 2009, 2010, 2014; Rothstein & Mathis, 2013), the EVAAS may be biased against teachers who teach relatively higher proportions of these students.
Finally, as per the general numbers of students that teachers teach as based on overall enrollment figures, while teachers in schools with the highest total enrollments had significantly higher EVAAS scores than teachers in schools with the lowest total enrollments in Year 1 (p < .05), this was not a pattern of note, or of any statistical or practical significance.
Results from these analyses suggest that the EVAAS does not, at least in HISD, offer states, districts, and schools “precise, reliable and unbiased [emphasis added] results that go far beyond [emphasis added] what other simplistic [value-added] models found in the market today can provide” (SAS Institute, n.d.). If the EVAAS offered truly unbiased results, we would not expect to see significant differences in EVAAS scores between different types of teachers (e.g., teachers who teacher different grades or subjects, teachers who teach in schools with different compositions of students per students’ background characteristics). In short, while EVAAS estimates may not be as unimpaired by potentially biasing variables as SAS claims, they may also be inaptly used against teachers given potentially serious issues with estimate bias.
Implications
Findings from this study are noteworthy given the extent that this type of empirical evidence about the EVAAS had not previously been made public due to the reasons mentioned prior. Given the results of our study, especially those findings (e.g., reliability coefficients) that directly contradict the reliability coefficients cited by SAS researchers (i.e., White et al., 2011), we believe it is in the public’s best interests for to SAS to obtain and provide external independent support of the EVAAS, especially as public taxpayer funds are used to purchase such components of teacher evaluation systems. Until external reviewers can verify that for which the EVAAS is marketed matches what is delivered and realized in practice, state and district consumers (many of whom do not feel that they have the statistical prowess to ask the right questions, interpret the right answers, or put appropriate data safeguards and deliverables into their contracts (Amrein-Beardsley, 2008; Amrein-Beardsley & *Collins, 2012) are at risk.
Acquiring external independent support of the EVAAS, or any VAM for that matter, becomes grossly important when states and districts require and/or utilize such VAM-based output in consequential, high-stakes decisions that, for example, might not hold up in a court of law (e.g., see Albuquerque Federation of Teachers v. New Mexico Public Education Department). While such lawsuits and related issues are of great concern, of potentially greater concern is that the theory of change that assumes that teachers can be objectively held accountable for their students’ achievement over time, frequently distorted by multiple players across multiple policy contexts, supports consequential personnel decisions also being made for teachers based on, at least in part, the objective data yielded via VAMs, and specifically in this case, the EVAAS. Accordingly, it is imperative that any system for which states or districts buy into is empirically supported and substantiated, especially before any consequential decisions about teachers are made. This goes for all measurement systems used to evaluate teachers, especially if output is to be used for consequential decision-making purposes.
In addition, and in line with the prior point, it is also imperative that all measures of teacher effectiveness be empirically supported and substantiated, not just VAMs. While VAMs have certainly been the most contested measure of teacher evaluation to date, we would be remiss to not call for examinations of other measures, as well. While we investigated the issues of reliability, validity, and bias in relation only to teachers’ VAM scores, it would also be prudent to, for example, investigate the same aspects regarding teachers’ observational scores (i.e., IP scores in Houston), student and/or parent perception survey scores, and other measures utilized by states and districts, especially if those measures are used for consequential decision-making purposes. Also, given the heterogeneous nature of states’ and districts’ schools regarding both student and teacher demographics, it is also necessary to continue to examine, specifically, if and to what extent all teacher evaluation measures are biased based on such student and teacher characteristics. However, while such investigations are warranted, it is worth noting that such within school variation cannot be analyzed across teachers with different classroom compositions. While such additional investigations did not directly fall within the scope of this study, we call other researchers to undertake such endeavors as well.
Conclusion
Overall, results from this study indicate that the EVAAS might perform in line with other VAMs. While some methodological aspects of the EVAAS model (e.g., reliability) seem slightly better than other available VAMs, other aspects (e.g., bias) may be of concern, especially given SAS’s marketing claims to the contrary. More specifically, indicators suggest that the EVAAS might be comparable to or a possibly bit below the average observed estimates across other VAMs in terms of convergent-related evidence of validity. Results also suggest that the EVAAS might be a bit above the average observed across other VAMs in terms of reliability over time. Finally, the estimates derived via the EVAAS, despite statements about the EVAAS’s capacity to block and control for bias, may be relatively more biased against teachers teaching higher proportions of certain students.
Those who use or might use the EVAAS in the future should also proceed with caution when making both low- and high-stakes decisions about teachers and schools as based on EVAAS estimates, as is also recommended for all other users of all other VAMs elsewhere (see, for example, Blazar et al., 2016), regardless of whether the VAMs of interest are provided commercially or are not-for-profit.
Supplemental Material
EVAAS_SAGEOpen_Appendix – Supplemental material for Methodological Concerns About the Education Value-Added Assessment System (EVAAS): Validity, Reliability, and Bias
Supplemental material, EVAAS_SAGEOpen_Appendix for Methodological Concerns About the Education Value-Added Assessment System (EVAAS): Validity, Reliability, and Bias by Audrey Amrein-Beardsley and Tray Geiger in SAGE Open
Footnotes
Declaration of Conflicting Interests
The author(s) declared no potential conflicts of interest with respect to the research, authorship, and/or publication of this article.
Funding
The author(s) received no financial support for the research, authorship, and/or publication of this article.
Notes
Supplemental Material
Supplemental material for this article is available online.
References
Supplementary Material
Please find the following supplemental material available below.
For Open Access articles published under a Creative Commons License, all supplemental material carries the same license as the article it is associated with.
For non-Open Access articles published, all supplemental material carries a non-exclusive license, and permission requests for re-use of supplemental material or any part of supplemental material shall be sent directly to the copyright owner as specified in the copyright notice associated with the article.