
Abstract
A reliability generalization meta-analysis was performed to explore the relationship between study factors and levels of alpha reliability for the 15 subscales of the Motivated Strategies for Learning Questionnaire (MSLQ). The MSLQ has been widely adapted over the past 25 years to investigate the role of motivation and strategies in learning, primarily at the postsecondary level. A literature search from the years 1991 to 2015 yielded 295 peer-reviewed journal articles and 1,369 alpha reliability coefficients. Articles were coded for six potential moderator study variables. A novel varying coefficient (VC) model was adopted to determine average reliabilities across studies for each subscale and to perform multiple regression analyses to identify study variables that may moderate alpha reliability estimates. Commonality analyses were used to aid in interpretation of regression results. Meta-analyzed alpha reliabilities were lower than values published in the test manual for all but three of the subscales. Ability of specific moderators to predict score reliability varied across subscales; however, studies in North America, in English, or using a 7-point response scale generally corresponded to increased reliability estimates. Knowledge of expected levels of score reliability under varying sample and study conditions may provide useful information for researchers planning future use of the MSLQ.
Keywords
Student motivation and learning strategies have long been recognized as important predictors to student success. Prior to the mid-1980s, research in this area focused on individual differences and learning styles without providing clear connections to the manner in which students acquire new knowledge through behaviors and cognition (Duncan & McKeachie, 2005). Over time, a recognition emerged that learning occurs through an interplay of various internal and external sources. In response, Pintrich, Smith, Garcia, and McKeachie (1991, 1993) developed the Motivated Strategies for Learning Questionnaire (MSLQ), which was based on a self-regulated learning perspective, taking into account cognitive, motivational, and behavioral factors of learning within a social context (Pintrich, 2004). Thus, the development of the MSLQ grew out of a pragmatic need for a theoretically based instrument for use by faculty and students alike to improve postsecondary learning. Subsequently, the MSLQ has served to emphasize the interplay between cognition and motivation in learning, helped to operationalize the constructs of self-regulated learning theory, and provided a useful tool to perform empirical investigations of these constructs (Credé & Phillips, 2011; Duncan & McKeachie, 2005).
Prevalence of Use
The MSLQ has enjoyed widespread use in the evaluation of the effects of course designs on student learning, characterization of motivation and use of learning strategies across various target populations, and exploration of motivational constructs and individual differences in self-regulated learning (Duncan & McKeachie, 2005). The instrument has been widely utilized in the United States and internationally, having been translated into at least 11 languages other than English. Although the MSLQ was designed for use in a postsecondary environment, subscales of the instrument have been used in settings ranging from elementary school (e.g., Andreou & Metallidou, 2004) through adult online education (e.g., Richardson, 2007). Use of the MSLQ has varied widely across research fields, study designs, and populations and on the subscale components administered. The popularity of administering the MSLQ might be attributed to the fact that it is in the public domain, and that the modular nature of the instrument allows for easy use of some or all of the 15 subscales, depending on the needs of the researcher. Indeed, based on Duncan and McKeachie’s (2005) sample of 56 empirical studies using the MSLQ, researchers appear more frequently to use only portions of the instrument, rather than the entire scale.
Structure of the MSLQ
The college version of the MSLQ (Pintrich et al., 1991, 1993) is an 81-item self-report instrument containing 15 subscales divided into motivation and learning strategies sections. Items are scored on a Likert-type scale anchored at 1 (not at all true of me) and 7 (very true of me), and scale scores are based on means across items in the scale, rather than sum totals. After several modifications, the final version was administered in 1990 to 380 college students in the Midwestern United States and scores were subjected to psychometric analysis (Pintrich et al., 1991).
The organizational structure of the MSLQ is provided in Table 1. The motivational scales consist of 31 items addressing three theoretical components of motivation: value beliefs, expectancy, and affect (Duncan & McKeachie, 2005). Value beliefs are assessed with three subscales pertaining to Intrinsic Goal Orientation (four items), Extrinsic Goal Orientation (four items), and Task Value (six items). Expectancy is assessed with two subscales, Self-Efficacy (eight items) and Control Beliefs About Learning (four items). Finally, affect is assessed through a single subscale concerning Test Anxiety (five items). As reported in the test manual (Pintrich et al., 1991), alpha reliabilities for scores obtained from the 380-student sample ranged from .62 for the Extrinsic Goal Orientation subscale to .93 for the Self-Efficacy subscale (Table 1).
Organization of the Motivated Strategies for Learning Questionnaire.

Note. Manual—estimates reported by Pintrich, Smith, Garcia, and McKeachie (1991); Hilpert—estimates reported by Hilpert, Stempien, van der Hoeven Kraft, and Husman (2013).
The learning strategies scales consist of 50 items, which include nine subscales addressing cognitive, meta-cognitive, and resource management strategies. Cognitive strategies are assessed with four subscales measuring Rehearsal (four items), Elaboration (six items), Organization (four items), and Critical Thinking (five items). Meta-cognitive strategies are evaluated with a single, 12-item subscale. The final four subscales address aspects of resource management and include Time and Study Environment Regulation (eight items), Effort Regulation (four items), Peer Learning (three items), and Help Seeking (four items). Alpha reliability estimates for the learning strategies subscales provided in the MSLQ test manual are generally lower than those for the motivational scales, ranging from .52 for the Help Seeking subscale to .80 for the Critical Thinking subscale (Table 1).
Reliability and the MSLQ
Despite the widespread use of the MSLQ, several concerns have been raised about the psychometric properties of the instrument. In terms of the internal consistency reliability estimates obtained for the various subscales, Pintrich et al. (1993) claimed that the “coefficient alphas for the motivational scales are robust, demonstrating good internal consistency” (p. 808) and “the alphas for the learning strategies scales are reasonable” (p. 809). However, they did not explain by what evaluative standard they are determined to be “good” or “reasonable.” Although the authors may have made their robustness determination based on comparison data collected during development of the MSLQ, it is well known that reliability estimates such as coefficient alpha vary with changing sample characteristics, study conditions, and score distributions (Crocker & Algina, 1986; Pedhazur & Schmelkin, 1991; Thompson, 2003; Wilkinson & American Psychological Association [APA] Task Force on Statistical Inference, 1999). Nunnally (1978) provided some often-cited rules of thumb to determine the adequacy of levels of reliability suggesting that “reliabilities of .70 or higher will suffice” when “in early stages of research on predictor tests or hypothesized measures or a construct” (p. 245) and that reliabilities of at least .80 are appropriate for basic research purposes. However, of the 15 MSLQ subscales for which Pintrich et al. (1993) reported reliabilities, nine subscales (60%) demonstrated sufficient score reliability estimates to meet the .70 standard for introductory research and three subscales fell at the .68 or .69 level. Only four subscales (27%) met the more appropriate standard of .80 for basic research in theory testing with an additional subscale at the .79 level.
Due to its modular nature and ease of administration, researchers have routinely utilized instrument sections (e.g., Nielsen, 2004), scales (e.g., Arend, 2007), subscales (e.g., Hodges & Kim, 2010), and individual test items (e.g., Husman & Hilpert, 2007) of the MSLQ to fit their particular research needs. However, caution should be exercised when selecting items in this manner as researchers should not assume that psychometric properties of instrument components remain consistent across various applications, study designs, samples, and time. For example, MSLQ subscale alpha reliability estimates obtained by Hilpert, Stempien, van der Hoeven Kraft, and Husman (2013) consistently met or exceeded those reported by Pintrich et al. (1991) in the MSLQ manual (Table 1). For three subscales, Extrinsic Goal Orientation, Control of Learning Beliefs, and Help Seeking, the differences were .10 or higher, although both sets of estimates were based on data collected from similar samples of undergraduate college students in the United States. For each study, the consistency of scores as measured by reliability coefficients will vary for different sample characteristics. Thus, a study is warranted that meta-analytically examines the predictors of reliability coefficients for the MSLQ when administered across a variety of samples
Reliability Generalization (RG)
In general, score validity concerns the degree of trustworthiness of inferences made from the data collected, and to evaluate score validity the consistency of measurement, or reliability, must also be known. Thus, when performing substantive studies, researchers seek to utilize instruments that consistently and accurately measure constructs of interest and a failure to do so may lead to false conclusions (Thompson, 2003).
It has long been known that estimates of reliability vary with changing sample characteristics, study conditions, and score distributions (Crocker & Algina, 1986; Pedhazur & Schmelkin, 1991; Thompson, 2003). For this reason, journal editors (Thompson, 1994; Vacha-Haase, Henson, & Caruso, 2002) and professional organizations (American Educational Research Association, APA, & National Council on Measurement in Education, 1999; APA, 2001; Wilkinson & APA Task Force on Statistical Inference, 1999) have advocated that authors always provide reliability estimates for the data in hand. Such transparent reporting practice encourages researchers to take score reliability into account when interpreting study results, and provides consumers of research critical information necessary to make informed judgments regarding the viability of data interpretations and study conclusions. In instances where primary researchers appropriately have reported psychometric data for administration of a particular instrument, it may be desirable to examine score reliability on multiple occasions to discern how measurement error may vary under fluctuating study conditions. Such an approach requires a quantitative integration of reliability coefficients, which is best suited for meta-analytic methods such as RG (see Sánchez-Meca, López-López, & López-Pina, 2013; Vacha-Haase, 1998; Vacha-Haase & Thompson, 2011).
RG is a meta-analytic method for synthesizing reliability coefficients across studies (Caruso, 2000; Vacha-Haase, 1998) and is “used to explore variability in reliability estimates and characterize the sources of this variance” (Vacha-Haase et al., 2002, p. 562). RG studies provide insight into the nature of score reliability in prior applications of a test, which may help future researchers estimate expected levels of measurement error and inform study design decisions regarding effect sizes, power, and statistical significance (Henson & Thompson, 2002; Nimon, Zientek, & Henson, 2012). It is recommended that authors cite available RG results when describing tests used in substantive studies to provide comparative data to facilitate interpretation of outcomes (Leech, Onwuegbuzie, & O’Conner, 2011). Bonett (2010) encourages researchers planning use of a test to perform a preliminary RG on a small number of carefully selected, high-quality studies to obtain more accurate estimates of expected reliability and to identify potential effects of moderator variables. Such retrospective and prospective practices promote meta-analytic thinking, which serves to build a historical contextual framework in which to better evaluate single-study outcomes (Cumming & Finch, 2001; Henson, 2006; Thompson, 2002). As Bonett (2010) notes, “the use of meta-analysis to statistically incorporate prior information into a current study has the potential to revolutionize behavioral research and help achieve the goals of an integrative and cumulative science” (p. 380).
RG Method
Since 1998, well more than 100 RG studies have been published on an assortment of psychological instruments employing a wide variety of meta-analytic and statistical methods; however, there appears to be no firmly established best practice when performing such studies (Holland, 2015; Sánchez-Meca et al., 2013). Several methodological decisions must be made by the RG meta-analyst, including selection of statistical models for coefficient synthesis and moderator analysis, and the transformation and weighting of coefficients within these models.
Two classes of statistical models traditionally have been used in meta-analyses: the fixed-effects (FE) model of Hedges and Olkin (1985) and the random-effects (RE) models of Hedges and Vevea (1998) or Hunter and Schmidt (2004). Classical FE models are based on the assumption that study coefficients are all estimating the same population parameter, and any deviation from the parameter is the result of sampling error (Bonett, 2010; Hedges, 1992). In general, FE models are recommended when one wishes to generalize the results to studies similar to those included in the meta-analysis. FE methods have been determined to exhibit poor performance under conditions typical of many meta-analyses and are generally not recommended for routine use (Bonett, 2008; Hunter & Schmidt, 2004; Rodriguez & Maeda, 2006; Schmidt, Oh, & Hayes, 2009).
RE statistical models are based on the assumption that multiple population parameters exist, and that each study included in the meta-analysis represents a sample of a hypothetical population of past or future studies. Thus, each coefficient is considered to be an estimate of its own population parameter, which may vary from study to study. RE models include two error components in synthesized reliability estimates: the within-study variance and the between-study variance. Due to the additional error accounted for by the between-study variance component, RE models tend to produce wider confidence intervals (CIs) than FE models when synthesizing reliability coefficients across studies (Sánchez-Meca et al., 2013). The application of an RE model in the meta-analysis of coefficient alpha by Rodriguez and Maeda (2006) has been called into question based on the introduction of bias in parameter estimates, lack of interpretable estimates of parameter variance, and violations of sampling assumptions of the model (Bonett, 2010).
First proposed for use in meta-analysis by Laird and Mosteller (1990), a VC statistical model has been applied by Bonett (2010) to the meta-analysis of coefficient alpha. The VC model provides an alternative to traditional FE or RE models, retaining beneficial characteristics of both approaches. As a type of FE model, results from the VC analysis may be generalized only to studies similar to those included in the meta-analysis. However, rather than assuming that alpha estimates are all equal to a single fixed parameter, each study is assumed to estimate its own population reliability coefficient, similar to the RE approach. The magnitude of error components are moderate under the VC model and produce CIs intermediate between those estimated under FE or RE models (Sánchez-Meca et al., 2013). The VC model has excellent small-sample performance characteristics in parameter estimation, provides more accurate CIs, and can be used over a much wider range of problems than traditional models (Bonett, 2010). For these reasons, Bonett’s VC model was utilized for the current study.
To synthesize coefficients across studies, Bonett (2010) recommends calculation of the simple arithmetic mean of unweighted, untransformed alphas. To derive CIs for these means, the VC model utilizes a log-complement transformation, ln(1 – α j ), where α j is the alpha estimate of study j, to stabilize variance and normalize the distribution of alpha, and applies the delta method to estimate variance from each study. Individual study variances, are then used to determine CIs for the mean (see Bonett, 2010). Krizan (2010) has developed an Excel worksheet for calculation of means and CIs based on Bonett’s proposed methods.
Bonett (2010) recommends use of ordinary least squares (OLS) linear regression to investigate the potential effects of both categorical and continuous moderator variables, using transformed alpha, ln(1 – α j ), as the outcome variable. The linear function may be expressed as

where

and the covariance matrix estimated as

where
Because the dependent variable in this model is based on a normalizing transformation of alpha, it is suggested that b k be back-transformed as exp(b) to improve interpretation of regression coefficients. In this manner, exp(b) may be interpreted as “the multiplicative change in nonreliability for every 1-point increase in the kth predictor variable while the values of all other predictor variables are held constant” (Bonett, 2010, p. 372). Thus, exp(b) values less than 1.0 indicate that the predictor variable is related to decreases in unreliability (i.e., increases in reliability), taking into account all other predictors. Development of a regression model relating study moderator variables to reliability estimates may allow researchers to predict expected values of coefficient alpha in future studies, given known values of predictor variables.
Purpose
The purpose of the current study is to perform an RG meta-analysis to explore the variability of MSLQ subscale score reliability across studies and to determine the potential relationship between study factors and the variability of subscale reliability. In light of the contributions and widespread use of the MSLQ in research surrounding learning motivation theory, an evaluation of factors that predict measurement reliability from MSLQ administrations would be beneficial for researchers who are contemplating using the MSLQ in the future. Results from an RG study will be of value to researchers who will be able to make educated and informed decisions when planning their study on motivational and learning strategies for their given sample.
Method
Peer-reviewed journal articles utilizing the MSLQ were collected in two waves. In September 2010, articles were identified using the online search engine, Google Scholar, with filters set to return works published in the years 1991 through 2010 in which either of the two seminal MSLQ publications (i.e., Pintrich et al., 1991, 1993) were cited. In an effort to capture all citations from 2010, this process was repeated in July 2013. The two searches returned 903 unique citations for which articles were procured. Of the available sources, 315 studies were published in peer-reviewed journals and administered one or more subscales of the MSLQ. These articles were inspected for reporting of reliability coefficients. A total of 168 studies were removed from the analysis due to insufficient reliability reporting, including failure to report reliability for data collected, or reporting coefficients in an unusable format, such as ranges of values over several subscales. Alpha coefficients from the remaining 147 articles were collected and study variables coded. The second wave of data collection was performed in September 2017, whereby journal articles published from 2011 to 2015 were identified utilizing Publish or Perish (Version 5; Harzing, 2016), a software program that retrieves citations from Google Scholar. Separate queries using the Lookup Citations function were conducted for each of the two Pintrich et al. (1991, 1993) seminal articles. A total of 625 citations were retrieved and after the removal of duplicates and books, 545 citations remained. Sources for citations were obtained and, on further inspection, 276 studies were not available, not peer-reviewed journal articles, could not be translated, or did not utilize the MSLQ. Of the remaining 269 articles utilizing the MSLQ, 121 did not report alpha reliability coefficients in a manner suitable for meta-analysis, leaving 148 articles suitable for the current study.
Combining articles from both waves of data collection, reliability coefficients from a total of 295 articles were available for further analysis. Thus, among the 584 studies reporting use of the MSLQ, only 51% provided alpha reliability coefficients for the data in hand. We acknowledge that focusing on peer-reviewed journals may potentially create a publication bias—however, we believe it is the most efficient way to focus our search for this popularly used measure. A list of articles included in the study is provided in Appendix B.
Coding
Articles initially were coded by four trained raters and then two additional raters were added for the second wave. Coding was verified by two of the authors, who reached agreement in cases where opinions differed. Multiple reliability estimates from a study were utilized if they were obtained from distinct samples. In cases where several estimates were reported for the same sample over multiple administrations (e.g., pretest/posttest), only the first estimate was included in the analysis in an effort to maintain independence of observations (see Romano & Kromrey, 2009, for a discussion of independence issues in RG studies).
Components of the MSLQ have been applied internationally to a variety of research settings and applications that may vary widely from the original studies performed by Pintrich and colleagues (1991) in the United States. Researchers have also freely modified MSLQ subscales by changing item wording to fit a particular need, adding or deleting items from scales, and translating the instrument into languages other than English. It is of interest in the current study to determine how such varying study applications and instrument modifications may relate to variability in score reliability.
An initial set of coding variables was selected based on those utilized in prior RG studies (Henson & Thompson, 2002; Vacha-Haase & Thompson, 2011), including participant, study, and instrument characteristics. From these, we selected key potential moderator variables that reflected typical modifications of the instrument, and from a practical standpoint, other features most likely to be reported in published studies as recommended by the American Educational Research Association (2006) and the APA (2010). Coded variables included the age, gender, and race/ethnicity of participants; the educational setting and location (country) of the study; and instrument characteristics, including number of response scale choices, wording modifications, and language of translation.
Following the coding process, the data set was inspected to determine which of the coded study variables were reported in sufficient numbers to adequately represent the sample of studies and support the planned moderator analyses. Of the 344 samples described in the primary studies, only 27% included information on participant race/ethnicity and only 62% included the mean age; hence, these predictors were excluded from the analysis. Categorical variables consisting of multiple levels, such as study location, educational setting, and instrument language, were collapsed into dichotomous variables to reduce the number of predictor variables in the model. Ultimately, five categorical variables were dichotomously coded to indicate whether or not the application was similar to the original study by Pintrich et al. (1991). These variables included use of a 7-point response scale, use of original item wording, use of an English version of the instrument, selecting a study population consisting of postsecondary students, and performing the study in North America. In addition a single quantitative variable, percentage of males in the sample was also coded and included in the moderator analysis.
Results
Study Characteristics
Alpha coefficients were reported for 344 unique samples across the 295 articles subjected to review. Although the majority of samples (67%) included undergraduate students, 32% included students from Grades 3 through 12, and 15% included students at a graduate level (Table 2). Studies included in the analysis were performed in 32 different countries, with 52% of samples originating in the United States and Canada; however, all continents were represented. In addition, study authors reported use of translations of the MSLQ into 14 different languages, most commonly Turkish, Dutch, Spanish, and Chinese. In 61% of the studies, researchers utilized the original 7-point Likert-type scale (Table 2).
Study and Sample Characteristics.

Note. The totals provided exceed the number of studies included in the meta-analysis due to studies conducted in multiple countries, using multiple languages, and samples derived from multiple educational settings.
Because researchers may have used one, several, or all the 15 MSLQ subscales in their studies, the number of reliability estimates obtained differed markedly across the subscales (Table 3). A total of 1,369 coefficients were meta-analyzed across all studies and subscales. Mean number of coefficients collected for each subscale was 91.2 (SD = 38.6). The most commonly represented subscales were Self-Efficacy, with 199 coefficients collected, and Metacognitive Self-Regulation, with 149 coefficients, whereas the fewest number of coefficients were collected for the Help Seeking and Peer Learning subscales, with 57 and 46 coefficients meta-analyzed, respectively.
Summary Statistics for the Meta-Analysis of Alpha Reliability for the Subscales of the MSLQ.
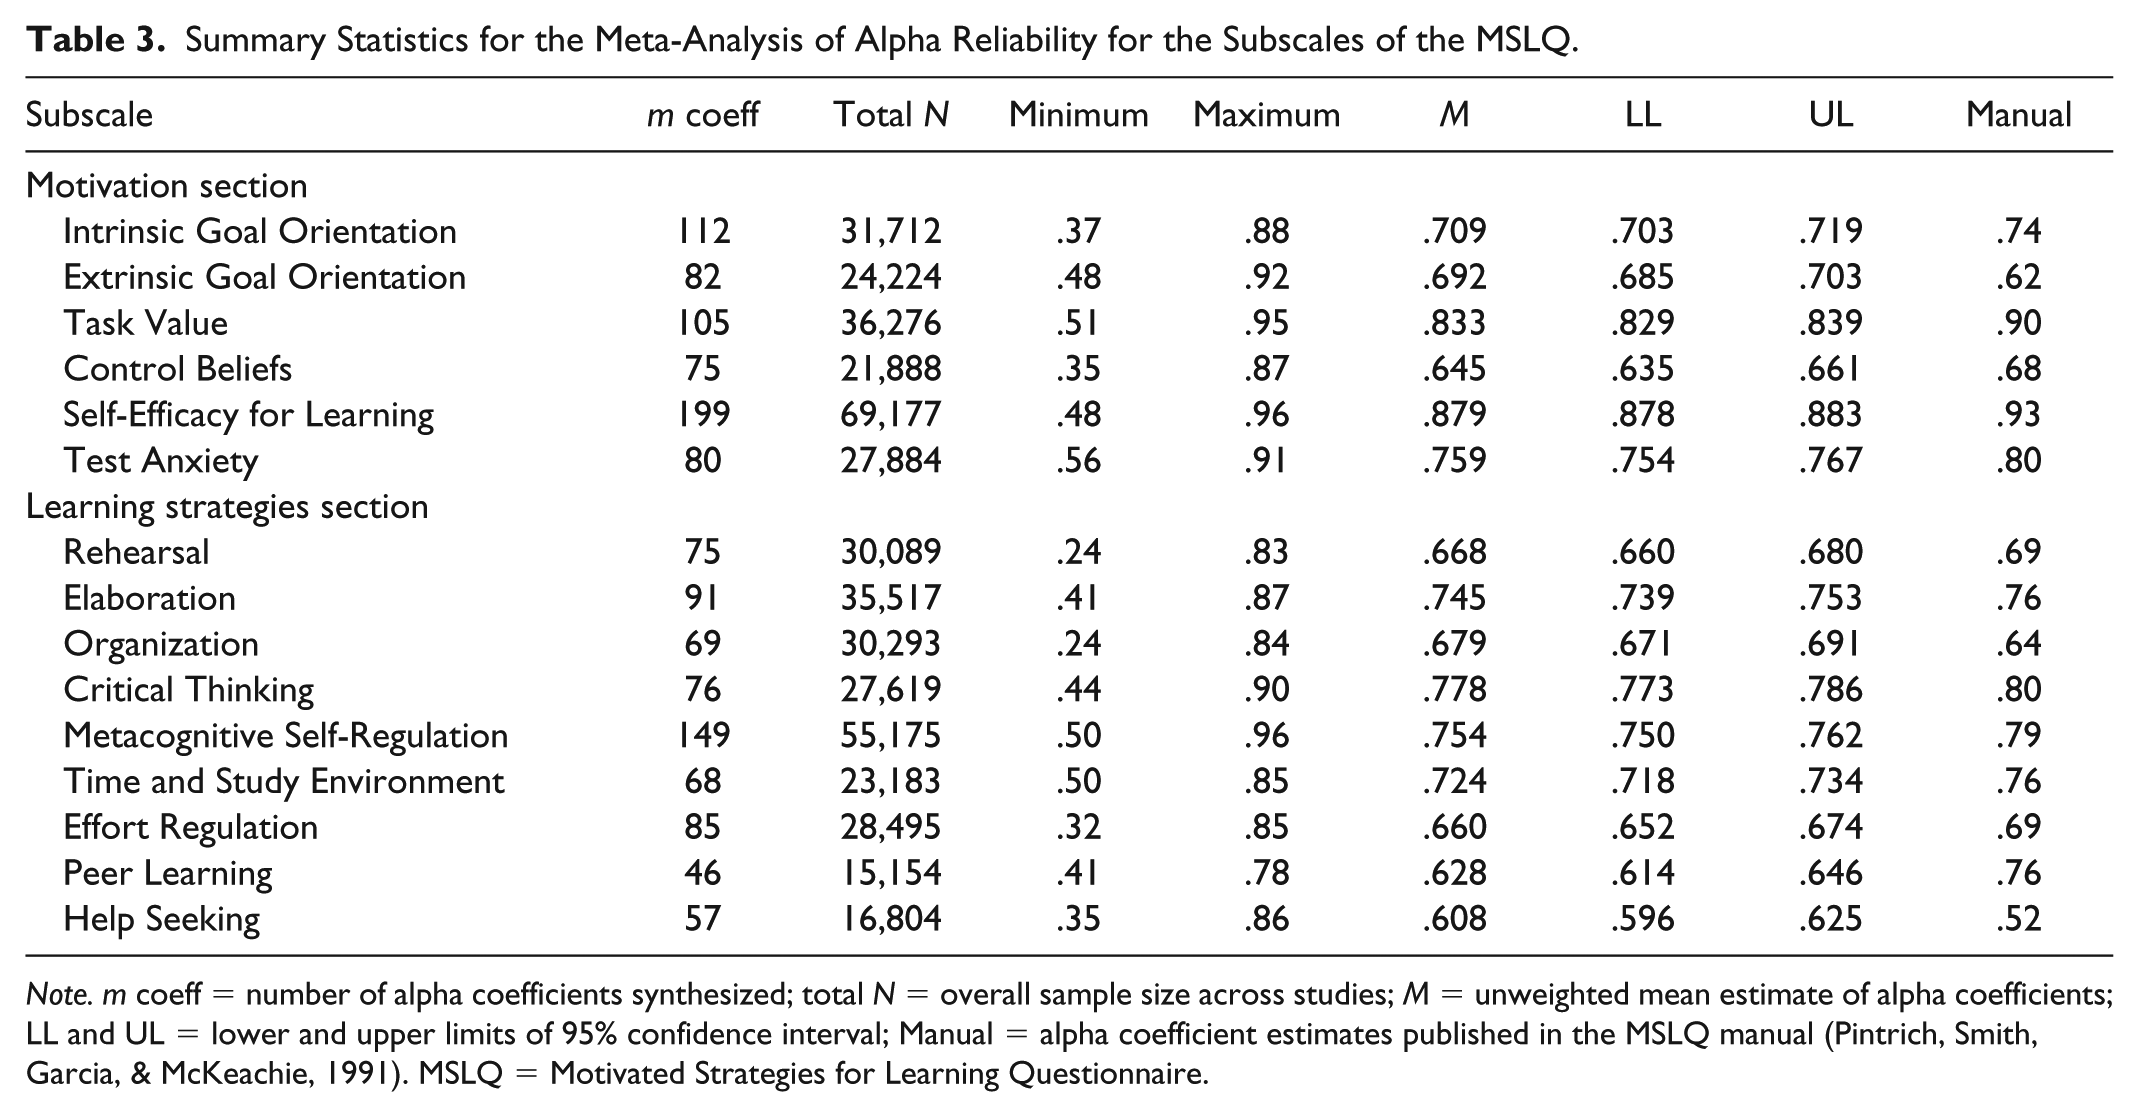
Note. m coeff = number of alpha coefficients synthesized; total N = overall sample size across studies; M = unweighted mean estimate of alpha coefficients; LL and UL = lower and upper limits of 95% confidence interval; Manual = alpha coefficient estimates published in the MSLQ manual (Pintrich, Smith, Garcia, & McKeachie, 1991). MSLQ = Motivated Strategies for Learning Questionnaire.
Mean Reliability Scores
Following Bonett’s (2010) method, we derived an unweighted average estimator of alpha reliability across studies and a 95% CI for each subscale, based on all study coefficients available. Estimates ranged from .608 for Help Seeking to .879 for the Self-Efficacy subscale (Table 3). Synthesized alpha reliabilities were generally lower than those published in the MSLQ manual (Pintrich et al., 1991), with the exception of the Extrinsic Goal Orientation, Organization, and Help Seeking subscales. Two of the motivation subscales and five of the learning strategy subscales produced mean reliability scores of less than .70. CIs estimated with the VC approach were relatively narrow, with widths ranging from .005 for Self-Efficacy to .032 for Peer Learning. It was not surprising that the subscale with the greatest reliability estimate (Self-Efficacy) had the narrowest CI, as its estimation is dependent on the variance of the estimate, which tends to decrease with increasing reliability, the magnitude of reliability, as well as sample size, which was the largest of any of the subscales.
Moderator Analysis
A general linear model was utilized to examine moderator effects of sample and study characteristics on estimates of reliability. Using Bonett’s (2010) OLS multiple regression method, categorical and quantitative study variables were used as predictors of log-complement, bias-adjusted study reliability estimates.
Multiple regression methods require that all predictor and outcome variables are represented for all records in the data set. An issue commonly encountered in meta-analytic studies is that authors of primary research may not be fully transparent in their description of sample characteristics and study design; thus, data collection is often plagued by missing data for potential moderator variables (Thompson & Vacha-Haase, 2000). In this study, missing data were handled through listwise deletion, which had the potential to cause considerable reduction in sample size for some subscales. A summary of the coded predictor variables and number of missing values for each subscale is provided in Table 4. The predictor variable most commonly missing from the data set was percent male, with missing values ranging from 5.3% for the Critical Thinking scale to 21.3% for Test Anxiety, followed by the 7-point scale predictor, which had a maximum of 6.5% missing data for Peer Learning. Despite the loss of records due to missing data, final sample sizes were near or above 60 for all but the Peer Learning and Help Seeking scales. Final sample sizes and results of the OLS moderator analyses are provided in Table 5.
Summary of Predictor (Moderator) Variable Coding and Missing Data.
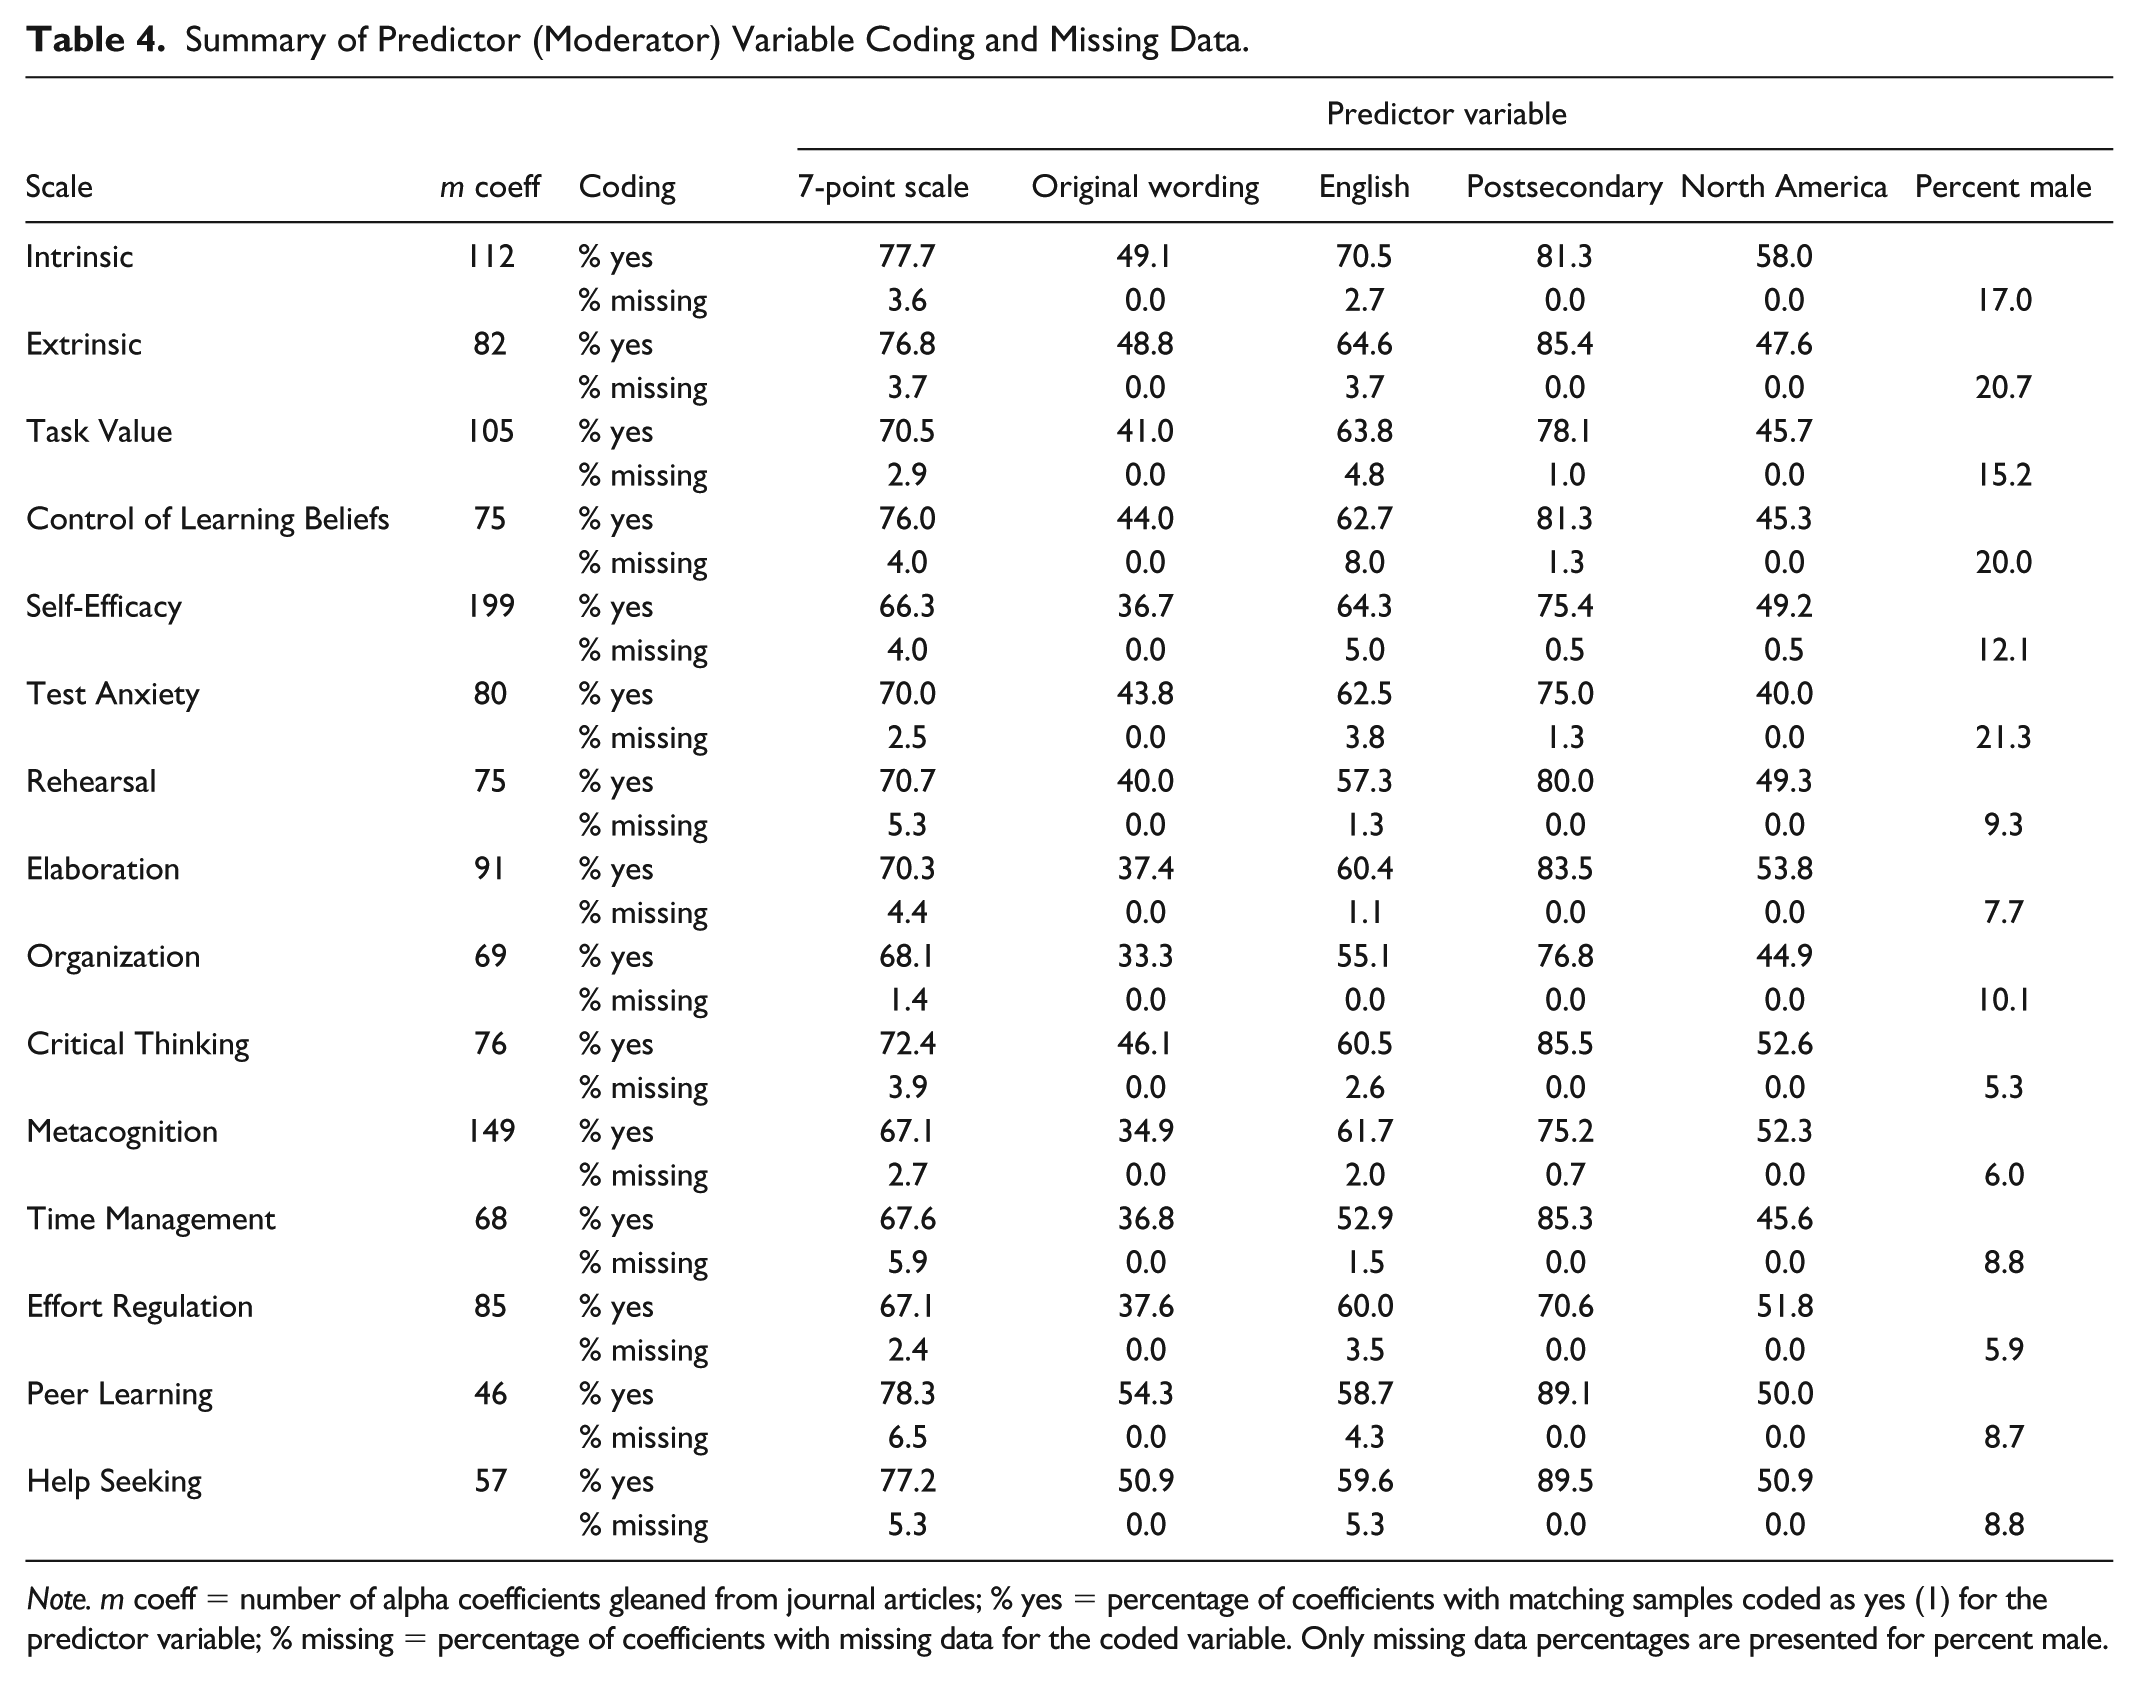
Note. m coeff = number of alpha coefficients gleaned from journal articles; % yes = percentage of coefficients with matching samples coded as yes (1) for the predictor variable; % missing = percentage of coefficients with missing data for the coded variable. Only missing data percentages are presented for percent male.
Results of OLS Regression of Moderator Variables for MSLQ Subscales.

Note. All variables except percent male are dichotomous categorical and coded 1 if study characteristics matched the descriptor and 0 if not. For example, if the study was conducted in North America, the article was coded 1, and coded 0 if not in North America. Outcome variable is bias-adjusted log-complement transformation of study alpha coefficient. Underlined values of b represent coefficients statistically significantly different from 0 at α = .05. b = estimate of regression coefficient; SE = standard error of b × 102; p = significance of t test for b; exp(b) = back-transformation of b; m = number of studies. OLS = ordinary least squares; MSLQ = Motivated Strategies for Learning Questionnaire.
Commonality analysis aids in interpreting regression results by partitioning the total R2 effect size into common and unique variance accounted for by the predictor variables (Nimon, Lewis, Kane, & Haynes, 2008; Zientek & Thompson, 2006). Commonality analyses allow for interpretation of a predictor variable’s contribution to the model both alone and in combination with other predictors. Results of commonality analysis for potential moderator variables are provided in Table 6.
Commonality Analysis Results for MSLQ Subscales.

Note. m = number of studies in each subscale analysis. MSLQ = Motivated Strategies for Learning Questionnaire.
OLS regression on transformed alpha coefficients revealed that reliabilities of all 15 subscales appeared to be moderated by at least one of the study variables, with the exception of Extrinsic Goal Orientation, and most subscales appeared to have several moderating variables. Postsecondary, 7-point response scale, and English most often influence alpha across the subscales. Although the English variable most consistently positively affected reliability, there was much more variability among the other moderators, which showed positive relationships with reliability for some subscales, but negative relationships for others. North America was denied credit in the model for four constructs in the OLS analysis; however, this variable was a significant moderator in the commonality analysis. Table 7 contains a summary of moderator effects for both OLS and commonality analyses.
Relationships Between Predictors and Reliabilities Based on Regression and Commonality Analyses.

Note. CA = commonality analysis results; ordered by R2 values in commonality analysis; + indicates higher reliabilities; - indicates lower reliabilities. DC = denied credit in regression results but credit identified in commonality analysis results.
Seven-point response scales
Positive and negative b estimates of regression coefficients indicate that, for some subscales, 7-point response scales positively influenced reliability, but in other subscales negatively influenced reliability (Table 5). For Task Value, Self-Efficacy, Elaboration, Critical Thinking, and Metacognitive Self-Regulation, 7-point response scales resulted in higher reliabilities than those with other point values. However, for Effort Regulation and Help Seeking, 7-point response scales resulted in lower reliabilities.
Original item wording
As seen in Table 5, original item wording was a statistically significant predictor of reliability scores for five subscales. However, commonality analysis results indicate original wording was also a predictor of reliability scores for Peer Learning and Time Management, and to a lesser extent for Organization and Critical Thinking. Regression coefficients, together with commonality analysis results, indicated that retaining the original wording tended to result in higher reliability coefficients for Self-Efficacy, Control of Learning Beliefs, Organization, and Critical Thinking.
Postsecondary and percent male
Postsecondary was a statistically significant predictor of reliability scores for Self-Efficacy, Test Anxiety, Rehearsal, Metacognition, and Peer Learning subscales. The positive regression coefficients suggest that when the sample consisted of postsecondary students, the reliability coefficients were lower for Intrinsic, Organization, and Effort Regulation. Although percent male was a statistically significant predictor of reliability scores for six factors, the regression coefficients were relatively close to zero on all those factors. The reason for such low b values for this predictor is that variable values range from 0 to 100, whereas all other predictors are categorical and coded as either 0 or 1, which are on a similar scale as the criterion variable, transformed coefficient alpha. The negative regression coefficients indicated that when the sample consisted of more males, reliability scores were higher for Control of Learning Beliefs, Metacognition, and Elaboration.
English and North America
Commonality analysis results indicated that reviewing both unique and common contributions is important. Otherwise, the importance of North America would have been overlooked in three of the OLS results. North America was denied explanatory credit for Time Management and Help Seeking and to a lesser extent for Critical Thinking, although serving as suppressor effects for Metacognitive Self-Regulation. As seen in Table 7, of the 10 subscales in which North America served as a moderator, four demonstrated higher reliabilities when the study used North American participants. However, commonality analysis results also suggest three more scales would result in higher reliabilities using North American participants. Of the seven subscales in which English served as a moderator, six demonstrated higher reliabilities when the study was administered in English.
Discussion
One study conducted on one sample may provide information about a hypothesis, but improvements to a given field require comparisons of multiple studies with different study designs on various samples, and the ability to build on existing studies. Pintrich et al. (1991, 1993) understood that improvements to research on student motivation and learning would require the development of an instrument that was widely accessible to researchers. Thus, they developed the MSLQ. The result has been an instrument that has allowed researchers to investigate motivation and learning across a variety of samples for many years. Methodologists have noted that score reliability varies across samples and does not relate to the reliability of tests (Thompson, 2003). In fact, researchers, editorial boards, and national educational and psychological associations have long recognized the importance of reporting reliability for the data in hand (Thompson, 1994; Wilkinson & APA Task Force on Statistical Inference, 1999). Determining how reliability estimates vary across administrations and samples can help future researchers as they plan their studies (Nimon et al., 2012). Therefore, we conducted an RG study to determine predictors of reliability scores for the MSLQ.
RG of MSLQ Subscales
If reliability of scores for a test is generalizable across studies, one would expect subsequent reliability estimates to remain consistent with those obtained during the development of instruments and published in original psychometric studies and test manuals. Vacha-Haase (1998) developed RG as a method to determine whether score reliability might be appropriately generalized across study populations with varying characteristics. For the present RG study, population estimates of alpha reliability for the 15 subscales of the MSLQ were generated using a newly applied VC technique (Bonett, 2010). Based on the disparity between estimates of mean reliability from the current study and reliabilities published in the MSLQ manual (Pintrich et al., 1991), and the presence of moderator variables that appear to influence reliability across studies, alpha reliabilities of the subscales of the MSLQ do not appear to generalize to various study populations.
The results indicate the extent to which variables predicted reliability scores varied across subscales. Original item wording was important for some subscales, but not others. Postsecondary samples tended to result in higher reliability for five subscales, lower reliabilities for three others, and did not serve as a predictor for the remaining subscales. The predictors in our model served as better moderators for Metacognitive Self-Regulation reliabilities than any other subscale.
CIs for Mean Reliability Estimates
CIs for mean reliability estimates in the current study for all 15 subscales did not encompass estimates reported in the MSLQ manual (Pintrich et al., 1991). The three lowest reliability estimates reported in the manual were below the lower bound of the CIs reported in Table 3. Therefore, a plausible range of score reliability for those factors (i.e., Extrinsic Goal Orientation, Organization, and Help Seeking) might be higher than the manual indicates, and Extrinsic Goal Orientation may fall within an acceptable range. However, for the remaining 12 subscales, reliability estimates for scores in future studies might actually be lower than those reported in the Pintrich et al. (1991) manual, although the plausible ranges often contain levels of reliability above .70.
Table 3 indicates that eight subscales have mean reliability CIs with a lower bound greater than .70, which is considered an acceptable level of score reliability, and one additional interval contains the value .70. CIs for mean reliability scores suggest Peer Learning might be lower than the .76 reported by Pintrich et al. (1991) and not at an acceptable level, but the larger standard error suggests that these reliabilities might vary more across samples than many of the other constructs. Organization, Rehearsal, and Control Beliefs have upper bounds close to an acceptable range, and the remaining subscales have reliability scores that are acceptable across a variety of samples. Although it is important to keep in mind the varying number of items in each of these subscales (see Table 1), no clear patterns or explanations are discernable from our data.
Moderator Variables
Of the 90 regression coefficients generated through OLS analysis, 39 were statistically significant at α = .05, and for seven of the subscales, three or more of the six coefficients were statistically significant. Across all subscales in the study, variables that most commonly appeared to moderate reliability were postsecondary (eight subscales), 7-point scale (seven subscales), and English (seven subscales). Interestingly, none of the predictor variables appeared to moderate the Extrinsic Goal Orientation subscale, which may be an indication that reliability may generalize across a range of study factors for this scale.
Due to the log-complement transformation of study reliability in the regression analysis, estimates of b are difficult to interpret. However, exp(b) may be interpreted as the percentage change in the nonreliability (i.e., 1 – α) for every 1-point change in the predictor variable (Bonett, 2010). A value of exp(b) greater than one represents a decrease in reliability. Interpretation of values of exp(b) for postsecondary suggests that studies utilizing the MSLQ with college students produce scores with significantly higher levels of reliability than younger students for the Self-Efficacy, Test Anxiety, Rehearsal, Metacognitive Self-Regulation, and Peer Learning subscales. However, significantly lower score reliability was indicated for postsecondary for the Intrinsic Goal Orientation, Organization, and Effort Regulation subscales (Table 5).
Commonality Analysis
Inspection of effect sizes presented in Table 6 indicates that the amount of variance of the reliability scores explained by the six predictor variables was noteworthy for Peer Learning (R2 = .4841), Intrinsic (R2 = .3887), Test Anxiety (R2 = .3581), Time Management (R2 = .3591), and Task Value (R2 = .2772). The results were less noteworthy for Control of Learning Beliefs (R2 = .2067), Self-Efficacy (R2 = .2135), Metacognitive Self-Regulation (R2 = .1773), and Help Seeking (R2 = .1641).
Unique and common contributions
The largest unique contributions were for postsecondary for the Intrinsic, English for Test Anxiety, and English for Time Management subscales. When multicollinearity exists, predictors might be denied explanatory credit, particularly if variables do not make a unique contribution but share variance with other predictor variables. Original item wording and North America were denied predictive credit in OLS regressions for both Time Management and Peer Learning. Denial of credit was due to minimal unique contributions these variables made to the models despite relatively high levels of shared variance with other predictors. Thus, if statistical significance of OLS regression coefficients was used as the sole criterion for making a contribution to the model, original item wording and North America would have been denied predictive credit. For this reason, it is recommended that use of multiple regression models to detect potential moderators in RG studies are followed with commonality analysis to identify cases where credit may be denied due to shared variance among the predictors.
Possible suppressor effects
English and North America possibly serve as suppressor effects for Metacognitive Self-Regulation. In addition, original item wording possibly serves as a suppressor for Help Seeking. Suppressor effects have indirect predictive power but improve the overall model (Burdenski, 2000; Courville & Thompson, 2001; Pedhazur, 1997; Thompson, 2006). In the suppressor case, the bivariate correlation between the suppressor variable and the dependent variable is close to zero, the beta weight is not close to zero, and inclusion of the suppressor in the model increases the effect size, R2. Thus, researchers need to look beyond bivariate correlations when considering variables to include in future studies, otherwise important suppressor variables might be overlooked.
Study Limitations
As with any meta-analysis, the current study is limited by the quality and transparency of reporting in the included primary studies. We found that only 51% of studies reporting use of the MSLQ included reliability estimates for the data collected. The omission of studies may represent a publication bias, whereby authors may not report low score reliabilities, which potentially influences estimates of average reliability and the impact of moderator variables. Additional bias may also have been introduced by excluding dissertations, theses, and other gray literature, as authors of this research may be more likely to report unacceptably low reliability estimates than in peer-reviewed journals. In addition, the lack of reporting of key sample and study characteristics in primary studies served to limit both the sample size and the potential moderator variables available for analysis, which may result in underpowered moderator analyses (Hedges & Pigott, 2004) and model misspecification (Vacha-Haase & Thompson, 2011).
An additional limitation of the study is that the measure of reliability assessed was coefficient alpha, as that was the predominant internal consistency estimate reported. Although coefficient alpha assumes tau equivalence of factor loadings (Graham, 2006), a scant number of studies reporting on MSLQ data reported testing the assumption of tau equivalence. Uniquely, Berger and Karabenick (2011) reported using Raykov’s rho in lieu of coefficient alpha, because rho does not assume tau equivalence (Raykov, 1997).
Implications
The wide variability of alpha reported for MSLQ subscales suggests that researchers should not assume that future use will result in reliabilities similar to those reported in the test manual (Pintrich et al., 1991), especially when applying the instrument to populations and study conditions vastly different than the original norming study. Translations of the MSLQ typically resulted in decreased reliability estimates; thus, it is recommended that researchers requiring use of the MSLQ in languages other than English utilize established cross-cultural adaptation procedures, including back translation, cross-validation, and factor analysis (Sousa & Rojjanasrirat, 2011), or apply a previously validated adaptation (e.g., Lee, Yin, & Zhang, 2010). Researchers may also consider performing a small-scale RG on a carefully selected group of existing studies with characteristics similar to those in a planned future study to estimate expected reliabilities (Bonett, 2010). In addition, researchers reporting coefficient alpha should test for the assumption of tau equivalence or report a measure of reliability that does not assume invariant factor loadings. Potentially, a study could be conducted to determine whether measurement parameters are equal across groups reflected in the moderator variables to inspect item performance differences (cf. Vassar & Bradley, 2010).
Conclusion
Our findings provide further evidence of the importance of reporting score reliabilities rather than inducting reliability from other publications. Varying characteristics of the sample population, such as being in North America, can affect score reliability of nearly all subscales of the MSLQ. Similarly, modifying the MSLQ instrument, such as changing the 7-point scale to a 5-point scale or translating the instrument from English into another language, might positively or negatively affect subscale reliability.
When designing a quantitative study, forethought is important to administering tests that will result in reliability coefficients that are sufficient to produce unattenuated effect sizes (Pedhazur, 1997; Thompson, 2003; Yetkiner & Thompson, 2010). Reliability estimates obtained for an instrument will vary between applications if the score variability, sample composition, and administration conditions fluctuate (Crocker & Algina, 1986). Vacha-Haase and Thompson (2011) stated that
random variations in data, including the random variations associated with measurement error, attenuate the relationships among measured variables. Such attenuation occurs because correlation coefficients are sensitive to systematic covariances among measured variables replicated over study participants and not random fluctuations. (p. 159)
However, in certain circumstances, the attenuation of effect sizes due to low score reliability may not always occur (Nimon et al., 2012). Therefore, it is considered good practice to account for sample reliability in studies requiring statistical analysis and interpretation of data generated through the use of an instrument, such as in establishing test norms, assessing individuals and groups, performing validity studies, and evaluating sensitivity of measures. A failure to do so might have negative consequences for study outcomes and for individuals. For example, in clinical settings, use of inaccurate reliability estimates may result in misdiagnosis or underassessment, and in research settings, “insufficient reliability reporting practices influence the interpretation and application of research results and contribute to development and use of faulty measures” (Green, Chen, Helms, & Henze, 2011, p. 660).
Conceptually, reliability estimates the degree to which an individual’s scores remain relatively constant or free from measurement error over repeated administrations of the same test or of alternate forms of a test (Crocker & Algina, 1986; Rudner, 1994). Thus, to make a validity judgment about how well scores from an instrument measure a construct, researchers must consider score reliability. In this way, reliability is considered to be a necessary, but not sufficient condition for the establishment of score validity (Pedhazur & Schmelkin, 1991).
Regardless of the negative implications of poor reliability reporting, it is common for researchers either to fail to report reliability estimates for data collected or to report only previously published reliability coefficients for the instrument, a practice that has been characterized as reliability induction (Vacha-Haase, Kogan, & Thompson, 2000). Such practice likely arises from a misunderstanding that reliability is a property of the scores generated by administration of a test to a particular sample under specific conditions, rather than a property of the instrument itself (Thompson & Vacha-Haase, 2000).
To encourage better practice in reliability reporting, journal editors (e.g., Thompson, 1994) and professional organizations (e.g., American Educational Research Association, 2006; APA, 2001; Wilkinson & APA Task Force on Statistical Inference, 1999) have consistently advocated that authors provide reliability estimates for the data in hand because “it is poor practice and potentially harmful to tested subgroups for researchers to assume that reliability evidence obtained with one sample (e.g., adult men) can generalize to other samples and/or populations (e.g., women, children, adolescents)” (Green et al., 2011, p. 658). Despite these efforts, reliability reporting practices appreciably have not improved over the past three decades (Green et al., 2011; Hogan, Benjamin, & Brezinski, 2000; Vacha-Haase & Thompson, 2011), an observation that is supported by findings from the current study.
Future researchers should benefit from the results of the current study as they allow for the estimation of reliability based on anticipated sample characteristics and study designs. In other words, researchers can better anticipate how their study design characteristics will affect the reliability of their results and make informed decisions about whether or not a particular modification (e.g., modification of item wording or use of a Likert-type scale with a different number of choices) is appropriate in light of the potential influence on score reliability. With these data in mind, researchers can make empirically based decisions to strengthen their research, and ultimately, the quality of scientific knowledge obtained using this measurement tool.
Footnotes
Appendix A
Appendix B
Declaration of Conflicting Interests
The author(s) declared no potential conflicts of interest with respect to the research, authorship, and/or publication of this article.
Funding
The author(s) received no financial support for the research, authorship, and/or publication of this article.