
Abstract
This study aimed to investigate the role of information and individual determinants on speed choice in a controlled laboratory setting in order to improve the general understanding of individual speeding behavior. A novel and interactive speed choice experiment was designed where participants repeatedly had to choose between fast or slow driving. Results showed that additional information had an effect on speeding choice if it contains quantitative instead of qualitative information. However, the provided quantitative information led to increased speeding behavior and a higher number of accidents—potentially because it reduces uncertainty about accident risk. This—at the first sight unexpected—finding may be partially explained by different effects of uncertainty and risk. Results further indicate that an increase in the underlying crash risk actually reduces accidents by decreasing the attractiveness of speeding. Across all treatments it was found that individual characteristics help explain differences in speeding behavior significantly.
Introduction
Road accidents cause around 2.4 million injuries in Europe each year which makes them the main cause of death among young adults. Despite improvements in the last decades, speeding remains among the main road safety problems and is undeniably related to accident risks and severity (Aarts & Van Schagen, 2006; Elvik, 2007; Ghasemzadeh & Ahmed, 2019; Laiou et al., 2021; OECD/ITF, 2018; Ramana et al., 2018). More than 80% of drivers in the EU acknowledge that fast driving is often contributing to car accidents (Sartre 3, 2004). At the same time however, it is found that even though people know that fast driving is risky, they often do not acknowledge that they are personally at risk (Deery, 1999; OECD/ITF, 2018; Sartre 3, 2004). This leads to the observation that many drivers both prefer to drive faster than the objective risk would justify and what they themselves would consider to be safe, leading to this vast amount of yearly road traffic accidents (Goldenbeld & Van Schagen, 2007).
A main reason for this observation is that negative speeding outcomes, as for example, on accident risk, fuel consumption, noise pollution or the environment, are mostly evident at an aggregate level. At the level of the individual driver, however, negative outcomes are hardly perceived—perhaps with the exception of increased fuel consumption—and the individual risk of an accident is rather small. Even though accident risk increases when driving fast, it remains comparably small and most individual drivers will not experience severe road accidents in the course of their lives. Thus, while perceived risks are low at the individual level, societal risks, and disadvantages are higher but often not considered by drivers (OECD/ITF, 2018). Contrary to the disadvantages, the advantages of driving fast, as for example (at least subjectively) shorter travel times, joy and excitement of speed, are often experienced immediately at the individual level (OECD/ECMT, 2006). An additional overestimation of benefits from speeding leads people to drive faster than optimal, thereby reducing individual well-being (Tscharaktschiew, 2016). Most governments try to close the gap between individual and social costs of speeding through speed limits or fuel taxes that, however, only influence speeding behavior to a certain extent (Rietveld & Shefer, 1998). Speed limits might even encourage slow drivers to drive faster (Tarko, 2009).
Besides unrealistic optimism and biased beliefs caused by this imbalance between negative aggregated outcomes and positive individual outcomes, there are many other contextual or permanent factors which influence the individual choice of driving speed. The type of the vehicle driven, perceived driving skills, the allowed speed limit, the perceived likelihood of enforcement, congestion as well as road characteristics and weather conditions are typical aspects determining a driver’s speed choice (Delhaye et al., 2015; Maze et al., 2006; Sabir et al., 2011; Shefer & Rietveld, 1997). Psychological factors (especially sensation seeking and risk attitude) and socio-economic factors like educational attainment are also found to influence drivers’ speed choices (see, e.g., Begg & Langley, 2001; Harré et al., 2000; Ivers et al., 2009; Jonah, 1997; Lemarié et al., 2019; Martínez-Gabaldón et al., 2019; McKenna & Horswill, 2006; Richard et al., 2014; Steinbakk et al., 2019; Tao et al., 2017; Zhang et al., 2019). Previous studies have also established undeniable gender and age differences in speeding behavior: the majority of fast drivers are young men (Freeman et al., 2017; Goldberg et al., 2006; Hong et al., 2020; Martínez-Gabaldón et al., 2019; Stephens et al., 2017; Yokoo & Levinson, 2019). Other studies have suggested a relationship between the willingness to take risks and preferences for fast driving (Jonah, 1997; Machin & Sankey, 2008; Zhang et al., 2019), between time perception/pace of life and risky driving (Goldbach et al., 2020; Zimbardo et al., 1997) or between information of speed and its impact on speed choice (Navon & Kasten, 2015; Peer & Gamliel, 2013). Speed choices will be additionally affected by the purpose of the travel or the company in the vehicle (Fleiter et al., 2012). Among the many determinants are also the perception of how other drivers behave and how speeding relates to accidents.
As individual drivers often lack awareness of the negative consequences of speeding, information regarding travel times, accident risks, or alternative routes is generally considered to help travelers to make better travel choices (Navon & Kasten, 2015; Peer & Gamliel, 2013). Without additional information, travelers’ choices are mainly based on knowledge gained from their past experiences, hence limited (Ben-Elia et al., 2012). It is therefore not only important to understand the determinants of speeding behavior but also the effect of additional information.
Most studies that focus on people’s speeding behavior either use official speed measurements in traffic or have to rely on self-reports. However, “both types of studies have disadvantages: self-reported data is restricted to individual perception and might suffer from social-desirability biases or recall biases (see, e.g., Boissin et al., 2019). Speed data obtained in actual traffic, on the other hand, usually leads to only one observation per driver and limited additional information (see, e.g., Jorgensen & Polak, 1993). Hence, both methods are limited to take individual variability into account and link it to the individual pace of life measures. To overcome this difficulty, laboratory experimental approaches, in which real persons are involved in a simulated repeated traffic situation, are conducted. These kinds of experiments have generally provided a basis that serves as a bridge between theoretical development on the one side and full-scale field studies on the other.” (Goldbach et al., 2020, p. 4)
Therefore, the present study also accounts for these limitations by exploring individual speeding behavior and the impact of different information in a controlled laboratory setting. Hence, we designed an innovative speed choice game in which players were confronted with the decision between fast or slow driving. Similar economic games that explore rather abstract situations and that were conducted in controlled laboratory settings have already been used for other traffic related questions, especially route choice (Goldbach et al., 2019; Chmura & Pitz, 2006; González Ramírez et al., 2021; Hartman, 2012; Helbing et al., 2005; Selten et al., 2007). Elvik (2014) further demonstrated that game theoretical models help to explain interactive road user behavior in many different situations. He argued that speed choices can be theoretically analyzed in a simple 2 × 2 coordination game as there is no doubt that the own chosen speed depends for some extent on the speed choices of others. We wanted to go one step further and extended this existing idea of using a game theoretical approach to analyze interactive speed choices. Therefore, we designed this n-person game that was not only analyzed game theoretically but was actually played with 192 university students. Instead of aiming for a full explanation of speed choices, we use this novel setup to particularly test whether an increase in accident risk effects the occurrence of accidents and how feedback information on the aggregate outcome (which—as argued previously—is often less noticeable) effects individual speed decisions independent from site specific characteristics. We therefore particularly tested two main hypotheses:
Hypothesis 1: An increased and unknown accident risk negatively effects the number of people choosing fast and therefore reduces the occurrence of accidents.
Hypothesis 2: Feedback information on the aggregate outcome effects individual decisions independent from site specific characteristics and reduces the occurrence of accidents.
In the following sections we will explain the methodology and describe the experimental process before we analyze the obtained data both on aggregate and individual levels. Ultimately, we present our conclusions and policy recommendations.
Methodology
In the last decades, economic games have increasingly become a useful tool to investigate human behavior in ways that observational and survey data cannot (Pisor et al., 2020). Therefore, we built upon existing route choice games (as, e.g., the seminal work of Selten et al., 2007) and designed a new speed choice game that can help to draw inferences about speeding in the real world. Its experimental design reflects relevant features of speeding (e.g., that speeding comes with the risk to crash and that risks increase for all traffic participants with the number of speeding vehicles) but minimizes real-world constraints (e.g. (reputational) consequences of admitting to speed in interviews or lack of individual information in real-world observations). We have already successfully used the basic setup of the experiment to investigate the impact of an individual’s pace of life on speeding. We found a significant link between someone’s pace of life and their speeding decisions (Goldbach et al., 2020). As this finding indicates that our experimental design actually measures our understanding of speeding, we extended the basic version of our experiment by three treatments. The experimental setup and process is described in detail below.
Participants
For this study, laboratory experiments took place in May and June 2019 at the Rhine-Waal University in Kleve, Germany. A total of 192 Bachelor’s and Master’s students were recruited through the university’s internal database Experimental Research and Training in Social and Economic Sciences (XPERTISE). Students from all faculties had the chance to sign up online. By doing so, they provided informed consent. Participants were between 18 and 44 years old. About 58% of them identified as male, the rest as female. The participants had to make the same decision in 100 periods. Therefore, a participant’s total payoff was the sum of all 100 period payoffs. Each experimental currency unit (ECU) was worth 0.07€. Altogether, participants earned 61 ECU (=4.27€) on average in the experiment that took less than 30 minutes. Participants received additional 5€ for answering a survey afterwards. The data set is available online at https://data.mendeley.com/datasets/htwskf2vxd/1.
Experimental Design
Participants were randomly assigned to groups of eight and instructed to make a choice between traveling either fast or slow in order to reach their destination in B (see Figure 1). The fact that participants interact randomly with other participants reflects the situation of drivers on public streets.
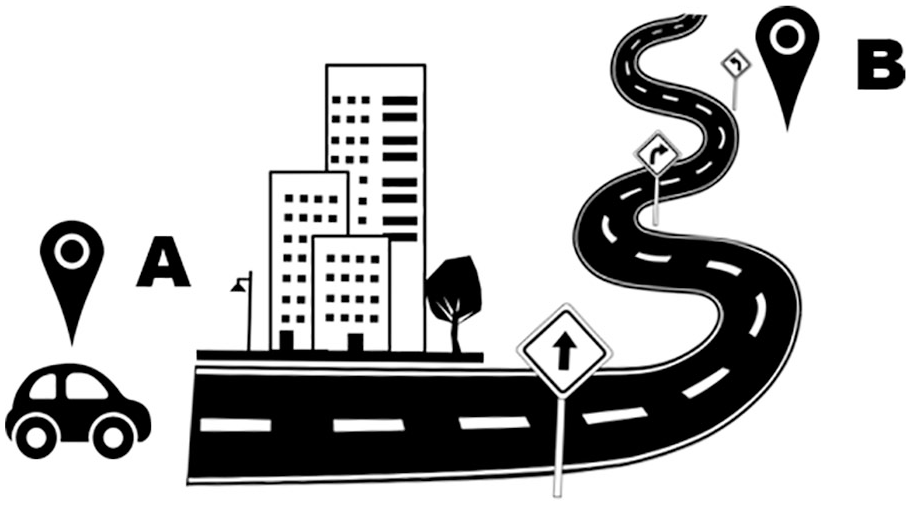
Experimental setup (picture not shown to participants).
“The participants’ payoff depends on the time needed to arrive in B. If they arrive in B after choosing slow, they received 1 ECU. If participants arrive in B after choosing fast, they receive a higher payoff of 2 ECU. However, every participant faces the risk of having an accident that resulted in not arriving in B and therefore having a payoff of 0 ECU” (Goldbach et al., 2020, p. 5ff). The underlying probability to arrive for fast and slow is, respectively:


where x is the number of players that chose fast, n the size of the group, f the payoff of fast, s the payoff of slow, and m a factor influencing the accident risk when speeding. In our experiment s equals 1 (ECU), f equals 2 (ECU), n equals 8 (players), and in the baseline m is set to 2,333. The formulas emphasize that with a higher number of fast players (x), both probabilities to arrive decrease. The experiment is thus designed in a way which emphasizes the fact that choosing fast does not only decrease the participant’s likelihood to arrive at B, but also the likelihood of everyone else. The formulas also show that for any given x, the probability to arrive is higher for slow drivers than for fast.
As speeding drivers in real life not only endanger themselves but also other road users, participants were informed that the chance to be involved in an accident increased for all players with the number of players that chose fast, but was always higher when choosing fast than when choosing slow. Instructions, including screenshots of the actual experiment, can be found in Appendix B and C. As speed choices are usually frequently repeated, this game was played over 100 rounds.
In such a setting the social optimum would be reached when everyone chooses slow. In the baseline condition we chose parameter m in a way that the equilibrium between the expected payoff fast and the expected payoff slow is at x = 6 (see Figure 2a).

(a) Graphical representation of baseline condition with moderate accident risk and (b) graphical representation of treatment I with high accident risk.
We compare this baseline condition with three variations: In the first variation, treatment I, we increase the underlying likelihood of having an accident in order to test the sensitivity to the accident risk in our experimental setting. This was done by changing parameter m: While m = 2.333 in the baseline treatment, m = 5 in treatment I. As this manipulation reduces the equilibrium to x = 2, we expect that this increase in accident risks will reduce the number of fast driving individuals. Figure 2b illustrates this treatment and the inherently lower probabilities to arrive. It still holds true that only if no participant is opting for fast, everyone will be guaranteed to arrive and the optimal group payoff is realized.
Two more variations, treatment II and treatment III, use the baseline condition’s accident risk but focus on the effect of additional information, as information is supposed to help travelers to make better travel choices. This information will be given at the aggregated level as the aggregated level is often less noticeable for drivers. In treatment II quantitative information will be provided and participants will be informed about the total number of accidents after each round. In treatment III we vary the information slightly and only present a qualitative measure of how many accidents occurred. If more than two players experienced an accident, every participant received the information that “there were many accidents in the previous round”. If there were fewer than three accidents, participants were informed about “few accidents” in the previous round. Table 1 provides on overview of the treatments and their differences. All four conditions consisted of six groups of eight players.
Overview of Treatments and Their Differences to the Baseline.

Procedure
Participants were invited to the university’s computer laboratory. Three groups were scheduled to play at the same time. Once all participants showed up, they were directed to a cabin with a PC, type in their individual and anonymous participation link, and start the experiment which was programed using Otree. The program randomly grouped players into groups of eight in order to ensure random and anonymous interaction between players which reflects the situation of drivers on public streets. After they read the instructions and potentially upcoming questions were answered, they started with the first round of choosing either fast or slow. No pictures were shown. A screenshot of the experimental website can be found in Appendix C. Just when everyone of their group made a decision, participants proceeded to the feedback page and were informed about the outcome of their and their groups’ decisions (and other factors; see Appendix B and Table 1 for detailed information). Afterward, they proceeded with the second round. After completing 100 rounds of decisions, they were redirected to a questionnaire and asked to answer some individual questions. Once they were done, they could go to the laboratory’s reception, were identified by their participation link and received their individual payment. Altogether, sessions took around 45 minutes.
Explanatory Factors
Experimental factors like the behavior of the group, the treatment or the occurrence of an accident in the preceding period are anticipated to impact directly on the individual speed decision and are therefore considered in the following analysis. Since the inclusion of individual differences and personality factors is again on the rise, a consecutive questionnaire was conducted to account for certain differences between individual drivers.
The consecutive questionnaire collected information on age, gender, ownership of a driver’s license, basic risk aversion, and time preference (e.g., see Table A1 for definitions and summary statistics of used variables). Additionally, the Big Five personality factors were captured, as the Big Five model is based on the factors Conscientiousness, Openness Agreeableness, Neuroticism, and Extraversion and as these five factors have proven to “capture the essence of one’s personality” (McElroy et al., 2007, p. 810). Thus, we exploratively included IPIP NEO inventory, which is available in the “International Personality Item Pool” (IPIP) and consists of 20 items per personality factor (Goldberg, 1999; Goldberg et al., 2006), to test whether it can help to explain differences in speed decisions. For better representation we normalized the Big Five factors in a way that 1 is the highest and 0 the lowest score.
Experimental Results
Figure 3 illustrates that the groups of eight rarely experienced a round in which no player chose fast or in which no accident occurred. On average 3.8 out of 8 players chose the riskier fast option, resulting in a total of 4.3 accidents per round. Across all treatments players choosing slow experienced an accident in 39% of cases, players choosing fast in 69% of cases.
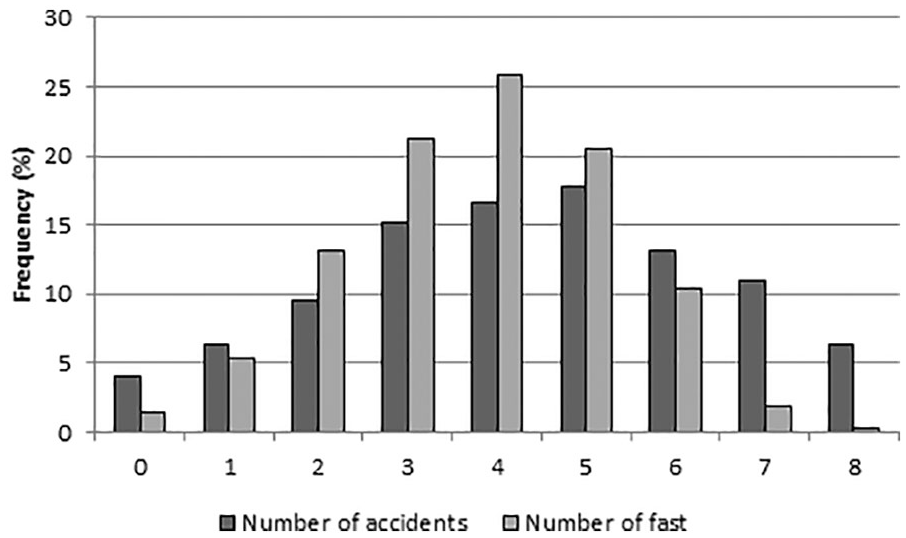
Distribution of number of accidents per round.
These findings, however, differ significantly between treatments. Table 2 shows that on average 4.13 participants chose fast per round in the baseline while this number decreases to 2.38 once the crash probability was increased in treatment I which confirms our hypothesis and emphasizes that—even though the crash likelihood is never explicitly mentioned to participants—behavior is automatically adjusted to modified underlying conditions. The number of accidents also decreases despite the increased accident likelihood whereas the payoff does not change but fluctuates to a smaller extent.
Comparison of Treatments.

Until now players’ choices were mainly based on knowledge gained from learning of past experiences. Once additional feedback information about the number of total accidents, however, is revealed to the participants after each round, the total number of players choosing fast increases slightly to 4.47 per round in treatment II, leading to more accidents and less experimental payoff. Participants’ choices do not differ much in treatment III from the baseline. A one-way ANOVA was conducted to determine if the observed differences are significantly different for different treatment conditions. And indeed: A statistically significant difference of the number of players choosing fast per round was found between groups (F(3,188) = 2.73, p = .045). A Tukey post-hoc test showed, however, that there were no statistical difference between the baseline condition and treatment III. The same was done for the measure of total accidents (ANOVA (F(3,188) = 21.5, p = 0.00) and for the participants’ total payoff (ANOVA (F(3,188) = 4.8, p = .003; a Tukey post-hoc test revealed no statistical difference between baseline condition and treatment I).
Hence, experimental results confirm the hypothesis that a change in the implicit accident risk will affect the observed behavior. This finding is not surprising but serves as an indicator that the incentive structure of the experiment translates into expected outcomes. Results from a comparison between the baseline (=moderate risks and no information) and treatment II (=moderate risks and ex-post quantitative information), however, show unexpected results. Additional information does not reduce the occurrence of accidents in the experiment and does not push groups closer to the social optimum. While we have no qualitative data on motivations or reasons of players, we can only assume that the sheer number of accidents has no deterrent effect but might rather illustrate the previously more uncertain accident risk. Figure 4 illustrates the differences in the average number of people choosing fast between the three first conditions.
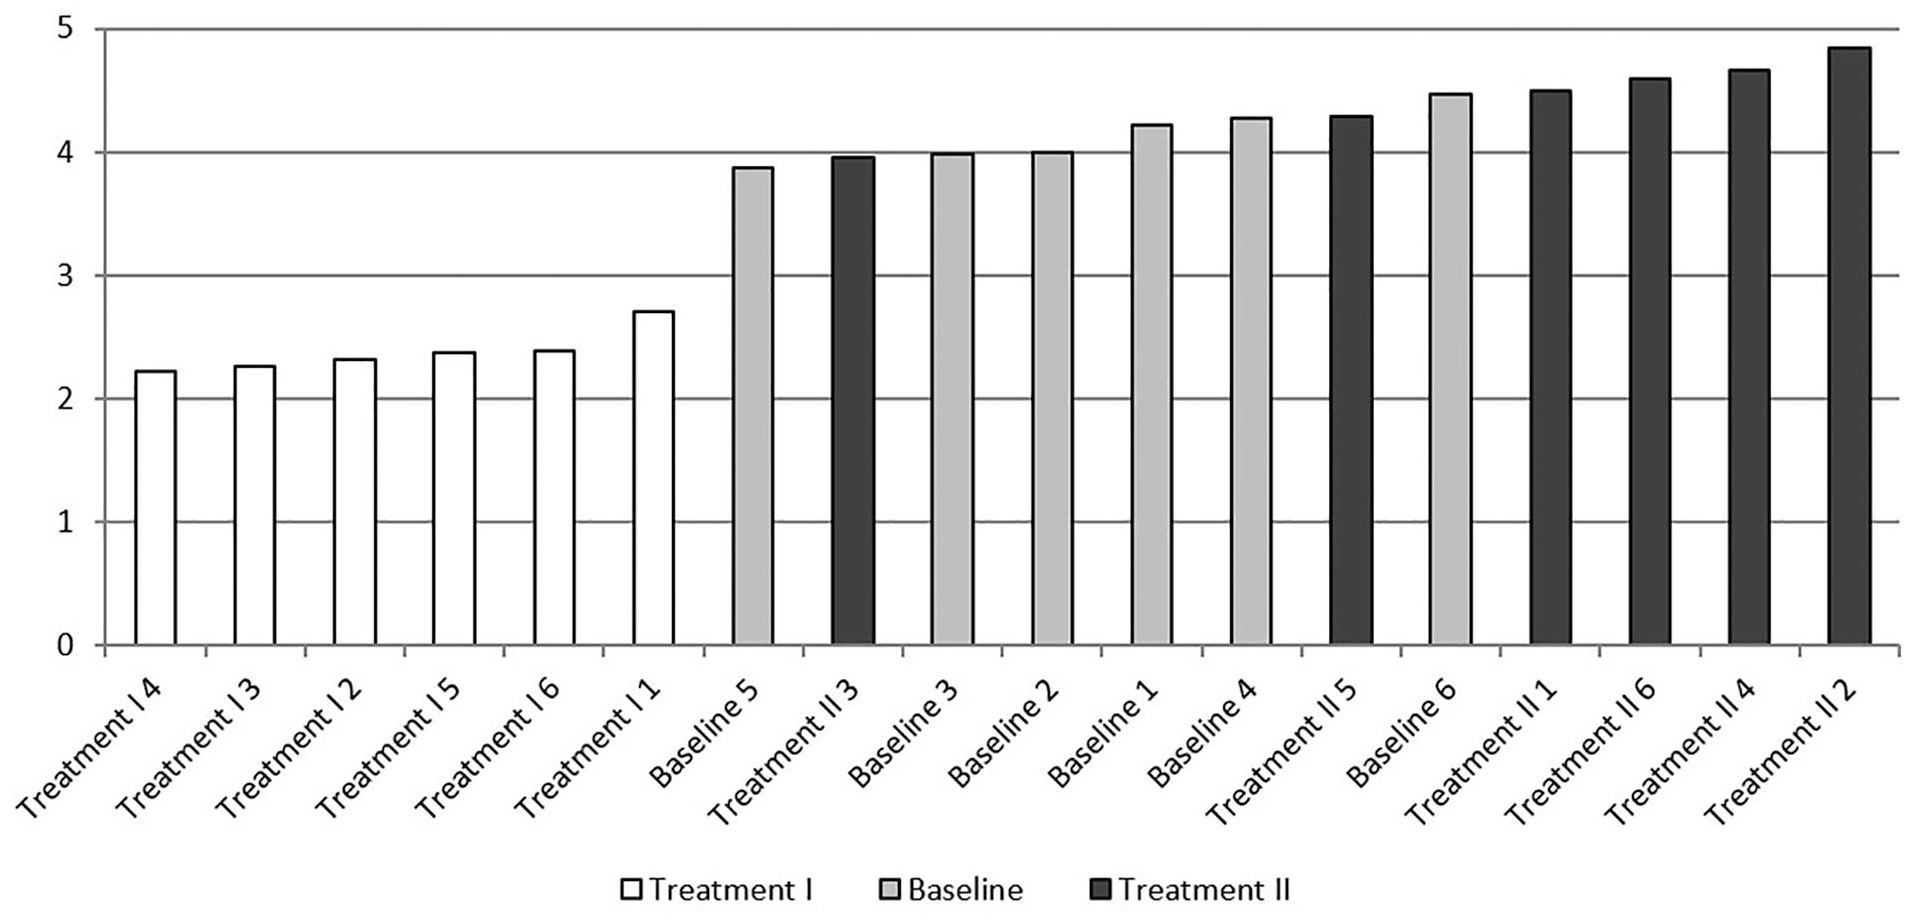
Average number of participants choosing fast per session. Baseline sessions are depicted in gray, sessions from treatment I in white, and sessions from treatment II in black.
Even though we find a small but significant difference between baseline and quantitative information treatment, we do not find a significant difference between baseline and the qualitative information treatment. The rather imprecise qualitative information about accidents does not seem to affect the behavior of participants in the same way as the precise number of accidents. Table 2 further shows that in this experiment, additional information was not found to reduce fluctuations. In order to analyze these descriptive results further, the behavior of individual players will be analyzed through more detailed regressions in the following chapter.
Other Factors and Their Influence on Individual Choices
While the preceding analyses focused on the aggregated behavior in the different rounds of the experiment, the following analysis will focus on individual differences by analyzing two binary variables: the first variable indicates whether the player chose fast in the respective round or not (=1 yes and =0 no), while the second variable indicates whether the participant ends a sequence of either fast or slow (=1 participant ends a sequence of either fast or slow and switches to the opposite strategy and =0 does not switch). We use logistic panel regressions in order to investigate the effect of several independent variables on the two binary dependent variables (see Table 3).
Regression Results on Individual Level.
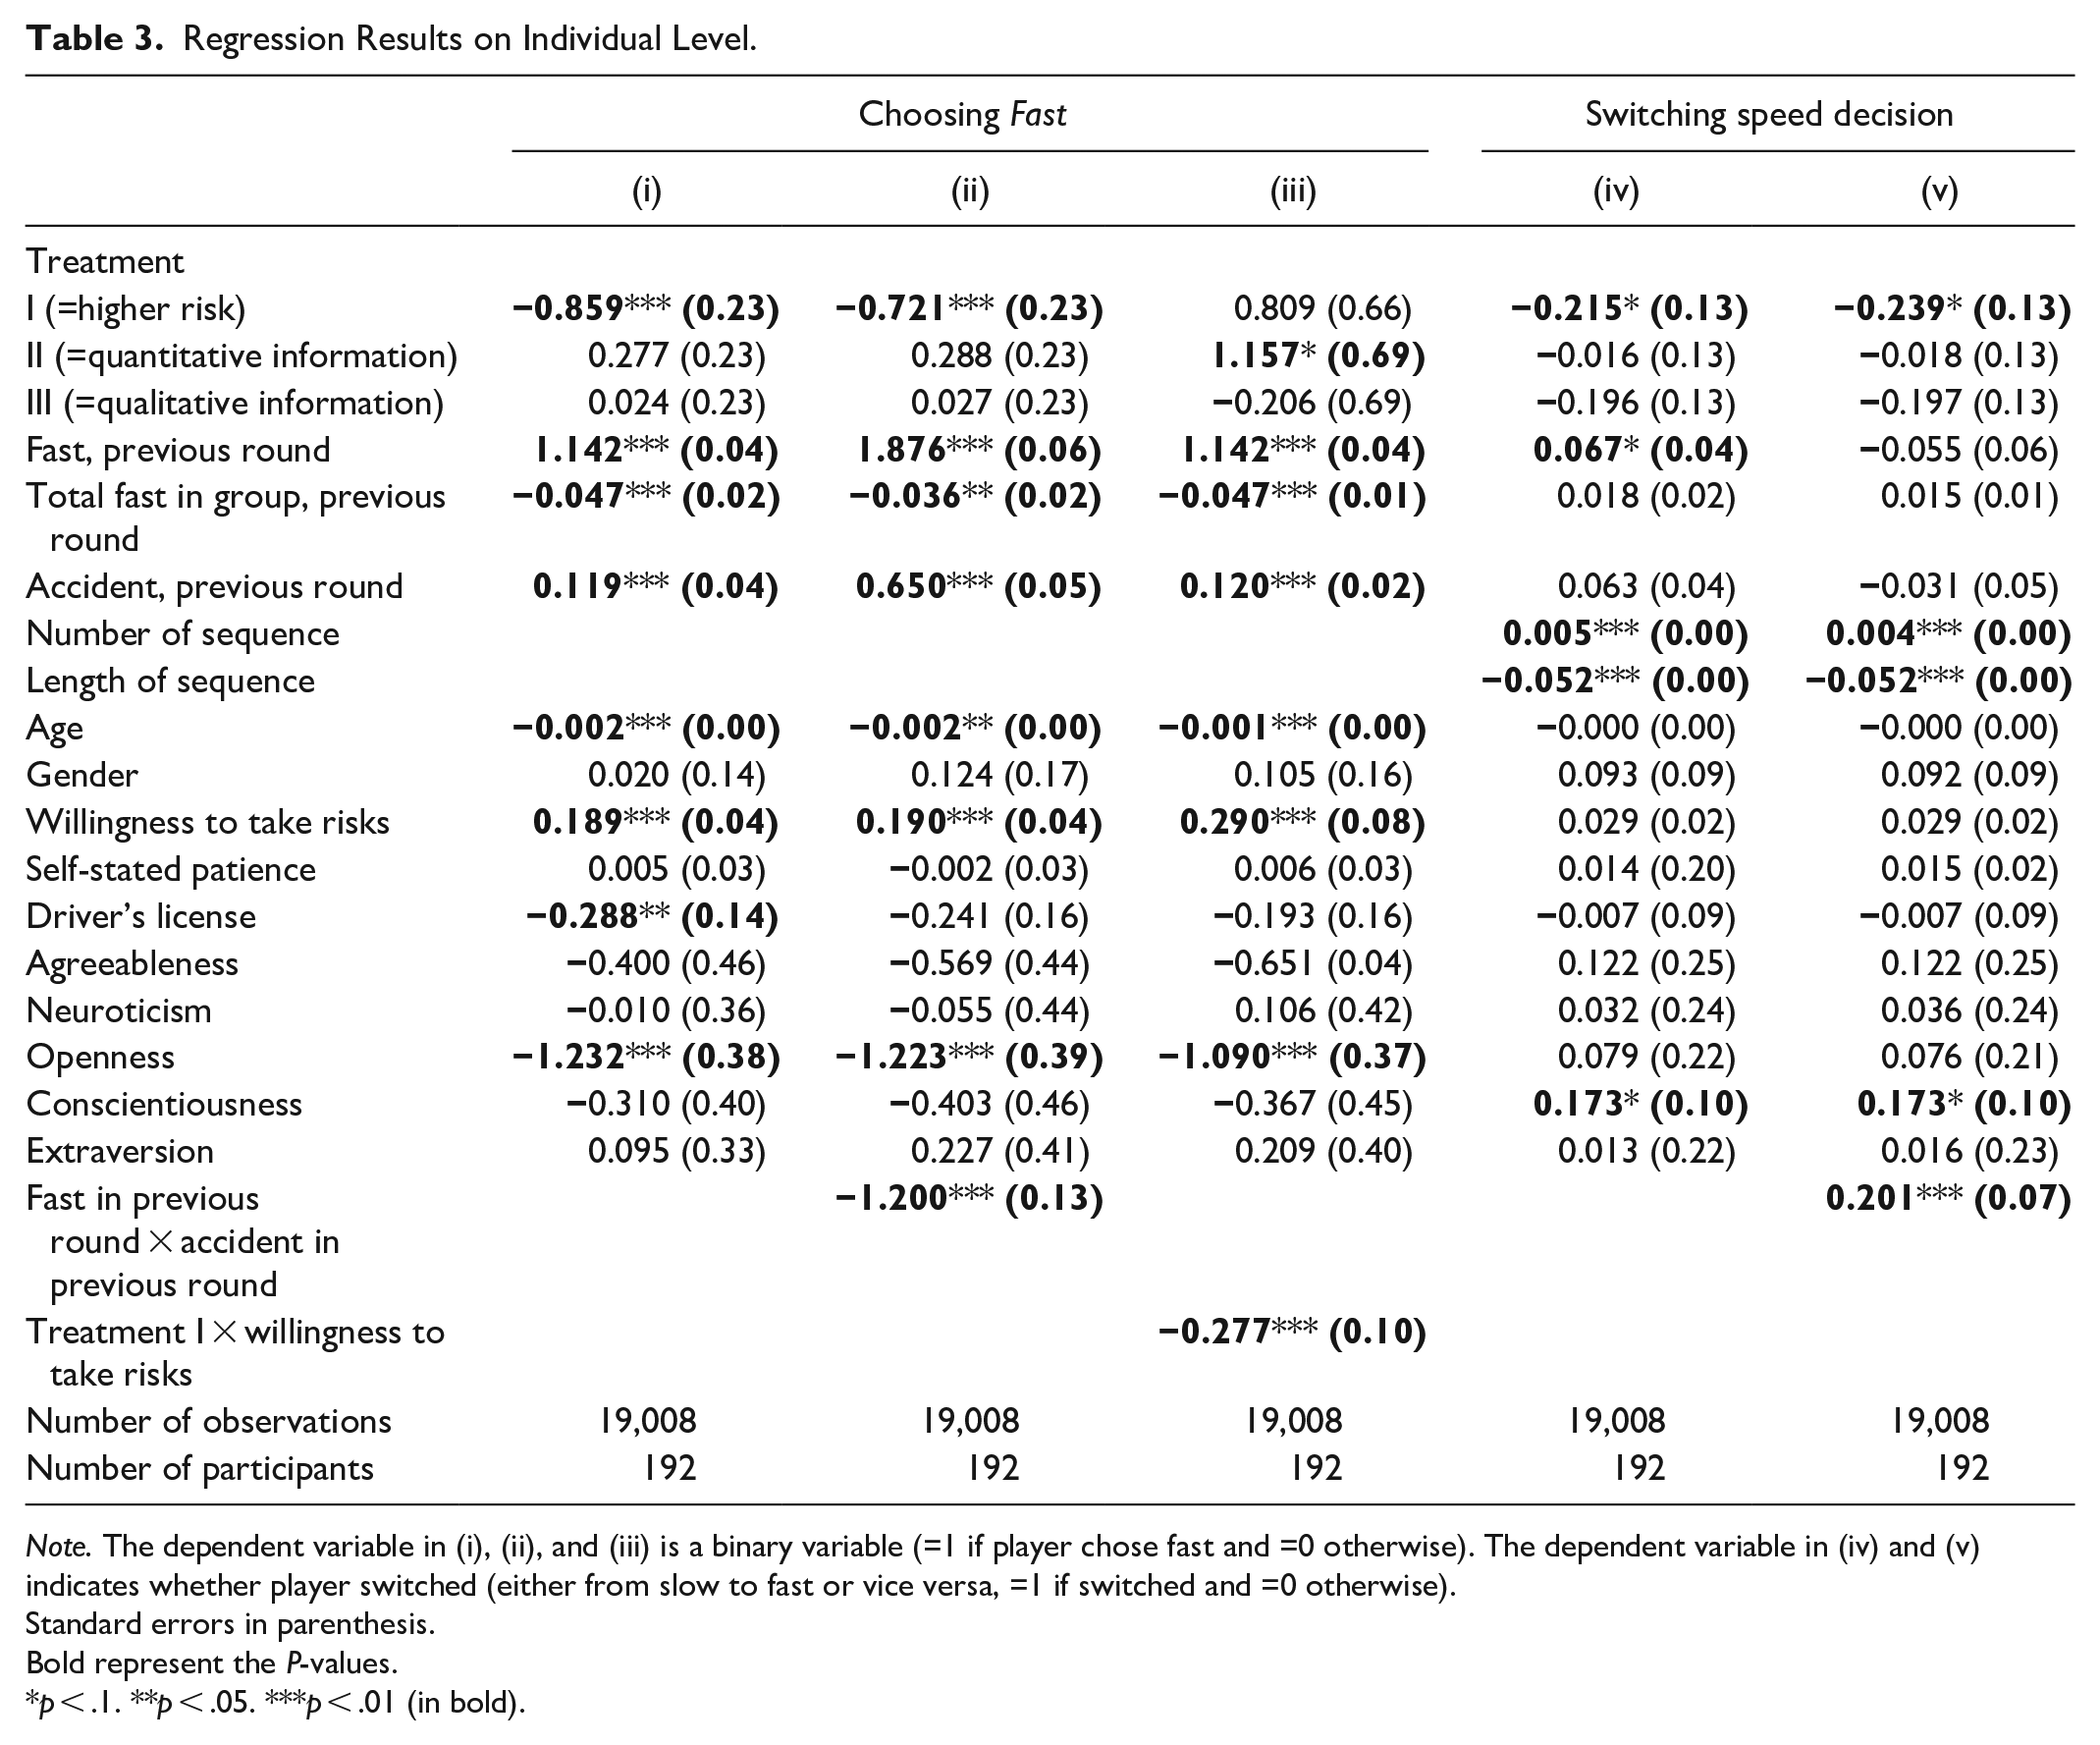
Note. The dependent variable in (i), (ii), and (iii) is a binary variable (=1 if player chose fast and =0 otherwise). The dependent variable in (iv) and (v) indicates whether player switched (either from slow to fast or vice versa, =1 if switched and =0 otherwise).
Standard errors in parenthesis.
Bold represent the P-values.
p < .1. **p < .05. ***p < .01 (in bold).
Results of model (i) confirm that participants chose fast significantly less often in treatment I than in the baseline. They also reveal strong commitment: if players chose fast in the previous round, they are likely to choose it again. As expected this likelihood decreases significantly with the total number of players who speed. A previous accident, however, rather surprisingly increases the probability of choosing fast—even though this choice increases the individual accident risk. Also several individual factors were found to impact significantly on the likelihood to speed: As expected the likelihood decreases with age but increases with the self-reported willingness to take risks. Interestingly, having a driver’s license does also reduce the likelihood to go for the fast option. The Big Five on the other hand, despite scoring very well on internal consistency, do not turn out to be very powerful predictors: only players scoring high on openness to experience choose fast significantly less often.
As especially the positive impact of a previously experienced accident does not meet our expectations, we check for moderating factors and find a highly significant interaction (see model (ii)): If players decided to speed and consequently experienced an accident, they are less likely to choose fast again in the consecutive period. The positive impact of accidents on speeding behavior is therefore only found for slow driving players who might be disappointed to have experienced an accident despite their decision for the relatively safer option. In this case choosing slow turned out to benefit the whole group but not to pay out for the participant himself.
Another interaction shows that the impact of risk attitudes, which are consistently among the main determinants of speeding behavior in the literature, depends on the treatment and differs significantly between the baseline and treatment I (see model (iii) and Figure 5). It is found that the individual willingness to take risks has a significantly stronger impact on the decision to speed if the external accident risk is rather low (baseline) compared to when the external risk increases (treatment I).

Interaction effect: probability to choose fast by willingness to take risks and treatment.
In model (iv) and (v) we further investigate the factors that influence a participant’s decision to switch from slow to fast or vice versa. Results show that the likelihood to switch is smaller in treatment I, but higher after the player chose fast. Model (v) further reveals that the likelihood to switch is especially high after a player chose fast and experienced an accident which meets common expectations. Two highly significant and mentionable variables explaining the switching behavior across models are the number of the sequence of consecutive equal decisions and the length of that sequence: The higher the number of the sequence, and thus the more often a player has already switched before, the higher the likelihood to switch again. The length of a sequence of equal decisions, which acts as an indicator for how long a player sticks already to his decision, on the other hand, has a negative effect. Few individual characteristics like gender, willingness to take risks and conscientiousness, which reflects responsible the thorough behavior, are found to have a significant effect. The latter effect was also found in a similar route choice setup (Goldbach et al., 2019), is, however, quite small.
Discussion and Conclusion
The paper specifically aims to solve methodological problems: most studies focusing on speed choice use official speed measurements in traffic or have to rely on self-reports. Both types of data, however, come with disadvantages. Therefore, this study used a newly designed speed choice game to investigate factors that impact on the choice to drive fast and the effect of different feedback information. Among the many factors that influence the driving speed are the perception of how other drivers behave and how fast driving relates to accidents. Therefore, this experiment specifically tests the effect of the behavior of other drivers as well as the impact of information about accidents. Results show that behavior differs significantly between treatments. An increase in the accident risk leads to a reduced number of fast-choosing players. As a result, the increased accident risk leads to fewer accidents. This finding falls in line with the offsetting hypothesis which predicts that agents adapt to increased safety by behaving less carefully, or vice versa (Abay et al., 2013; Peltzman, 1975; Winston et al., 2006). The decreased road safety in the experimental setup was compensated by an increased willingness to choose the safer slow-option, ultimately leading to an overcompensation of the increased crash risk and a significantly lower number of accidents. A further difference between treatments can be found when additional ex-post information about the number of accidents in the previous period is provided. It has to be noted that the effect is only apparent when participants received information about the precise number of accidents, but not when they receive more qualitative information about aggregated road safety. The mere information of occurrences of accidents does not seem to be sufficient to change behavior, whereas a precise number is found to be taken into account.
Another interesting finding is that this additional quantitative information actually leads to an increased likelihood to speed and subsequently to more accidents and less payoff. This—at the first sight unexpected—finding may be partially explained by different effects of uncertainty and risk. In the baseline the probability to experience an accident is unknown to the participant and the likelihood to arrive at B is therefore uncertain, especially when choosing the fast option. In the information treatment, however, participants receive concrete numbers of accidents which reduce the inherent uncertainty and replace it with more objective likelihoods. The behavioral economic literature shows that individuals tend to prefer risky over uncertain choices (a preference known as ambiguity aversion (Ellsberg, 1961). Once participants obtained more precise information, underlying probabilities became more obvious, making the risky fast-decision more attractive than the uncertain fast-decision in the baseline. However, this ambiguity aversion is expected to be relatively small, as accident probabilities still rely in all treatments on uncertain choices of the other group members. This finding might also be explained with the previously mentioned offsetting hypothesis: the additional objective information might make the driver feel more able to control and judge a situation and therefore safer. Drivers might respond by behaving less carefully
Further analyses on the individual decisions to speed in the experiment show that the likelihood to do so does not only depend on the treatments but also on other factors like the group’s and the individual’s past behavior. While the speeding behavior of others impacts negatively on future decisions between slow and fast, own speeding history is positively linked to the decision. This finding leads to the recommendation to have strict penalties for speeding as someone who speeds is likely to do it again if circumstances stay unchanged. The likelihood to choose fast again, however, was significantly reduced if the participant experienced an accident. This does obviously not mean that accidents should be seen as an instrument to prevent speeding. However, it could be helpful to make drivers better aware of the individual risks and costs of speeding. By increasing their (perceived) risk of speeding, it is highly likely to reduce speeding behavior. Another main determinant is the individual’s willingness to take risks which is found to substantially increase the likelihood to speed—especially when the underlying accident risk is comparably low. Once the accident risk is increased, the effect of individual attitude toward risk is overwhelmed and diminishes. Ultimately, this research contributes to the literature on speed choices that do not only affect the driver but also other traffic participants by drawing on a novel laboratory experiment in combination with an individual personality questionnaire. The findings lead to an improved understanding of repeated individual speed choices and of the role that information plays. The novel experimental setup can also be easily used for the investigation of other aspects of speeding and therefore improve future research methodologically.
Despite methodological advantages, this methodological setup has some limitations that will help to identify potential future extensions. Firstly, accidents are only experienced on an abstract level without any severe consequences and without consequences that last longer than one period. Accidents also occur much more often than in real life and are therefore most likely perceived differently. Furthermore, fast-driving participants have more benefits than slow-driving participants (in form of a higher payoff) but still face the same negative consequences in case of an accident (in form of no payoff) even though slow driving participants do not increase the accident risk. On the one hand, future research should thus incorporate differently framed speeding risks. On the other hand, the incentive structure could be changed in a way that leads not only to stronger consequences in case of a crash but also to consequences that differ between participants that speed and participants that chose slow. Secondly, as in many other experiments, this subject pool only consists of university students that systematically differ from the general population. Even though we assume that this plays a minor role in a repeatedly played game like this, it would be interesting to see how different groups of population react to additional information. Thirdly, even though speed is only experienced in a very way, we cannot account for the different individual perceptions of speed. Fourthly, an extended setup could gather dynamic information on perceptions and motivations of participants during the game in order to establish a better understanding of differences in individual behavior.
Footnotes
Appendix A
Definition and Summary Statistics of Used Variables.

| Variable | Definition | Minimum | Maximum | M | SD |
|---|---|---|---|---|---|
| Fast | =1 if participant chose fast and =0 otherwise | 0 | 1 | 0.47 | 0.50 |
| Total fast in group | Total number of people in group where fast = 1 | 0 | 8 | 3.79 | 1.50 |
| Accident | =1 if participant did not arrive in B and =0 otherwise | 0 | 1 | 0.54 | 0.50 |
| Number of sequence | Number of sequence of same decisions | 1 | 73 | 15.05 | 12.29 |
| Length of sequence | Length of sequence of same decisions | 1 | 100 | 9.82 | 16.73 |
| Switching speed decision | =1 if participant ends sequence and switches from slow to fast or vice versa | 0 | 1 | 0.28 | 0.45 |
| Age | Age of participant in years | 18 | 44 | 24.47 | 4.06 |
| Gender | =1 if male and =0 otherwise | 0 | 1 | 0.58 | 0.49 |
| Risk | Are you generally a person who is willing to take risks or do you try to avoid taking risks? Please choose a value on the scale. The value 0 means not at all willing to take risks and the value 10 means very willing to take risks. | 0 | 10 | 6.09 | 2.20 |
| Patience | Are you generally an impatient person or someone who always shows great patience? Please choose a value on the scale. The value 0 means very impatient and the value 10 means very patient. | 0 | 10 | 5.80 | 2.57 |
| Openness | 20 items per personality factor. Items were measured on a 5-point Likert scale ranging from 1 to 5. Individual item scores summed up to respective personality factor and normalized for representation purposes. | 0 | 1 | 0.47 | 0.23 |
| Conscientiousness | 0 | 1 | 0.56 | 0.19 | |
| Extraversion | 0 | 1 | 0.53 | 0.21 | |
| Agreeableness | 0 | 1 | 0.59 | 0.21 | |
| Neuroticism | 0 | 1 | 0.48 | 0.22 |
Appendix B
Appendix C
Screenshot that displays the output for a player after the first round of the baseline treatment. In this example, the player has chosen fast in the first round, has reached the destination without accident, has therefore earned 2 experimental units and has to choose again between slow and fast for round 2 (Figure C1).
Acknowledgements
We are grateful for the support of the Rhine-Waal University of Applied Sciences [Seed Fund Forschung 40 1002 G]. We would also like to thank all the participants for playing the speed choice game and the participants of the conference “Verkehrsökonomik und -politik” (Transport Economics and -Policy) in Berlin for valuable comments.
Author Contributions
The authors confirm contribution of the paper as follows: study conception and design: T. Pitz, J. Sickmann, C. Goldbach, and D. Kayar; data collection: C. Goldbach and D. Kayar; analysis and interpretation of results: C. Goldbach, T. Pitz, and D. Kayar; draft manuscript preparation: C. Goldbach, T. Pitz, and J. Sickmann. All authors reviewed the results and approved the final version of the manuscript.
Declaration of Conflicting Interests
The author(s) declared no potential conflicts of interest with respect to the research, authorship, and/or publication of this article.
Funding
The author(s) disclosed receipt of the following financial support for the research, authorship, and/or publication of this article: This was supported by the Rhine-Waal University of Applied Sciences [Seed Fund Forschung 40 1002 G].