
Abstract
Many cities in developing countries are facing challenges of providing quality public transport facilities to the public. The demand-responsive transport (DRT) initiatives in some cities have helped in providing transportation alternatives to the travelers, and in filling the gap between demand and supply. Recently introduced DRT initiatives in Lahore included the mobile app-based Airlift and Swvl bus services. This article is aimed at evaluating the travelers’ attitudes toward mobile application (app)–based DRT services in Lahore with the help of a questionnaire survey. A questionnaire was designed consisting of travelers’ personal and travel information and their perceptions on selected attributes of Airlift and Swvl bus services. A total of 440 samples were collected through interviews. An exploratory factor analysis (EFA) revealed three factors of service quality, that is, Accessibility and Scheduling Attributes (ASA), Instrumental Attributes (IA), and Service Attraction Attributes (SAA). The results of Structural Equation Modeling (SEM) showed that the ASA, IA, and SAA are significant determinants of travelers’ attitudes toward the existence of Airlift and Swvl bus services in Lahore. These factors have strong correlations with travelers’ intentions to use Airlift and Swvl services in the future. The waiting time at a stop, travelers’ income, vehicle ownership, trip purpose, and profession are also significant in determining the travelers’ attitudes and preferences with app-based public transport services. These findings would be helpful for the service providers and transport planners for making appropriate policies to improve the quality of these services.
Keywords
Introduction
Since 1970, demand-responsive transport (DRT) has been considered a viable transport solution in situations where traditional public transport services are not sufficient or private taxi sharing is not economical (Chan & Shaheen, 2012). The new developments in technology, coupled with budgetary cuts allocation to public transport have urged the local start-ups and provided them with an opportunity to promote integrated transport based on demand responsiveness. This has pushed the DRT concept forward in terms of money-saving from taxi services, and personalized vehicular movements while striving to provide better accessibility (Davison et al., 2014). The main criteria for public transport to be considered as a DRT service must fulfill some of the basic requirements. If the public transport has (a) the riding facility which can be availed by the general public and it is not restricted to some specific group of passengers based on their demographic features or place of work, (b) the transit operations are carried out by low capacity vehicles (i.e., small buses, minivans, vans), (c) the service provider adjusts the timetable, frequency, and route as per passenger ridership demands, and (d) fares are collected based on the number of passengers and not based on per vehicle, then the service provided can be categorized as DRT public transport service.
The provision of such public transport in the developing nations can be looked upon as a viable solution for easy mobility of the masses where traditional public transport suffers from institutional and/or land-use factors to meet the needs of the mobility demands (Cervero, 1983; Cervero & Golub, 2007). The DRT has been considered as an alternative feasible solution for transport problems but most of the time a range of factors including the technological, social, economic, market, and institutional barriers have hindered the widespread adoption of DRT (Kassa, 2014). The innovation and technological improvements in the DRT have enabled the routing and scheduling of the services through software technology based on the demand variation and responsiveness. The widespread use of smart mobile phones and internet accessibility has potentially increased the scope and accessibility of the DRT in many efficient and effective ways than ever before.
Many of the most popular application-based (app-based) transportation services in the United States, Europe, and China are UberX, Lyft, Sidecar, Carpool, and DiDi. Meanwhile, in Pakistan, the most famous app-based individual ridesharing transport services are provided by Uber, Careem, and Cykiq. Uber and Careem can be used to book individual rides by air-conditioned (AC) cars, non-AC cars, rickshaws, and motorcycles. However, Cykiq is a bicycle sharing mobile application (app) which works on the principle of scanning a QR code using the mobile app and obtaining a four-digit combination code to open the lock. In Pakistan, most of the ridesharing trips are covered by Uber and Careem, which hold the largest part of the commuting trips. As the largest part of the shares of Careem are bought by Uber, so the real sense of competition has deteriorated over the period. The service quality and passenger complaint handling for these services are needed to be improved to gain a competitive advantage over others. This gap in decreased service quality and increased demand for passenger mobility has given rise to the local start-ups of Airlift and Swvl to add to the competitive market of online demand-responsive public transport systems. The assessment of the service quality of an online transport system in m-commerce is very much important to understand the passengers’ behavior, intention, and satisfaction to use a certain service/product (Parasuraman et al., 1994).
It has been argued that the assessment of the service quality provides a better understanding of the competitive environment and advantages in the online m-commerce industry. So, it is extremely important to assess the service quality attributes of the above-named public DRT systems (i.e., Airlift and Swvl). The passengers’ perceptions play a significant role in identifying the important service quality attributes of transit modes that need improvement. The main aims of this research are to examine the travelers’ attitude toward mobile app-based demand-responsive public transport in terms of accessibility and scheduling, instrumental, and service attraction attributes. There is a lack of research in the developing countries on stated dimensions of service quality concerning app-based DRT services. Most of the previous studies have focused only on comfort, travel cost, convenience, performance, and cabin environment attributes of service quality (Dell’Olio et al., 2011; Papanikolaou & Basbas, 2020; Yarmen & Sumaedi, 2016; Yaya et al., 2015). There is not much emphasis on attributes of spatial and temporal coverage, easiness, and convenience in booking rides through an app, driver’s behavior, and attraction and aesthetics attributes of service quality. This study tends to assess the mentioned dimensions of service quality considering the perceptions of the users. It is also essential to identify the potential of newly introduced app-based DRT services as they are affecting the passengers’ perceptions and attitudes concerning public transport facilities. Some policy measures will be proposed for scaling-up the operations of these app-based demand-responsive public transport systems in Lahore city as well as in other developing regions with similar socioeconomic characteristics. Assessment of service quality considering user’s perceptions helps in identifying the potential groups of the travel market while making policy decisions regarding improvements in service quality. In addition, through traveler’s perceptions, it is possible to identify specific attributes of service quality, which operators should focus on while making improvements in service operation and system to enhance the satisfaction of the users and attract potential users.
The rest of the article is divided into the following sections. The section “Literature Review” summarizes the relevant literature, and the section “Research Methods” discusses the research methods. Survey and analysis results have been discussed in the section “Survey and Analysis Results.” Discussion on results is presented in section “Discussion and Implications,” and key findings and their policy implications are summarized in section “Conclusions and Limitations.”
Literature Review
As the world is moving toward sustainable systems of transportation, it has been the priority of transport and urban planners to reduce the use of cars. However, the level of comfort, convenience, and flexibility that personalized transport (i.e., cars) provides as compared with conventional public transport always makes it difficult to attract the attention of the passengers, especially in developing countries which do not have better infrastructure for public transport (Alonso-González et al., 2018). To compete with personalized modes of transport, conventional public transport may opt for new flexible service operations (DRT services) to complement and improve their services in urban areas. The concept of DRT is not quite recent; it was suggested in the 1980s for the future of transport systems in the urban areas (Cervero, 1983). However, recent technological advancements have enabled their real-time large-scale operations (Ryley et al., 2014).
The transport services which can be booked online through the use of mobile phone administrated via app-based systems, also known as DRT services are getting much popularity in m-commerce (Kassa, 2014). In most of these online transport services, individuals can book the ride with the help of a mobile app. The driver and the passenger interact with each other through the app, which is quite convenient for both as they can precisely know each other’s location in addition to the ability of the customer to see the vehicle information. This enables the timely and safe traveling of the passengers to their desired destination. This system of ridesharing is gaining popularity in urban areas because of the higher education ratio, internet access, and smartphones (Mulley et al., 2012). According to Chan and Shaheen (2012), the transport modal share of ridesharing DRT in Canada and the United States is around 8% to 11%, which is likely to increase in the coming years.
Bolton and Drew (1991) developed a longitudinal model to assess the impacts of a service change on customer behavior/attitude about service quality. Brake et al. (2007) identified the key issues for the implementation of DRT systems and proposed some policy measures for the implementation of the DRT in Europe as shown in Figure 1. Cervero (1983) argued on the service quality comparison of the traditional taxis with the online taxicabs and reported that the online transit services are more accountable because of the rating system. A questionnaire-based study is one of the methods/techniques to understand the customers’ attitude toward a service or product. Bolton and Drew (1991) inferred that the impacts of the service changes have a strong influence on the perception and performance evaluation behavior of customers. Joewono and Kubota (2006) proposed that the inclusion of three factors—technology, better management, and institutional reforms through the feedback of stakeholders—can greatly improve the safety and security in public transport. In another study, Cervero and Golub (2007) illustrated various policy measures for the Para-transit-type services and discussed the impacts of increased traffic congestion, accidents, and air pollution on formal transit supply. Brake et al. (2007) explored how DRT can utilize the technology for organized operations, nonetheless, the institutional barriers against their progress are a major block in the United States and other European countries. Joewono and Kubota (2008) explored the user satisfaction of Para-transit services in Indonesia using factor analysis and reported that financial motives dominate the influence of selecting a transit mode. Cantwell et al. (2009) reported that commute satisfaction levels are lower for public transport users who ride in congested services and experience long waiting times.

The demand responsiveness of transport.
A Spanish study by Dell’Olio et al. (2011) concluded that cleanliness, waiting time, and comfort are the underlying factors for the evaluation of the quality of service. A survey study in Israel showed that an automated fare integration system with special discounts from conventional to demand-responsive type of transport can greatly impact the travel behavior and improve DRT ridership (Sharaby & Shiftan, 2012). Another Spanish study used the Structural Equation Modeling (SEM) technique and revealed that three underlying dimensions of the functional, physical environment (cabin environment), and convenience are the most important factors to assess customer’s perceived quality for public transport (Yaya et al., 2015). Yarmen and Sumaedi (2016) utilized explanatory factor analysis and reported that young riders in public transport perceive comfort, performance, and assurance as the main determinants of service quality. An entropy analysis revealed that the three most important aspects pertinent to the quality of online public transport GO-JEK in Indonesia are ease of use, cognitive, and perceived website innovativeness (Silalahi et al., 2017). A study conducted in Phnom Penh Cambodia by Eung and Choocharukul (2018) to identify the underlying factors which can potentially affect the service attributes of conventional public transport revealed that comfort, travel cost, and availability are the main contributing factors for service evaluation of public transport. They argued that a transport operator should focus on the quality of comfort and availability, by keeping fares low to attract more passengers. A study found that the effect of attitude and perception is important for the selection of mode choice and reported that comfort and flexibility are the major factors influencing individuals’ mode choice behaviors (Sarkar & Mallikarjuna, 2018). In a recent study, Papanikolaou and Basbas (2020) compared the performance of DRT with bus services in the interurban areas where demand is low and inferred that the service providers must keep a balanced trade-off between traveling cost and level of service of the transit facilities.
At the moment, with the development of technology, there is an increase in app-based demand-responsive public transport services (such as Airlift and Swvl) in Pakistan. The introduction of these transport services will undermine the ownership and use of private vehicles (Alonso-González et al., 2018). These DRT services also threaten the existence of conventional public transport services because of their improved quality of service (Brake et al., 2007). The recent unprecedented increase in population and private vehicles in Lahore city has also worsened the traffic situation in the country (Javid et al., 2015). Therefore, the rise of these app-based public transport services might contribute to changing the conventional transit behaviors.
Based on the literature mentioned earlier, it is assumed that the introduction of these mobile app-based public transport services might help in fulfilling the travel needs of a specific segment of the travel market. These new modes of travel might be used by the residents of the city for their commuting instead of using private transport if they provide better service quality. However, with the introduction of these online DRT services, it is still not very much clear that what service quality attributes of mobile app-based transit services will affect the travel behavior of commuters. One of the common methods to evaluate the service quality of a transport mode is through questionnaire surveys (De Oña & De Oña, 2015). Therefore, it is extremely important to explore the service quality dimensions of app-based online public transport services about their influence on traveler’s preferences. As these online DRT services are introduced recently, so assessing various underlying aspects pertinent to Accessibility and Scheduling Attributes (ASA), Instrumental Attributes (IA), and Service Attraction Attributes (SAA) will sufficiently contribute to the existing body of the literature especially in the contexts of Pakistan and other developing regions from the perspectives of emerging online DRT public transport services. It is hypothesized that these newly introduced DRT services will attract travelers of different socioeconomic groups who ideally have more familiarity with the operational mechanism of these services. It is also hypothesized that improvements in accessibility characteristics based on user’s perceptions in terms of spatial and temporal coverage might help in attracting new users through influencing their travel attitudes and intentions (Alonso-González et al., 2018; Javid et al., 2015). Based on the findings of this research study, policies about specific service attributes can be made to scale up and improve the operations and usage of these DRT services.
Research Methods
Study Area and Characteristics of Airlift and Swvl Bus Services
This research study was conducted in Lahore city, which is the second-largest city in Pakistan. According to the 2017 census, the population of the city is around 11.13 million people, and the area of the city is around 1,772 km2 (Punjab Bureau of Statistics, 2018). The selection of the Lahore city as a case study is based on its unique cultural and socioeconomic importance. Due to the presence of better educational, medical and infrastructure facilities, and employment opportunities as compared with the surrounding suburban areas, Lahore is considered as a main business and attraction hub in the province. The ever-increasing demand for public transport in the city is also an important consideration. The two selected DRT services in Lahore for evaluation included Airlift and Swvl app-based services. The travelers are supposed to book their ride through a mobile app and use the service at the nearest designated bus stop location of both services. The travelers are required to mention their origin and destination during the booking, and they can reserve a seat as well. The fare structure of Airlift service is based on the distance and routes which range from Rs. 20 to 200. Both services use AC vehicles to provide a comfortable service to the riders. Figure 2 shows the typical picture of the Airlift and Swvl buses. The Airlift bus service has a live tracking feature that always enables riders to track their ride, which makes their rides more reliable. The Airlift service providers have a motive to provide a safe and cost-effective environment for the commuters. The drivers and other crews are well-trained to assure the safety of the riders. The Swvl service providers aim to provide an affordable, quality, convenient, comfortable, and reliable service to the riders. It has fixed bus stops, fixed timings, and fixed prices. Some of the routes of Airlift and Swvl bus services are shown in Figure 2.

Typical pictures of Airlift and Swvl bus service. (A) Airlift bus (Source: Airlift website). (B) Swvl bus (Source: Swvl website).
Questionnaire Design Hypothesis
A questionnaire was designed to comprehend the change in the travel behavior of the respondents subject to the service quality attributes of online DRT services in Lahore. It was designed to understand the respondents’ perceptions about service quality assessment and mode preferences with the introduction of these new services, that is, Airlift and Swvl services. The questionnaire items were designed considering the target group of respondents, that is, those people who have used these services. The first part of the questionnaire included basic socioeconomic features of the respondents such as age, personal income, marital status, profession, education, driving license, car ownership, and motorcycle ownership. The second part of the questionnaire included some questions about the revealed travel behavior of the respondents. Most of these questions were very basic, such as frequency of traveling in a week, the purpose of traveling, and choice of traveling mode considering the safety, convenience, travel time, and travel cost. These specific attributes of service quality were selected to know the travelers’ preferences in the mode choice pattern. Respondents were also asked to report their plan regarding the continued use of online DRT services. The respondents were supposed to record their responses using a scale of yes or no. They were also asked how long they are willing to wait for a ride at designated bus stops if they need to use Airlift and Swvl bus services. It was supposed that the waiting time at bus stops influences the travelers’ mode choice. The respondents were supposed to report their responses considering the following categories, that is, less than 5 min, 5 to 10 min, 11 to 15 min, and more than 15 min. These ranges of waiting times were designed considering the recommendations in the literature and the ability of the local people to wait (Javid et al., 2016; Kaparias et al., 2017; McCord et al., 2006). The last part of the questionnaire included nine statements that were related to some selected service quality attributes of both services. The details of the questions are shown in the subsection “Average Responses and EFA” in Table 2. In this part, the respondents were asked to provide their responses on a 5-point Likert-type scale, that is, 1 = strongly disagree, 2 = disagree, 3 = neutral, 4 = agree, and 5 = strongly agree. The 5-point scales were chosen to get reliable responses for use in the multivariate analysis. The main selected attributes of service quality included accessibility characteristics of the services; convenience in adjusting the travel schedule as per the schedule of the services; information provision from operators related to the schedule, routes, and possible stops; easiness in booking the ride through mobile app; comfort in traveling; physical conditions of the vehicle and its cleanliness; drivers’ skills and behavior; safety and security in travel; and fare collection systems. It was hypothesized that these selected spatial, accessibility, schedule, temporal, system, and service dimensions of service quality may have a significant influence on traveler’s preferences toward the Airlift and Swvl bus services (Davison et al., 2012; Javid et al., 2018; Lau & Chiu, 2003; Nyongesa Murambi & Bwisa, 2014; Redman et al., 2013; Tyrinopoulos & Antoniou, 2008). The other motives in the design of these statements included the local travel market trends and characteristics of public transport facilities (Javid et al., 2016, 2018). The respondents were supposed to report their responses by comparing the selected attributes with other available public transport services in Lahore city.
Sample Size and Sampling Strategy
The respondents of this research study are the residents of Lahore city, who have used these app-based public transport services. The survey locations were chosen based on the stop locations of these services. As in the urban areas, mobility is quite important as it drives the need for demand-responsive public transport (Finn, 2012). The main route networks on which these online public transport services operate were considered as effective locations where appropriate responses can be collected. The real-time stop locations of the respondents were recorded using the latest Global Positioning System (GPS) devices. A convenience-based random sampling strategy was used in the selection of respondents in the target population. The target respondents were interviewed either at the bus stops or on the bus while traveling as per the convenience of the travelers. The required sample size was decided considering the feasibility of conducting the survey and requirements of sample size for use in the SEM. There are many recommendations regarding requirements of sample size for SEM analysis such as (a) a minimum sample size of 200 is required to reduce the biases in the data (Boomsma & Hoogland, 2001; Kline, 2005) and (b) minimum sample size is required to satisfy a ratio of 10 observations per indicator (Schreiber et al., 2006). It was hypothesized that a sample size of more than 400 is appropriate to get reliable results and use in the SEM analysis. The survey was conducted with the help of the students from the University of Engineering and Technology, Lahore. The students were instructed about the contents and objectives of the survey. The surveyors targeted two types of respondents: individuals who were traveling in these services and individuals who were waiting for these services at the stop locations. The data were collected between November and December 2019. A total of 440 samples were collected from respondents, out of which 392 (89.09%) were collected at the bus stop locations and 48 (10.9%) of them using online web-based service of data collection. The frequency of the surveys collected on bus stop locations was determined based on the number of people using the facility at a particular stop location. The details about the route network and stop locations are shown in Figure 3. As it is evident from Figure 3, these services are overlapping with each other at some bus stop locations. Therefore, based on the demand of these services, the responses were collected from positions where these services overlap with each other.

Survey locations and route network of app-based demand-responsive transport services.
Data Analysis Methods
The collected data were analyzed using multivariate statistical methods. An EFA was conducted on respondents’ responses on selected service quality attributes of app-based bus services in Lahore. Maximum Likelihood (ML) method with Varimax rotation was used for this purpose. A cutoff point value of 0.5 was used for the extraction of factors. A higher value of factor loading ensures a strong correlation between observed variables and the corresponding factor (Field, 2013; Hinton et al., 2014; Taber, 2018). The rotation was done to obtain more appropriate and interpretable factors. Cronbach’s alpha values were also estimated to check the reliability of the extracted factors and internal consistency among respondents in evaluating the observed variables. The alpha value of more than .7 shows a good level of reliability of the factors and internal consistency among respondents (Gadermann et al., 2007; Taber, 2018; Tavakol & Dennick, 2011). Structural models were constructed using the SEM technique. This multivariate statistical analysis tool has several advantages over conventional regression analysis. For example, it allows researchers to include multiple observed variables (indicators) and unobserved (latent) variables in the model. It enables the researchers to deduct the direct and indirect effects between the variables in the structural model. Structural models were developed for travelers’ attitudes toward the existence and use of app-based public transport services. It was hypothesized that the respondents’ perceptions of perceived service quality attributes influence their preferences with available app-based transport services. It was also assumed that the specific personal and travel characteristics of travelers also influence their attitudes toward these services. Also, it was hypothesized that the respondents’ personal and travel attributes have a significant influence on their intentions to use Airlift and Swvl services. Initially, an exploratory analysis was conducted on service quality attributes to extract the interpretable factors. Later, these extracted factors were used to develop structural models of travelers’ intentions to use Swvl and Airlift bus services. The skewness and kurtosis parameters were also estimated and compared with their acceptable ranges to check the normality of the measured data. The reliability of the structural model was checked using different goodness of fit parameters. For example, the ratio of chi-square to the degree of freedom should be between 2 and 5; comparative fit index (CFI), the goodness of fit index (GFI), and adjusted goodness of fit index (AGFI) should be more than 0.9; and root mean square residual (RMR) and root mean square error of approximation (RMSEA) are required to be less than 0.08 (Bentler & Bonett, 1980; Hooper et al., 2008; Schermelleh-Engel et al., 2003).
Survey and Analysis Results
Description of Sample
Table 1 shows the descriptive statistics of respondents’ socioeconomic demographics (SEDs). Out of 440 collected samples, 77% were below the age of 30 years, 21.6% were between 30 and 50 years, and only 1.4% of the respondents were above the age of 50 years. The higher number of young respondents (<30 years old) can be attributed to the fact that most of the respondents are students and use these services for educational purposes. Also, the share of the young population is more in the total population, and they are more inclined toward new technology as it provides them an advantage to book their ride using a mobile app. Concerning the distribution of salary bracket, around 11.6% of the respondents were having household monthly income less than 30,000 PKR, 57.5% of the respondents belong to middle-income families with an average income between 30,000 and 60,000 PKR, and 30.9% have average monthly income above 60,000 PKR. This income distribution indicates that people who belong to lower- and middle-income groups choose cheaper public transport services whereas respondents with higher incomes might prefer their private vehicles.
Descriptive Statistics of the Respondents’ Characteristics.

Around 54.5% of the respondents have a travel frequency of 4 to 5 days a week, and 16.4% of the respondents travel almost every day. In trip purpose distribution, 56.36% reported education, and 34.54% manifested work as the main purpose of traveling. The respondents who chose shopping, business, and others as trip purposes are 3.64%, 3.41%, and 2.05%, respectively. The response of the respondents regarding trip characteristics such as safety, travel time, and cost-saving was varying and in agreement with the previous researches (Joewono & Kubota, 2008; Kaderi Wiryono et al., 2018; Martínez Caro & Martínez García, 2007). Almost 67.0% of the respondents manifested that private vehicle is a good choice in terms of safety, 76.36% reported that private vehicle is the best choice for saving travel time, whereas 83.64% said that using public transport is a good alternative to save travel costs. The number of respondents who reported their answers as “Yes” to travel with DRT (i.e., Airlift and Swvl) services was quite positive. For example, 320 (72.7%) and 309 (70.3%) manifested their intentions to travel with Airlift and Swvl, respectively. This indicated that if these services are improved and maintained carefully in fulfilling the travel demands of the passengers, then there is a strong possibility of scaling-up the business of these facility operators, and filling up the gap of the public transport in the city. Around 35.3% of the respondents said that they can wait at stops for less than 5 min, 30.7% said that they can wait up to 5 to 10 min, 19.8% said that they can wait for 11 to 15 min, whereas around 14.2% reported that they are willing to wait even for more than 15 min.
Average Responses and EFA
An EFA was conducted on the respondents’ responses on selected service quality attributes of app-based public transport services. This factor analysis resulted in three factors as presented in Table 2. The extracted factors were named considering the nature of their associated observed variables or indicators and the theoretical background of the previous studies (De Oña & De Oña, 2015; De Oña et al., 2013; Javid et al., 2020; Redman et al., 2013). The indicators with higher factor loadings have more influence in explaining the corresponding factor. These factors are (a) ASA, (b) IA, and (c) SAA. The percent of variance explained by ASA, IA, and SAA is 23.551%, 21.914%, and 21.238%, respectively. The cumulative variance explained by all three extracted factors is more than 60%, which depicts that the extracted factors are significant in predicting the traveler’s attitudes toward app-based transport services (Hair et al., 2012; Samuels, 2017). The estimated values of Cronbach’s alpha are more than .7, which shows good reliability of these factors and internal consistency among respondents in evaluating the corresponding observed variables of each factor (Taber, 2018; Tavakol & Dennick, 2011). The average scores on 5-point Likert-type scales are also presented in Table 2. The results of the ASA factor show that the travelers placed a high score on accessibility and scheduling dimensions of service quality of app-based transport services in Lahore as the factor loadings and average scores are high. The respondents agreed that these services have a better system of providing information to the users regarding schedule, routes, and stop locations of the bus. Even they feel convenient in adjusting their schedule according to the schedule of these services. The travelers who have a positive evaluation of spatial and temporal dimensions of service quality of both services would have high preferences to use the Airlift and Swvl services. The factor loadings and average scores of the IA factor depict that it is easy for travelers to book the ride with Airlift and Swvl bus service through their mobile app and to avail of the travel opportunity as per their booked schedule and route. They believe that these services are more comfortable and friendly for them in comparison with other available transit services in the city. Most of the travelers believe that the drivers of these services possess better skills and behavior in comparison with the drivers of other public transport services. These instrumental characteristics of the service quality may have a significant influence on defining the travelers’ future preferences with Airlift and Swvl services.
Rotated Factor Loadings for Respondents’ Responses on Service Quality Attributes.

Note. ASA = Accessibility and Scheduling Attributes; IA = Instrumental Attributes; SAA = Service Attraction Attributes.
The factor loadings of SAA indicators show that the respondents have a higher level of agreement with these variables. Most of the respondents reported that they use these services because they feel that these services are safer than other public transport modes in the city as safety and security are important factors in their mode selection. They also showed better satisfaction with the fare collection system, as it is a transparent system. They believe that the vehicles’ physical conditions in terms of cleanliness are much better of these services. It is argued that the traveler’s high level of agreement with service attraction-oriented attributes would provide a better understanding of their intentions to use these services in the future.
Structural Model of Travelers’ Perceptions of App-Based Transport Services
A measurement model was constructed comprising three factors, that is, ASA, IA, and SAA. Later this measurement model was used to develop structural models for policy variables of app-based public transport services. The standardized estimates of these measurement equations are shown in Figure 4 with R2 values. All the measurement equations were positive and significant at a 1% level of significance. The estimated covariance among ASA, IA, and SAA are significant at a 1% level of significance and depict good correlations among these factors. Three endogenous observed variables were identified. These three variables included (a) “I think app-based bus ride has filled the gap of public transport in the city,” (b) “Do you have a plan to continue the use of Airlift bus service (use of Airlift service),” and (c) “Do you have a plan to continue the use of Swvl bus service? (use of Swvl service).” The first variable was on a 5-point Likert-type scale, whereas second and third variables were coded as 1 = yes, 0 = no.
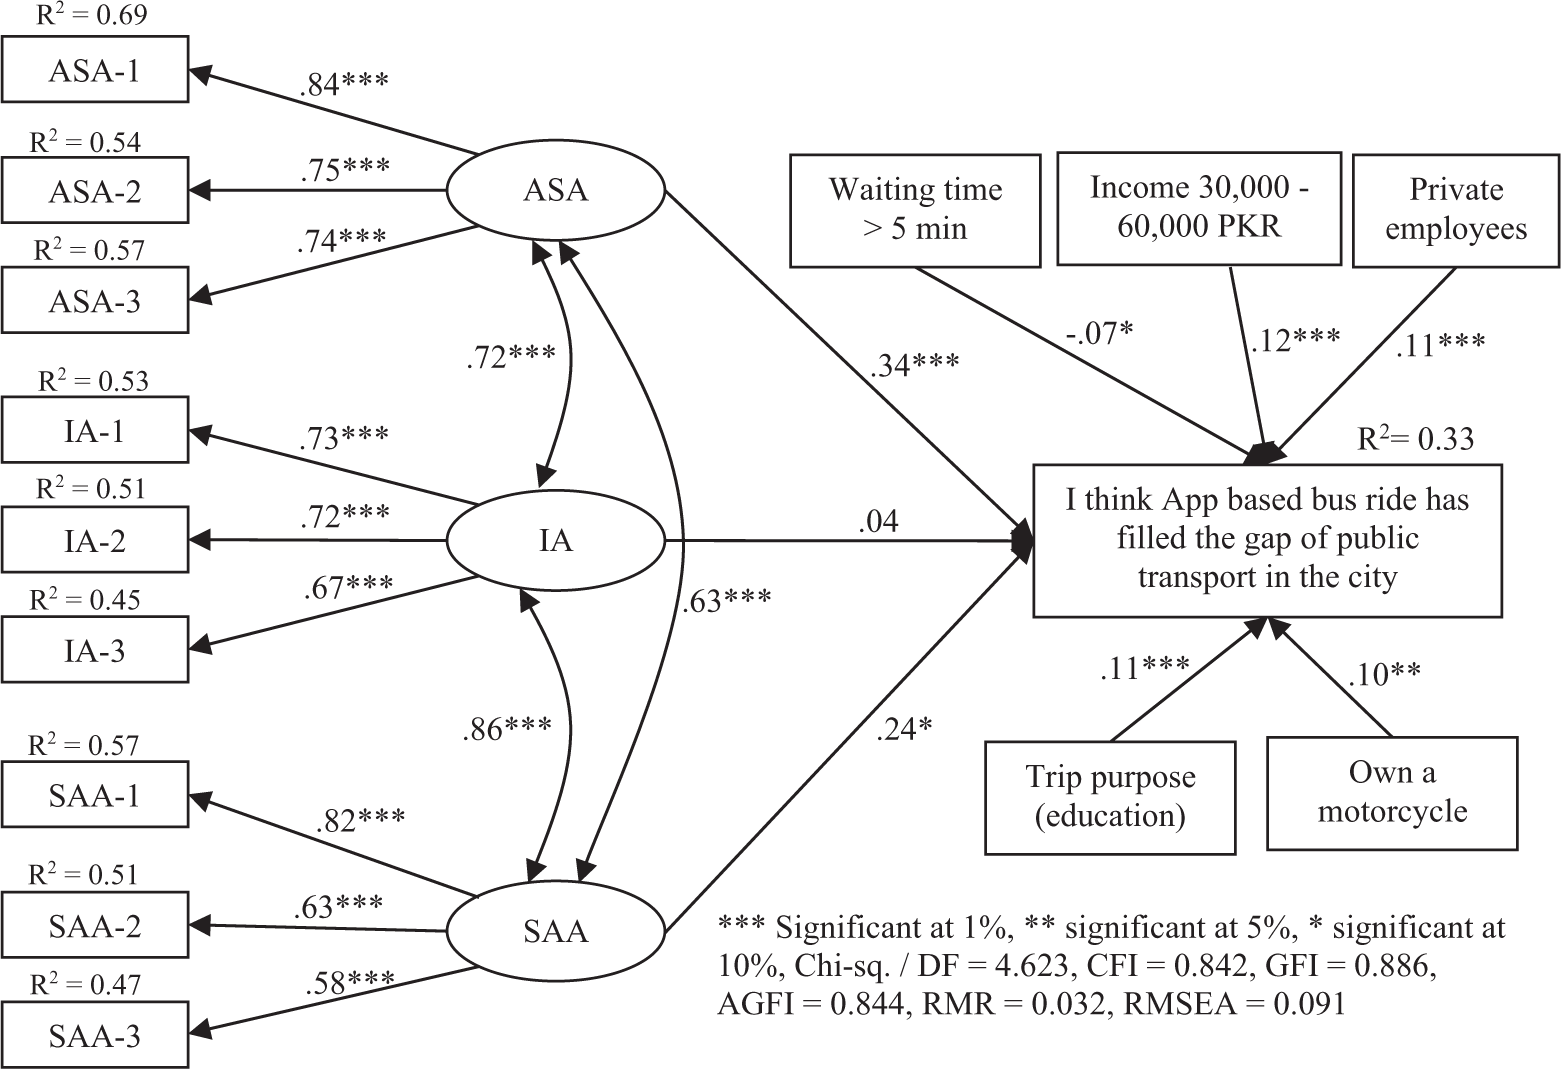
Structural model of travelers’ perceptions of app transport services.
Some observed variables on personal and travel characteristics of respondents were defined and included in the model. These variables were coded as 1, 0, and only significant variables were reported in Figure 4 and Table 3. For example, middle-income: if income is 30,000 to 60,000 PKR = 1, otherwise = 0; if profession is private employees = 1, otherwise = 0; if waiting time is more than 5 min = 1, otherwise = 0; if main trip purpose is education = 1, otherwise = 0; if owns a car = 1, otherwise = 0; if owns a motorcycle = 1, otherwise = 0; and if education is bachelor or above = 1, otherwise = 0.
Standardized Estimates of Measurement and Structural Equations for Respondents’ Preference.

Note. ASA = Accessibility and Scheduling Attributes; IA = Instrumental Attributes; SAA = Service Attraction Attributes; GFI = goodness of fit index; AGFI = adjusted goodness of fit index; CFI = comparative fit index; RMR = root mean square error residual; RMSEA = root mean square error of approximation.
significant at 10%. **significant at 5%. ***significant at 1%.
Three structural models were developed using the results of factor analysis (Table 2). A typical structural model is shown in Figure 4. At this stage, to check the normality of variables in the model, skewness and kurtosis values of all the variables were estimated. The estimated values of skewness of parameters range from −1.40 to 0.921, which falls within the acceptable range of −3 to +3 for SEM analysis (Brown, 2006). Similarly, the estimated values of kurtosis of all parameters range from −1.988 to 3.987, which again fall within the acceptable range of −10 to +10 for SEM analysis (Brown, 2006).
General structural model of app-based bus services
The results in Figure 4 revealed that the structural relationship between ASA and the observed variable of “I think app-based bus ride has filled the gap of public transport in the city” is positive and significant at a 1% level of significance. This structural estimate shows that the travelers’ positive agreement on accessibility, scheduling, and information dimensions has a positive influence on their perceptions concerning existence of an app-based bus service in the city. It implies that improvement in temporal and spatial coverage of these services would help in fulfilling the mobility needs of specific segments of the transit travel market. The structural relationship between SAA and the variable of “I think app-based bus ride has filled the gap of public transport in the city” is also positive and significant at a 10% level of significance which depicts that the respondents who have a positive evaluation of service safety and security, fare collection system, and vehicle cleanliness attributes think that the app-based public transport service quality has filled the gap of public transport requirements in the city and provide an alternative travel option for them. The significance of accessibility, schedule, information provision, fare collection system, drivers’ skills and attitudes, and vehicle cleanliness dimensions of service quality in promoting the app-based DRT services is consistent with the results of other studies (Alonso-González et al., 2018; Davison et al., 2014; Finn & Walters, 2010; Joewono & Kubota, 2006; Redman et al., 2013). The structural relationship between IA and the variable of “I think app-based bus ride has filled the gap of public transport in the city” is insignificant. The observed variable of waiting time (more than 5 min) has a negative and significant (at a 10% level of significance) impact on the potential of app-based services in filling the gap in the city. It means that the increase in waiting time at the designated stop would result in negative attitudes of the travelers and hence will influence the travelers’ preferences with these services. Other researchers have also reported that an increase in waiting time at stops has a negative influence on transit ridership and customer satisfaction with the service quality of public transport modes (Bielen & Demoulin, 2007; Kaparias et al., 2017; Tyrinopoulos & Antoniou, 2008). The respondents having income from 30,000 to 60,000 PKR (middle-income category) and those who are private employees form a positive correlation with their belief on app-based transport service in filling the gap of public transport demand in the Lahore city. Similarly, a traveler whose main trip purpose is education and owns a motorcycle has a positive association with their perceptions related to prospects of app-based public transport services. The travelers’ income, vehicle ownership, and trip purpose are generally found to have significant correlations with their perceptions on public transport modes (Han et al., 2018; Lau & Chiu, 2003). The values of the goodness of fit parameters for this model are also presented in Figure 4. The value of the ratio of χ2/df is in the range of 2 to 5, RMR < 0.08, RMSEA is near to 0.08, and the values of CFI, GFI, and AGFI are near to 0.9, which show that this structural model has an acceptable level of reliability in predicting the traveler’s attitudes.
Structural model of travelers’ preferences with Airlift bus service
The results of the Airlift structural model are presented in Table 3. The observed variable of “Do you have a plan to continue the use of Airlift bus service?” was defined as “use of Airlift service.” The measurement equations of this structural model are also presented in Table 3. All the measurement equations are positive and significant at a 1% level of significance. The standardized estimates of structural equations in Table 3 reveal that the relationship between ASA and the variable of “use of Airlift service” is negative and significant at a 10% level of significance. This shows that the respondents’ have negative intentions to continue the use of the Airlift bus service even if they have positive beliefs on accessibility and schedule dimensions of service quality. This negative construct may be due to fewer routes and buses of Airlift service at present. It is believed that the improvements in spatial and temporal coverage help in improving the rider of the public transport services as these improvements enhance the user’s accessibility to public transport services (Davison et al., 2014; Javid et al., 2015). The structural relationship between IA and the variable of “use of Airlift bus service” is insignificant. Table 3 shows that the structural relationship between SAA and the variable of “use of Airlift service” is positive and significant at a 10% level of significance. It means that travelers who have a positive evaluation of SAA also have positive intentions to continue the use of the Airlift bus service. This is true, as better safety and security and vehicle hygienic conditions always help in improving the transit ridership (Githui et al., 2010; Joewono & Kubota, 2006). The travelers who belong to the middle-income group and own a car at the household have positive intentions to use the Airlift bus service in the future. The structural relationship of private employees with the use of service is also positive. The indices of the goodness of fit parameters show good reliability of the results in predicting the travelers’ intentions to use the Airlift bus service.
Structural model of travelers’ preferences with Swvl bus service
The results of the structural model for the Swvl bus service are also given in Table 3. The observed variable of “Do you have a plan to continue the use of Swvl bus service?” was defined as “use of Swvl service.” All the measurement equations as mentioned in Table 3 are positive and significant at a 1% level of significance. All three structural relationships of ASA, IA, and SAA with a variable of “use of Swvl service” are significant. The negative structural estimates show that even though the travelers have positive perceptions of ASA and SAA attributes, still they have low intentions to continue the use of the Swvl bus service. These negative estimates could be due to the low spatial and temporal coverage at present, and some of the respondents may prefer private transport once they own a car and motorcycle. However, the positive score of IA shows that those respondents who have positive perceptions of IA attributes such as vehicle physical condition, driver’s attitude, and easiness in booking a ride would continue to use the Swvl bus service. This significant relationship is in agreement with the previous studies (Javid et al., 2016, 2018). The relationships of income, private employees, and car ownership with the use of Swvl service are the same as for Airlift bus service. The indices of the goodness of fit parameters show good reliability of the results in predicting the travelers’ intentions.
Discussion and Implications
The travelers have positive perceptions of the existence and potential of app-based transport services in fulfilling the gap of public transport in the city. They also have high intentions to continue the use of Airlift and Swvl bus services. The majority of users of these services are students indicating that these are the preferred alternatives for the students. It is evident from the results that the respondents’ positive attitudes related to accessibility and scheduling characteristics firm their belief on app-based transport services that they are handy in fulfilling the gap of public transport service in Lahore. It is true as they have better access and information to the temporal and spatial aspects of these services, which make their travel more reliable, convenient, and comfortable. They also have freedom in adjusting and fixing their travel schedule considering the schedule of such app-based transport services. Other studies have also shown that the user’s satisfaction with accessibility and spatial attributes has a great influence on travelers’ intentions to use the transit services (Davison et al., 2014; Nwachukwu, 2014). The improvement in spatial and temporal coverage would help in changing the attitudes and intentions of current and potential users. Other researchers have suggested that improvements in accessibility characteristics in terms of spatial and temporal coverage are important attributes that would influence the attitudes of the users (Alonso-González et al., 2018; Javid et al., 2015). The positive belief of travelers on comfort in traveling, drivers’ behavior and skills, and easiness in booking a ride through the mobile app have a strong impact on developing positive intentions. It implies that the app-based Swvl service has drivers with better skills and vehicles in good condition, which develop positive attitudes. It implies that improvements in instrumental dimensions of Airlift service would also help in enhancing its potential in the future. It is believed that particular service attributes significantly influence the users’ satisfaction and travel choices (Javid et al., 2016; König et al., 2018). The positive travelers’ attitudes on service attraction elements such as safety and security in traveling, vehicle cleanliness, and fare collection system help in developing the app-based services in fulfilling the gaps of transit demand in the city. Researchers have stated that these attractions and physical attributes are significant in improving the users’ satisfaction with the service quality of public transport services (Joewono & Kubota, 2006; van Lierop et al., 2018). Also, the users’ potential is positive with the current level of SAA and further improvements would help in enhancing the use of Airlift service. However, with the current level of SAA, the Swvl service has low potential in retaining its users. The results suggest that the Swvl service should focus on improving service and attractive dimensions of its service, as it would help in developing the positive attitudes of the travelers. The positive attitudes of those travelers whose trip purpose is education, private employees, and those travelers who own a private car imply that these services have the potential to attract a specific segment of the travel market. These services are usually helpful to those people whose routes and schedules are aligned with the schedule and routes of these services. The students and employees with a flexible travel schedule can get more benefits from Airlift and Swvl bus services. The increase in waiting time at bus stops puts a negative impact on the attitudes of travelers as users prefer shorter waiting and in-vehicle travel times (Takeuchi, 2003). It means that the reliability in schedule and travel time is important in enhancing the use of these services and developing positive attitudes of travelers toward these services. The main target groups of such app-based transit services should be the students and private employees and those who belong to middle-income groups as these groups have positive intentions. Travelers have positive perceptions about the existence of Airlift and Swvl bus services at present and their potential in fulfilling the gap of public transport for a specific segment of the travel market.
The positive attitudes and beliefs of the travelers are handy in the development and improvements of such demand-based and app-based transit services. The improvement in service quality attributes always helps in altering the customer perceptions and attitudes about the offered service (Bolton & Drew, 1991). The improvements should include enhancing the spatial and temporal coverage to attract more riders from all parts of the urbanized areas. The operators need to focus on reducing the headway of the service to reduce the waiting time at the bus stops. The optimization of the service schedule and routing network is essential to minimize the waiting time and improve the reliability of the services. There is a need to add more bus stops on each route to improve the accessibility of different riders. The provision of real-time bus route information and flexible scheduling are also important to service quality dimensions (Davison et al., 2012). The relevant mobile apps should provide all necessary information to the riders regarding the bus route with all stop locations, arrival time at each stop, time to the destination, and fare structure. The information of each bus driver with routes may also be available in the apps as it will help improve the security of the riders. The service providers need to emphasize on driver’s skills and behavior as these are important aspects of service safety and security. This study results implicate that the proper scheduling and routing, better accessibility and fare structure, provision of all required information to the riders through apps, easiness of booking a ride, travel comfort and vehicle cleanliness, and driver’s skills and behavior are important attributes of service quality that required to focus while planning and designing mobile app-based DRT services in the developing countries.
Conclusion and Limitations
This article identified the travelers’ attitudes toward the prospects of mobile app-based public transport services in Lahore. The survey results revealed that Airlift and Swvl bus services have significant potential in fulfilling the gaps in public transport demand and requirements of the potential users’ market. The extracted factors of ASA, IA, and SAA are significant determinants of the travelers’ attitudes toward the app-based public transport services. The travelers’ income level, profession, trip purpose, car and motorcycle ownership, and waiting time at stops are also underlying factors in determining their attitudes toward transport services. The operators of Airlift and Swvl transport services should focus on improving the accessibility, travel comfort, service reliability, schedule, safety and security, driver’s skills, and attraction aspects of service quality. The operators of these services should increase the number of routes, ensure the reliability of the bus arrival, and travel time. The increase in temporal and spatial coverage would help in improving the satisfaction of existing users and attract new users. These improvements should be based on the demands of their current users as well as potential users. The identification of exact and targeted market segments is very important for the success of DRT services. The students, private employees, and middle-income group people should be the prime target group while developing and improving such DRT services.
Based on the responses and the observations made during the data collection process, the following policy measures are suggested to the service operators of these DRT facilities for scaling-up their operations. The punctuality factor is still not much effective, which sometimes occurs due to unexpected events such as congestion at peak; therefore, a clear mechanism for the compensation of the traveler’s time must be defined in the operational policies of these DRT services. Proper planning for the expansion of the spatial coverage of these services should be done based on the demand for each route. Based on the users’ demand, well-defined information for the allocation of new routes must be conveyed to the travelers and their feedback must be sought before finalizing a new route. As most of the existing riders of these DRT services are students, a special concession/monthly fare package may be offered to attract a greater number of potential travelers. Also, the frequency, scheduling, and routing can be adjusted based on the opening and closing timings of the on-route educational institutions to accommodate more potential travelers.
The findings of this study help in deriving the policies for the development and improvements of app-based demand-responsive public transport services. However, the extracted findings have limitations in their implications as the Lahore city has different social, cultural, and transportation system characteristics in comparison with other regions. Attention must be given to the local factors while generalizing the implications of these findings. This study included the responses of the current users; therefore, future studies should also focus on obtaining the responses of nonusers, as their preferences and attitude are also important in developing effective transport policies. There is a need to consider the individual’s personality factors, specific attitudes, and social and cultural constraints in identifying the potential of such kind of transport services as these factors greatly influence the acceptability and effectiveness of transport policies. The institutional and regulatory aspects of the DRT services are required to consider while discussing the place of such services in the framework of the local public transport system (Ryley et al., 2014). The DRT services also have environmental and social implications in reducing environmental pollution and providing benefits in terms of a better level of service (Diana et al., 2007). Future research should take into account the social, traffic demand, and environmental aspects while evaluating the potential of DRT services. With stated limitations, it is said that these findings would provide a clear picture of the prospects of DRT services in Lahore and would help the transport planners and decision-makers in the development and implementation of appropriate public transportation policies. The extracted findings also have significant implications for other developing countries.
Footnotes
Acknowledgements
The authors acknowledge the support of all the concerned institutions that helped in collection of the required data. The authors are also thankful to the university students and service providers in facilitating to conduct the questionnaire survey.
Declaration of Conflicting Interests
The author(s) declared no potential conflicts of interest with respect to the research, authorship, and/or publication of this article.
Funding
The author(s) received no financial support for the research, authorship, and/or publication of this article.