
Abstract
Self-esteem has always been a hot research object in the field of adolescent mental health. But in longitudinal research, using a single slope to describe the trajectory of adolescent self-esteem is unrealistic. The piecewise growth mixture model (PGMM) was used to fit the data in this study. Selecting from China Family Panel Studies database, a total of 1,759 individuals were selected and their self-esteem (RSES) scores over the years were used as the tracking index. Based on the characteristics of the development trajectories of three latent classes, class 1 was referred to as “stable low level group,” class 2 was named “rapidly rising group,” and class 3 was referred to as “rapidly decrease group.” And there were two stages in the development process of self-esteem in the adolescent group. The slope of the stable low level group showed a significant downward trend in the first stage and a significant upward trend in the second stage, with a relatively flat development trajectory and relatively low self-esteem on the whole. The slope of the rapidly rising group showed an insignificant upward trend in the first stage and a significant rapid upward trend in the second stage. The rapidly decrease group showed a significant and rapid downward trend in the first stage and a significant and rapid upward trend in the second stage. In the development of self-esteem in adolescence, there were three latent classes in which the characteristics of development trajectories were different. Age of 14 is the turning point between the two stages of development.
Keywords
Introduction
Self-esteem is defined as an individual’s positive or negative attitude toward the self (Rosenberg, 1965). According to a meta-analysis of self-esteem (Huang, 2010), adolescents with lower levels of self-esteem tend to have lower levels of self-efficiency, poorer academic performance, and higher levels of anxiety, as well as more problem behaviors. Mruk (2013) pointed out that adolescence is an important stage of individual self-development. Understanding the development trend, characteristics and influence mechanism of adolescents’ self-esteem has positive theoretical and practical significance for promoting adolescents’ self-development. And during adolescence, except for some other mental and physical development, a shift in living conditions (e.g., a transition from middle school to high school) might also result in changes in self-esteem. Faced with environmental changes and the challenges caused by them, an individual’s self-esteem determines whether he or she can deal with it. Therefore, adolescence is considered an important period to examine the stability and changes of self-esteem (Leahy & Harter, 2001). Huang (2010) also pointed out that individuals who successfully deal with the challenges encountered in development are more likely to have higher levels of self-esteem.
It has showed that self-esteem does change over adolescence. Therefore, it is necessary to conduct a longitudinal study on the self-esteem development of adolescents and explore the development trajectory of self-esteem. Most longitudinal studies focus on the cross-lagged relationship between self-esteem and other variables (Ching, 2021; Krauss, 2020; Yang, 2021; Yu, 2021), which help us understand the influence mechanism of self-esteem, but cannot explore the development trajectory. Some about trajectory focus on the development trend. Erol and Orth (2011) tracked the overall self-esteem of more than 7,100 U.S. adolescents, showing a consistent increase from the age of 14 to early youth trend. Birkeland et al. (2012) conducted a tracking analysis on the overall self-esteem of 1,083 Norwegian adolescents (13–30 years old), and found that the self-esteem of most subjects (87.1%) showed a steady upward trend. Different from the results of the above-mentioned follow-up study, Robins and Trzesniewski (2005) pointed out that the self-esteem of male and female adolescents showed a steady downward trend from 9 to 18 years old.
Regarding the development of self-esteem, the growth curve model was used to estimate the internal variation of self-esteem in adolescents aged from 11 to 21 and researchers found a non-linear variation in self-esteem during adolescence with distinct individual differences (Baldwin & Hoffmann, 2002). In further studies, no significant inter-individual variation was found in self-esteem among young people aged 23 to 28. However, individual differences were found in other studies, turned out that individual differences did exist in self-esteem development of adolescence (Donnellan et al., 2007). Thus, more studies designed mainly to identify different development trajectories of self-esteem especially from adolescence to young adulthood are needed.
During adolescence, four types of developmental trajectory of self-esteem were identified: the “stable high group” (35%), the “chronically low group” (13%), the “steeply declining group” (21%), and “small increase group” (31%) while Zimmerman et al. (1997) found another four subgroups: “consistently high group” (48%), the “moderate and rising group” (19%), the “steadily decreasing group” (20%), and the “consistently low group” (13%; DuBois, 1994; Hirsch & DuBois, 1991; Zimmerman et al., 1997).
However, only three subgroups were established in a study conducted by Deihl et al. (1997): the “stable high level group” (47%), the “small increase group” (37%), and the “persistent low level group” (16%). Birkeland et al. (2012) used the growth mixture model to explore the development trajectory of self-esteem in different subgroups and latent classes were defined: the stable high level group (87.1%), the persistent low level group (5.5%), and the “U” shape group (7.7%). Follow-up studies also suggested that the trajectory of self-esteem among Chinese adolescents represented a U-shaped curve, in which the self-esteem levels in the second and third years of middle school were relatively low (Pan, 2015). This was consistent with the conclusion of another study conducted by Huang et al. (2003). Numerous attempts have been made to investigate the continuity of self-esteem development whereas little is known about whether discontinuous process also exists in the self-esteem development.
Studies have found that both continuity and discontinuity can be seen in the development of self-esteem in primary and middle schools. There are eight dimensions to the development of self-esteem. Among them, the development of school competence, athletic competence, physical appearance, intimate friendship, and romantic attractiveness continues. There were discontinuities in social acceptance, job competence, and behavioral conduct (Białecka-Pikul et al., 2019). Additionally, the second year of middle school has been considered a critical period for the self-esteem development since the second or third year of middle school may be a turning point of self-esteem development (Li, 2016). Meanwhile, the development of self-esteem has a non-linear relationship with age, it also can be affected by life events and family factors (Baldwin & Hoffmann, 2002). This suggests that while self-esteem development is ongoing, there are various stages of development. However, researchers did not emphasize multi-step changes and the location of turning points.
In longitudinal study, latent growth curve model (LGCM) assumes that there is no difference among population and the trajectory is smooth and linear. Although the growth mixture model (GMM) allows for heterogeneity between groups, it still assumes that the trajectory of each group is linear. However, during the development of self-esteem, the trajectory can be nonlinear or discontinuous. To further explore the nonlinear or discontinuous changes in self-esteem development, it is inappropriate to applying LGCM or GMM is inappropriate. The piecewise growth mixture model (PGMM) allows heterogeneity in the population and assumes that the trajectories are discontinuous. It takes into account the advantages of LGCM and GMM, which can simultaneously solve the problems of turning points and heterogeneity in development trends as well as exploring different development stages. It has been widely applied to the fields of capacity development, clinical practice, and social behavior (Kamata et al., 2012; Li et al., 2001; McAuley et al., 2011; Muthén & Brown, 2009; Uher et al., 2010). Li et al. (2001) conducted a study to investigate the development of alcohol addiction in adolescence using the framework of PGMM initially and found that a two-piece linear model with two latent classes yielded more convincing results than the linear model, quadratic model, and the random model. Liu and Liu (2018) applied PGMM to explore the characteristics of language development in early childhood. Children were divided into three subgroups and each development trajectory was divided into two stages according to the development tendency. McAuley et al. (2011) examined development stages and latent classes of exercise self-efficacy among older adults, in which the piecewise growth model was first used to discuss the different stages, and the analysis of latent classes (LCA) was used to discuss the different latent classes. This is a two-stage analysis method, and different results may be obtained if the latent class is analyzed first and the development stage is then evaluated. Uher et al. (2010) used PGMM to study the developmental trajectory of depressive symptoms patients with depression during treatment. However, the types of patient development can be categorized and explained according to differences in treatment strategy. Bulk of researches had proved the superiority of PGMM in addressing the issues of discontinuity, heterogeneity, and turning points among other longitudinal models. More importantly, it may shine some new light on investigating the development trajectory of self-esteem.
Much work has been done regarding the factors that affect the development of self-esteem. Therefore, the primary objective of this study was to explore the stages in the development of self-esteem in different subgroups. The existence of several latent groups in the trajectory of self-esteem and characteristics of the development trajectory were also examined.
Recently, research on self-esteem has also focused on its influencing factors. When studying the differences in self-esteem, previous researches showed that there are gender differences in self-esteem levels under the premise of considering regional factors. For example, a researcher conducted a study on the self-esteem level of college students and found that in the urban group, the self-esteem level of girls is higher than that of boys; in the rural group, the self-esteem level of boys is higher than that of girls (Tang, 2010).
Studies have found that only in terms of self-esteem, the average self-esteem level of rural youth groups is generally lower than that of urban youth groups (Zhang, 1997).
Subjective well-being is also a predictor of self-esteem. But there are few studies on the influence of subjective well-being on the self-esteem level of adolescents. In a meta-analysis study on the subjective well-being of Chinese adolescents, it is found that there is a moderate correlation between subjective well-being and self-esteem of Chinese adolescents. At the same time, the two variables of region and age have a significant moderating effect (Yang & Zhang, 2019).
The school’s micro-environment is also crucial to the mental health of adolescents, which is mainly reflected in the influence of peer groups. Peer group refers to the primary group relationship established by individuals of similar age, interest, and psychological development in the process of interaction and communication.
After entering junior high school from elementary school, in order to cope with the high school entrance examination 3 years later, the academic pressure of students has risen sharply. When students study under an overloaded state for a long time and lack motivation and interest at the same time, they tend to breed negative emotions of boredom and frustration, and then enter a state of learning burnout (Hu & Dai, 2007). Learning burnout affects students’ learning engagement, distracts learning, breeds negative emotions, etc., and seriously affects the mental health of young people (Xing & Chen, 2011). Studies have also found that self-esteem plays a part of the mediating role in the relationship between academic success and failure attributable to learning burnout (Gao & Liang, 2020). Based on previous studies, it can be found that study stress can cause learning burnout, and learning burnout further affects the self-esteem level of young people through the mediating effect. Previous studies did not put learning pressure into the paradigm of longitudinal research to examine the dynamic impact of study pressure on self-esteem.
Based on the above, the hypotheses of our study were as follows:
Hypothesis 1: There would be several subgroups with different trends during development of self-esteem.
Hypothesis 2: From the age of 10 to 18, the development trajectory of self-esteem would be a smooth linear growth trend without any turning points.
Hypothesis 3: A turning point at age of 14 divided trajectories into two stages, both stages showed a linear growth trend but had a significant different intercept and slope.
Hypothesis 4: A turning point at age 14 divided trajectory into two stages. The first stage before the age of 14 was linear growth trend, the second stage after the age of 14 is quadratic growth trend.
Hypothesis 5: Some factors such as gender, residence, subjective well-being, campus satisfaction, and study stress would be the predictors of self-esteem.
Method
Participants
The China Family Panel Studies (CFPS) was a nationwide, comprehensive, longitudinal social survey, which gathers information of Chinese society and population, economic activities, education outcomes, and health by collecting individual-, family-, and community-level longitudinal data to support academic and policy research (Xie & Hu, 2014). The baseline measurement was officially launched in 2010 with a sample size of 19,986 households covering 25 provinces/municipalities/autonomous regions. A total of 42,590 family members were interviewed, including 33,600 adults and 8,990 children. The response rate, cooperation rate, and contact rate are 81.25%, 96.58%, and 84.13%, respectively, at the household level. As for individual level, the data are 84.14%, 87.01%, and 8.47%. Since 2010, CFPS has been being conducted biennially. Four waves of the CFPS (2012, 2014, 2016, and 2018) had been carried out so far.
Besides the CFPS 2010 baseline survey, the subjects took part in the follow-up survey were also investigated. The age of the subjects in the baseline survey was limited to 10 (born in 2000) for the consistency between the tracking data and the limitation of CFPS on the age of answering the questionnaire. In addition to the 2010 data, the 2012 data also analyzed adolescents of 10, 12, and 14 years old who participated in the baseline survey, that is, individuals born in 1998, 2000, and 2002. Follow-up surveys in 2014, 2016, and 2018 did not limit the age of subjects who answer the questionnaire. Only the tracking data of individuals born in 1998, 2000, and 2002 were investigated, however, tracking data of individuals after 2012 were excluded. A total of 1,759 subjects were screened out. Among them, women accounted for 48.3% of the total.
Measurement
The self-esteem of adolescents was measured using Self-esteem self-rating Scale (RSES), which was one of the most widely used self-esteem measurement tools developed by Rosenberg aiming at assessing the self-worth and self-acceptance of adolescents (Rosenberg, 1965). The original version includes 10 items (5 of them are reverse scoring questions), rated on 4-point scales. However, there were some adjustments in CFPS 2012 questionnaire (e.g., question 9 was deleted). Specifically, as for children’s self-report questionnaire, the M1 part was the RSES in CFPS 2012, consisting of 13 questions from M101M to M114M (see Appendix for details). All items were measured on 5-point scales with high scores indicating a high level of self-esteem. For positive scoring questions (1, 2, 4, 6, and 7), 5 = strongly agree, 4 = agree, 3 = neither agree nor disagree, 2 = disagree, and 1 = strongly disagree. For the other questions, the scoring method was reversed.
This research adopted the questions 1, 2, 3, 4, 5, 6, 7, 8, and 10 of the adjusted RSES for the consistency of the questionnaires in the tracking. The Cronbach’s alpha coefficients for the Revised SES were .795, .692, .687, .714, and .612 at T1, T2, T3, T4, and T5, respectively.
Analysis
All analyses were conducted by using SPSS (Version 25.0) and M-plus (Version 7.0) software (Muthén & Muthén, 2012). We proposed that there was a turning point in the development of self-esteem at the age of 14, which divided the trajectory into two stages. Therefore, we presupposed two growth trends: linear growth trend and quadratic growth trend. Based on these studies (Birkeland et al., 2012; Hirsch & DuBois, 1991; Zimmerman et al., 1997), we explored the development trend of self-esteem under the framework of GMM, and selected the optimal model by gradually increasing the number of latent classes.
Combined with the actual data, the path coefficient corresponding to intercept α during the five waves would be fixed as (1,1,1,1,1). The path coefficients corresponding to the first stage slope S1 during five waves were coded accordingly as 1,2,3,3,3 while the path coefficients to second stage slope S2 were fixed as (3,3,3,4,5).
The path diagram of the two-stage growth mixture model for self-esteem development was shown in Figure 1. As was shown in the picture, Y1 to Y5 were the scores of RSES for individual measured on five waves. The parameters I and S1 are the intercept and slope of the first phase, while S2 is the corresponding growth factor of the second phase after the turning point. In PGMM, we uses these three parameters to describe differences between groups and within groups. Specifically, the mean value of the intercept factor describes the average initial state, and the variance of the intercept factor represents the degree of difference between individuals at a specific time point; the mean value of slope factor represents the average growth rate between time points, and the variance reflects the size of the difference in growth rate between individuals. A latent class variable C indicated a separate model for each latent class k. X represented a number of covariates.
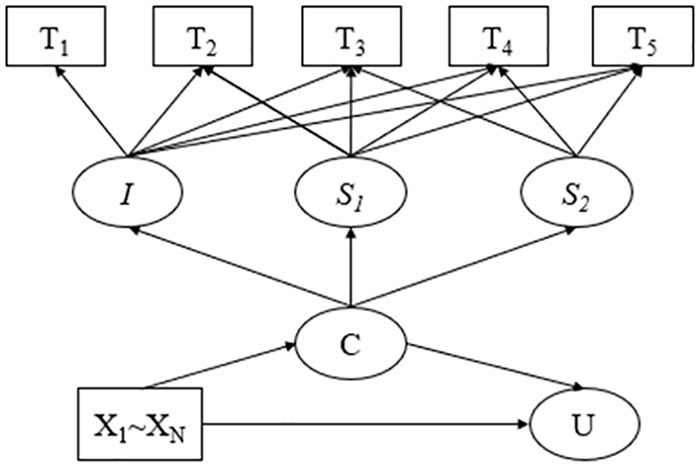
Two stages growth mixture model.
We used Akaike Information Criteria (AIC; Akaike, 1974), Bayesian Information Criteria (BIC; Schwarz, 1978), and Sample Adjusted BIC (ABIC; Rissanen, 1978) for model selection. Lower AIC, BIC, and ABIC values indicate better fit to the data (Kam, 2018).
Entropy (EN) measures the performance of classification for a mixture model ranging from 0 to 1, with 1 indicating perfect classification.
Results
Under the GMM framework, the best fitting model was determined by gradually increasing the number of potential categories from starting with one latent class. The fitting indexes of the model include AIC, BIC, and aBIC. Smaller value predicts a better fitting of the model. When the sample size is large enough, BIC usually decreases with the increase of the number of latent classes, and thus researchers tend to choose the model with potentially the greatest number of latent classes. For example, Logan and Petscher (2010) proposed to determine the optimal number of latent classes through the downward trend of scatter plot.
The change curve of BIC value was displayed in Figure 2. As presented, when latent classes increased to four, the rate of change (declining) of BIC value became slower than before. And because of the impact of sample size, BIC tends to support simpler models. Therefore, in terms of the development of self-esteem, a GMM with three latent classes was fairly acceptable.

BIC value change curve of GMMs.
On the basis of growth mixture model with three latent classed, a PGMM was conducted to fit the data for further exploring the multi-stage changes of self-esteem development. During this process, a linear-linear and a linear-quadratic PGMM were proposed and the fitting indexes of them were compared to that of GMM. Although both fitting indexes of two PGMMs were better than GMM, those of linear-linear PGMM were superior to those of the linear-quadratic PGMM. Also, the entropy value (0.955) of linear-linear PGMM was well above the minimum acceptable standard. Model fit information was summarized in Table 2.
Descriptive Statistics.

Model Fit Information of GMMs.

The slopes and intercepts of linear PGMM were shown in Table 3. Class 1 accounted for the majority of population (n = 1,634, 92.9%) with the lowest baseline mean value (M = 18.618). For this subgroup, the slop showed a significant downward trend in the first phase during 10 to 14 years old (t = −11.189, p < .001). By contrast, slop of second phase during 14 to 18 years old showed a significant upward trend (t = 39.491, p < .001). Overall its development trend was relatively stable. Class 2 (n = 56, 3.2%) had a lowest baseline mean value (M = 14.955). This class shown a rapidly increased in the first stage (t = 5.515, p < .001), second stage was a decline trend in the opposite (t = −3.163, p < .001). With the highest baseline mean value (M = 27.121), the development trend of class 3 (n = 69, 3.9%) was a rapidly decreasing curve: the slope before the age of 14 (t = −10.671, p < 0.001) decreased significantly while increased remarkably after 14 (t = 10.165, p < .001).
Intercept and Slope of Latent Classes.

p < .001.
Among the three models, the AIC and BIC of GMM and quadratic PGMM were higher than linear PGMM. Therefore, linear PGMM was optimal model.
Based on the characteristics of the development trajectories of three latent classes, class 1 was referred to as “stable low level group,” class 2 was named “rapidly rising group,” and class 3 was referred to as “rapidly decrease group.” The trajectories of the three latent classes were shown in Figure 3.

Development trajectory of adolescent self-esteem (after imputation).
The results of multiple logistic regression analysis are shown in Table 4, in which we could find that gender (β = −1.107, p = .017) and subjective well-being of adolescent (β = .465, p = .050) make significant difference among three groups. Compared with reference group (rapidly decrease group), female adolescents were less likely to be classified into stable low level group (67%) than their male counterparts (OR = 0.330). For each unit increase in subjective well-being, the probability of adolescents being classified into the stable low level group increased by 59.1% (OR = 1.591). However, residence (β = .350, p = .407), campus satisfaction (β = .063, p = .337) and study stress (β = -.046, p = .790) made no significant difference among three groups.
Prediction of Gender and Subjective Well-Being of Latent Classes.

Discussion
To investigate the self-esteem development trajectory of adolescents, RSES scores were collected for 1,759 adolescents from CFPS at five time points: the age of 10, 12, 14, 16, and 18. By analyzing these data, we estimated a two-pieces growth mixture model which contained three latent classes. As hypothesized, this study distinguished three meaningful development trajectories of self-esteem among adolescents from the age of 10 to 18. According to the characteristics of development trajectories, “stable low-level group” (n = 1,634, 92.9%), “rapidly rising group” (n = 56, 3.2%), and “rapidly decrease group” (n = 69, 3.9%) were identified respectively.
In terms of the development trend and proportion of the “rapidly decrease group,” our findings were consistent with previous studies (Birkeland et al., 2012; Pan, 2015). Additionally, studies with relatively short tracking time found that self-esteem showed a rapid decline from early childhood to late childhood, which was in line with the trend in the first stage of the “rapidly decrease group” in current study (Hirsch & DuBois, 1991; Wang & Li, 2017). It suggested that a small proportion of adolescents tend to experience a significant decline in self-esteem before the age of 14 and a dramatically increase after the age of 14. Such developmental characteristics were also in line with the intense changes in the mental state of adolescents. It was noteworthy that although the self-esteem level of the “rapidly decrease group” at the age of 14 was much lower than that of the other two groups, the baseline mean value was much higher than the other two groups. This may indicate that in reality, educators should pay attention to individuals with high self-esteem levels in primary school, and provide appropriate psychological assistance for them to get through the period in which there is a rapid decline in their self-esteem levels.
The follow-up studies of Zimmerman et al. (1997) and the studies of Hirsch and DuBois (1991) both described a “small increase group.” The development trajectory of the “stable low level group” was similar to that in this study. Although the self-esteem level of the “stable low level group” had a moderate intercept, we did observe a significant downward trend before the age of 14. As shown in Figure 3, the growth trend was relatively slow. After the age of 14, their levels of self-esteem showed a significant upward trend. However, previous short-term longitudinal studies failed to find the development characteristics of the second phase. Additionally, the general linear growth model failed to describe the characteristics of an individual’s mental changes accurately in more than one stage. The current studies of on the latent class of self-esteem in adolescence suggested that the latent class with moderate self-esteem levels have the largest proportion of subjects. According to the scoring standard of the RSES, scores between 20 and 29 indicate a moderate level of self-esteem and are within normal range. As question 9 in the RSES was deleted in this study, the self-esteem level of the “stable low level group” was in middle compared to the other two groups. Although there was a significant linear decline before the age of 14 and a significant linear increase after 14, the overall trajectory of self-esteem shown relatively stable and did not fluctuate extremely, which may suggest that in adolescence, most individuals have stable and normal levels of self-esteem.
“Rapidly rising group” only possessed smallest proportions of participants, and their mean self-esteem levels at the baseline and at the first measurement were lower than those of the other two groups. In the “stable low-level group,” the self-esteem levels in the first stage showed a dramatic linear increase, as we can see from Figure 3 that its development trajectory showed a sharply linear growth trend in the first stage. The “rapidly decrease group” and “rapidly rising group” consisted of a lower proportion, which was also one of the advantages of the growth mixed model. According to the heterogeneity of the population, GMM divides the population into several latent classes, which can improve the homogeneity within the latent classes, and amplify the individual differences in the population. In this study, PGMM divided participants into three latent classes based on the heterogeneity of the population. The homogeneity within the latent classes can magnify the differences between individuals, which can make it easier to observe the development trajectory of these latent classes.
Instability is one of features of the mental condition. It is unrealistic to describe the development and changes in adolescents’ self-esteem using only a slope since an individual’s mental state changes drastically during this age range. Trends in multi-stage development tend to describe more precisely the trajectory of self-esteem development in adolescence. In this study, the slopes of “stable low level group” and “rapidly decrease group” in the first stage showed a significant downward trend while the slope of “rapidly rising group” in the first stage increased whereas turning into a downward trend in the second stage. Harter (1983) also found that adolescent self-esteem tended to decline during the first year of middle school. Simmons et al. (1973) pointed out that children’s self-esteem developed steadily during the fifth and sixth grades, and began to decline at the age of 12 to 13. It suggested that the self-esteem of adolescents shown a download trend before the age of 14. After the age of 14, most of participants in the second stage showed a significant upward trend. This indicated that the turning point in the development of self-esteem was at the age of 14. At the age of 14, adolescents were in the second grade of middle school. During this period, adolescents have just left primary school and entered middle school not for a very long time, and significant changes may occur in the living environment and study pressure. In terms of interpersonal interactions, leaving teachers and classmates who have been with them for 6 years as well as facing a new teacher and new environment can be challenging. Adolescents need to adapt to the new environment and get along with new classmates and teachers. Whether they can successfully cope with these challenges determines the level of self-esteem of adolescents during this period. Moreover, the curriculum in middle school involves a wider range of knowledge and is much more difficult than the primary school curriculum. The ability to overcome the difficulties encountered in the learning process also had an important impact on self-esteem. In terms of physical and mental development, individual at the age of 14 begins to enter adolescence, and there is a second leap in self-consciousness. At the same time, self-consciousness became more and more independent, and focused on individual development, forming a comprehensive self-evaluation system which paid more attention to others’ judgment and self-evaluation. All these changes have important impacts on self-esteem. Therefore, the age of 14 is a turning point and critical period for the development of self-esteem in adolescence.
Finally, we considered the influence of covariates to classification of adolescent self-esteem, as for gender, we found that women are more likely members of stable low level group, which may because of the difference on focus on body image (Tiunova, 2015). And high subjective well-being of participants predicts that they are more likely to be classified into lower-level groups. This may be due to the traditional Chinese cultural background. In order to maintain the harmony and stability of the relationship in the collective society, sometimes personal thoughts and feelings will be selectively ignored by oneself or others. In other words, in order to maintain people’s self-esteem, individuals have to abandon their pursuit of material and spiritual life, thereby decreasing their degree of subjective well-being.
Conclusion
In the development of self-esteem in adolescence, there were three latent classes in which the characteristics of development trajectories were different. As for “stable low level group,” there was a significant linear downward trend during the first phase and a significant upward trend during the second phase. In the “rapidly rising group,” a significant upward trend was seen during the first phase along with a significant upward trend during the second phase. The self-esteem of the “rapidly decrease group” showed a significant downward trend in the first stage and a significant upward trend in the second stage. The turning point of the development trajectory of self-esteem in all three latent classes occurred in the second year of middle school at the age of 14.
Limitations
First of all, the China Family Panel Study (CFPS) was conducted at intervals of 2 years, and the time span was too long, which can result in ignoring some meaningful developmental characteristics during the time interval. In the existing studies, although the follow-up time was not very long, the trajectory of self-esteem obtained contained more information and details, which was more in line with the real situation of adolescent self-esteem development. In addition, the tracking time of this study was long and the range was wide, resulting in the loss of many samples during each follow-up in the later period. Even if the multiple imputations was used to imputate the missing data, the final result would be affected to some extent. Secondly, the score of the revised RSES was used as the tracking index. Under the premise of deleting an item, the result may deviate from the actual situation. Finally, the research did not take into account that the data is a nested structure in which personal data is nested within the households, and household data is nested within communities, so when doing longitudinal analysis, it did not consider the impact of variables of family and community on individuals.
Footnotes
Appendix
Rosenberg (1965) Self-Esteem Scale
To what extent do the following statements apply to you?
On the whole, I am satisfied with myself. (P)
At times, I think I am no good at all. (N)
I feel that I have a number of good qualities. (P)
I am able to do things as well as most other people. (P)
I feel I do not have much to be proud of. (N)
I certainly feel useless at times. (N)
I feel that I’m a person of worth, at least on an equal plane with others. (P)
I wish I could have more respect for myself. (N)
All in all, I am inclined to feel that I am a failure. (N)
I take a positive attitude toward myself. (P)
Response categories: 1 = applies not at all, 2 = does not really apply, 3 = partly, 4 = rather applies, and 5 = applies completely.
P = positively worded, N = negatively worded (reverse scored for creating a sum score).
Author Contributions
Each author has contributed significantly to the work and agreed to the submission.
Declaration of Conflicting Interests
The author(s) declared no potential conflicts of interest with respect to the research, authorship, and/or publication of this article.
Funding
The author(s) disclosed receipt of the following financial support for the research, authorship, and/or publication of this article: This research was supported in part by Grant No. 18YJA190006 from the Ministry of Education Foundation of the People’s Republic of China, Grant No. GD17CXL01 from the Philosophy and Social Science Foundation of Guangdong Province, and Grant No. 2021A1515012516 from the Natural Science Foundation of Guangdong Province.