
Abstract
Insufficient equalization of public services and coexistence of high investment and low consumption are two major dilemmas facing the high-quality development of China’s economy. This study first evaluated the level of equalization of public services by provincial panel data from 2013 to 2017. Then econometric models were constructed to investigate the effect of the equalization of public services on the regional disparities in the ratio of investment to consumption (IC). Results show that the overall level of equalization of public services in China is low and there are large regional differences. Average values of the relative level of equalization of public services show an increasing trend in order of the eastern, central, northeastern, and western regions. The ratio of IC in China also exhibits large regional differences. Public education significantly negatively affects the IC in China, and the effects exist in the eastern and central regions. The seven evaluation criteria of equalization of public services in different regions have different effects on the ratio of investment to consumption. Therefore, according to the characteristics of the relationship between the equalization of public services and the ratio of investment to consumption at the whole or regional scales, a reasonable pathway should be selected to improve the current situation of high investment and low consumption and promote high-quality and sustainable development of the Chinese economy under the new normal.
Keywords
Introduction
With the rapid economic growth resulting from China’s reforms and opening up, investment and consumption have consistently been two important targets for China’s macroeconomic regulation. In the process of China’s economic growth, the investment rate, namely the ratio of fixed asset investment to GDP in the whole country has been high, and the consumption rate, namely the ratio of final residents’ consumption to GDP, has been consistently low. According to “China Statistical Yearbook 2018,” the proportion of Chinese residents’ consumption in GDP dropped from 47.82% to 38.39% from 1978 to 2017, and the proportion of total social fixed asset investment in GDP rose from 29.78% to 77.53%. According to World Bank data, China’s investment rate is significantly higher than the world average, whereas the residents’ consumption rate is significantly lower than the world average. An excessive investment rate will lead to large-scale overcapacity and an increase in banks’ non-performing assets (López-de-Foronda et al., 2018; Schnabl, 2019), and a low consumption rate will exacerbate the shortage of domestic demand, which will adversely affect the quality of economic development in China (Su et al., 2019). Meanwhile, the current demand for basic public services by Chinese residents is increasingly diversified and complicated, and the efficiency of public service supply is low, resulting in decreasing residents’ satisfaction with public services (Gazzeh & Abubakar, 2018; Wang, 2019). There are obvious differences in the supply and demand structures of public service among regions. The efficiency of public services supply will directly affect the strength of social investment and residents’ willingness to consume. Therefore, as China’s economy has entered a new stage, improving the level of equalization of public services, increasing residents’ consumption demand, and reducing the excessive dependence of economic growth on investment, thus improving the proportional relationship between investment and consumption is important measure to achieve stable transformation of China’s economy and high-quality economic development.
The current regional development of public services in China is uneven. Under this circumstance, if China lacks corresponding emergency preparedness and public governance, it will threaten the stability of the social system (Al Kurdi, 2021; Alqooti, 2020). Therefore, it is possible to accelerate the process of equalization of public services in China by combining the Internet of things management mode, policy design, and other effective ways (Qian, 2017; Wu & Xiao, 2021), and it can eliminate the negative impact of uneven development and promote social justice (Li, He, et al., 2020; Liu & He, 2019; Wang & Chi, 2016; Youssef & Diab, 2021).
At the same time, the phenomenon of high investment and low consumption will cause many adverse effects. The traditional, economic high-investment, and high-consumption development model no longer meets the development needs of the new economic normal, especially in the northeast region (Kirsch, 2020; Li, Jia, et al., 2020; Tan et al., 2017). Coupled with the continuous downturn in China’s consumption, these challenges will hinder industrial development to a certain extent (Tsukhlo, 2018).
Public services are closely related to people’s daily lives and have an extremely important impact on both investment and consumption. From the perspective of investment, on the one hand, various preferential policies arising from competition between local governments will lead to productive public expenditure, which will increase investment (Dorsey-Palmateer & Niu, 2020; Takahashi, 2004). On the other hand, the government’s guiding strategic flexibility policy for enterprises can help enterprises maintain sustainable development in turbulent times (Elali, 2021). In addition, strengthening basic public facilities will not only increase investment but also provide corresponding basic guarantees for regional economic development (Banerjee et al., 2020; Gazzeh & Abubakar, 2018; Lan et al., 2018). From the perspective of consumption, fiscal basic public service expenditure will not only promote consumption by residents but also may widen the consumption gap between urban and rural residents (Saidi et al., 2018; Solér et al., 2020). In order to meet the requirements of high-quality economic development, it is clear that increasing public service expenditure can effectively promote consumption. In addition, the continuous optimization of public services, such as public social welfare services (Guo et al., 2019; Verheire et al., 2018), public transport (Li et al., 2019; Mugion et al., 2018; Shen et al., 2018), public medical and health services (Bradley et al., 2016; Cosgrave, 2020; Guo et al., 2018), and public basic education services (Cruden et al., 2016; De Witte et al., 2020; Yang et al., 2015; Zhang et al., 2020), can provide residents with life security and improve income redistribution and residents’ living standards, thus promoting consumption and reducing China’s Gini coefficient (Abdiyanto, 2019; Li et al., 2017; Zhang & Zhang, 2004). Some scholars believe that unreasonable interest rates and taxation policies, especially consumption tax, will lead to productive public expenditures and suppress household consumption (Dong et al., 2020; Lv & Mao, 2014; Esser et al., 2016), and it will further affect economic growth and development by influencing private investment (Awad et al., 2021). Therefore, in order to optimize economic structure and improve the efficiency of resource allocation, it is necessary to adjust China’s traditional investment-driven model to one driven by consumption and domestic demand (Jia & Gu, 2019; Shi, 2019; Tao et al., 2017; Wang et al., 2016).
Studies over the past two decades have provided important information on the causes of high investment and low consumption in China, for example, fiscal-based public service expenditures and policies. Most studies in this field have only focused on empirical testing of time series data at the national level. A limited number of studies have analyzed panel data to investigate the impact of equalization of public services on the ratio of investment to consumption. With this background, the specific objective of this study was to explore the relationship between public services equalization and ratio of investment to consumption at different scales. This study evaluated the level of equalization of public services at the provincial level. Then, the regional disparities of the ratio of investment to consumption were investigated. Finally, econometric models were constructed to analyze the effect of equalization of public services on the ratio of investment to consumption using interprovincial panel data.
Materials and Methods
Evaluation of the Equalization of Public Services
Before empirical testing, it is necessary to measure the level of equalization of public services for each province (i.e., municipalities and autonomous regions) in China, except Tibet, Taiwan, Hong Kong, and Macao because of data unavailability. An index system is essential for the evaluation of the equalization of public services, so a critical task is to generate an index system scientifically and reasonably. Based on China’s “13th Five-Year Plan for Promoting Equalization of Basic Public Services,” the national list of basic public services includes public education, employment and entrepreneurship, social insurance, health care, social services, housing security, public culture and sports, and services for people with disabilities. Considering the continuous validity of indicator data, this study does not cover all the contents of the basic public service list, and finally establishes the evaluation system of the level of equalization of public services from seven evaluation criteria including infrastructure, environmental protection, public education, health care, welfare security, cultural services, and communication services. A total of 24 specific indicators were selected from the above seven aspects with reference to the selection criteria of specific indicators by related scholars (Han & Li, 2019; Li et al., 2017). Therefore, an evaluation index system was generated with 24 evaluation indicators (Table 1).
Index System for Evaluating the Equalization of Public Services at the Provincial Level in China.

After the construction of the index system, we determined the weight for each evaluation index. In order to avoid subjectivity in the process of determining weights, the entropy method was used to calculate the weights of 24 evaluation indicators. The steps of calculating weights by the entropy method are as follows:
First, given r years, n provinces, and m indexes, xθij is the jth index value of province i in year θ.
Next, indicators are transformed into scores between 0 and 1 with standardization methods because of different dimensions and units for indicators.
Standardization of positive indicators:

Standardization of negative indicators:

Then, the proportion of the index value in the jth year of the i:

Then, calculate the information entropy of the jth indicator:

Then, calculate the jth index information entropy redundancy:

The index weights:

Finally, index scores of provinces:

As shown in Table 1, among the seven areas covered by the equalization evaluation of public services, the proportion of infrastructure and welfare security is relatively high, 0.273 and 0.266, respectively, whereas the proportion of environmental protection is relatively low, equal to 0.025. In the overall evaluation of equalization of public services, the proportion of domestic water consumption is relatively high at 0.072, and the proportion of wastewater is relatively small at 0.013.
In total, 150 samples were associated with the remaining 30 provinces of China, except Tibet, Taiwan, Macau, and Hong Kong, from 2013 to 2017, including the ratio of investment to consumption, equalization level of public services, fiscal decentralization, and degree of industrialization. The data for calculating equalization of public services, ratio of investment to consumption, fiscal decentralization, and degree of industrialization in this study are all from the China Statistical Yearbook for the period 2014 to 2018. The basic descriptive statistics of the 24 indexes for evaluating the equalization of public services are shown in Table 2.
Descriptive Statistics of the Indexes for Evaluating the Equalization of Public Services in China.
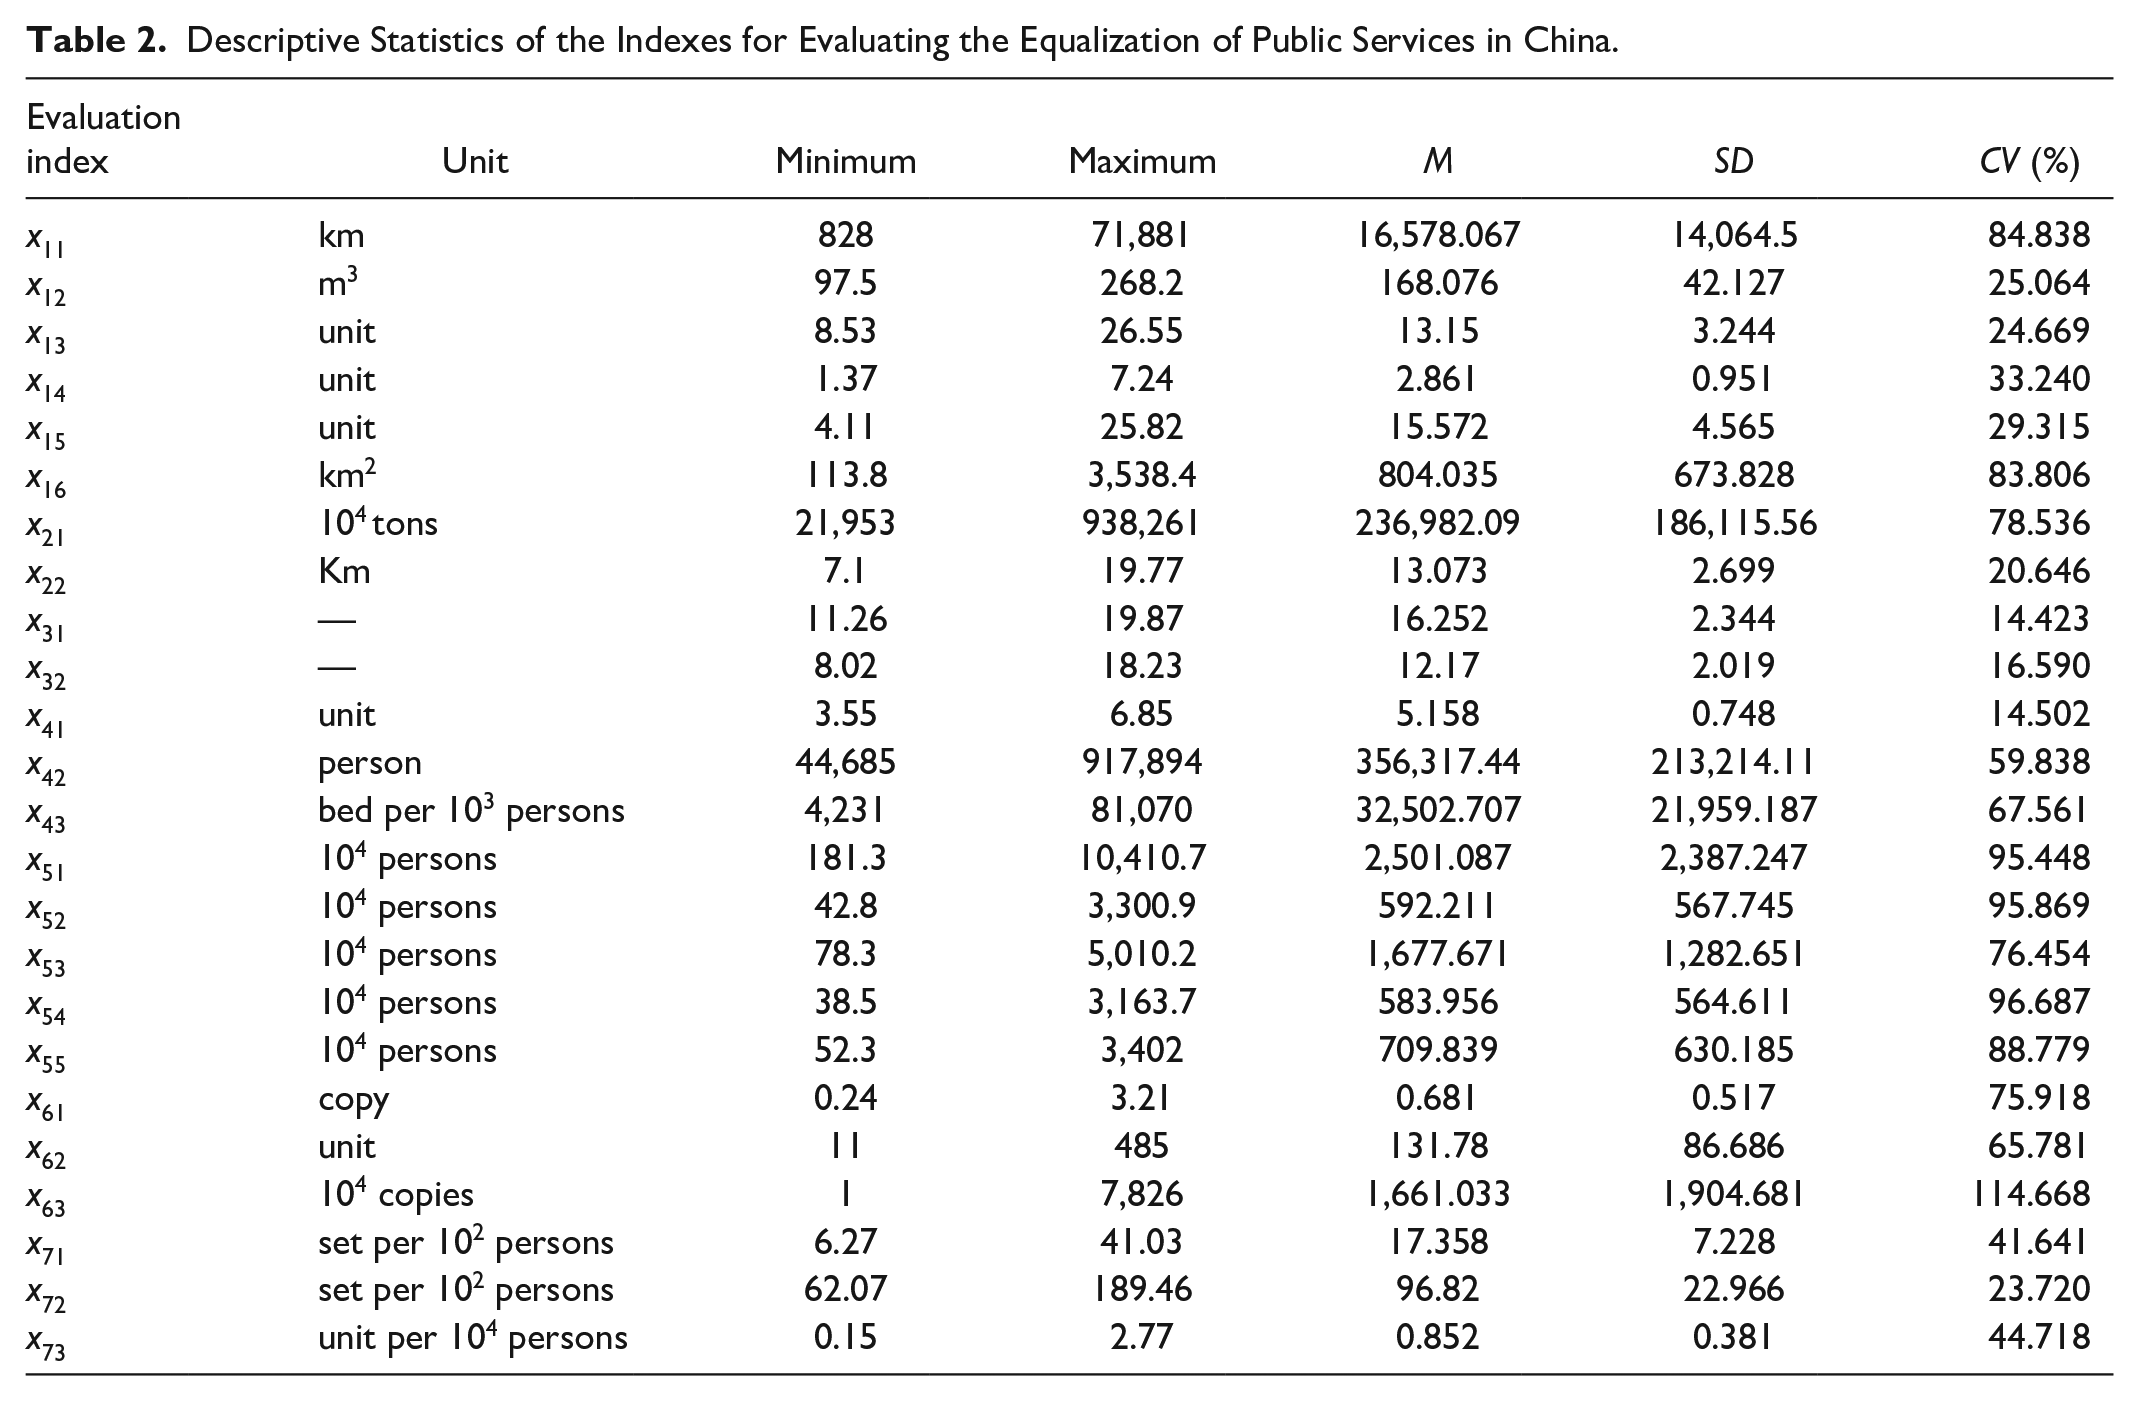
Table 2 shows that the coefficient of variation of the index of Children’s Book Collection is the largest, which indicates that children’s education has improved significantly during the study year. The coefficients of variation of medical insurance, unemployment insurance, and pension insurance are all higher than 90%, indicating that China has invested substantially in public social welfare and the achievements in the construction of the welfare security system are significant.
Global Spatial Autocorrelation
Global Moran’s I is a classic index for exploring spatial autocorrelation. It is mainly used to measure the spatial similarity of elements as a whole (Hu & Zhang, 2020). In this study, Moran’s I was used to describe the similarity of the level of equalization of public services in spatial distribution pattern, that is, spatial autocorrelation. The spatial correlation of the level of equalization of public services in China can be measured by the Global Moran’s I index (Yu, 2012). The formula of Global Moran’s I is as follows:

where n is the number of research units; xi and xj are the attribute values of research units i and j; respectively, s2 is the variance of the score value; wij is the spatial weight between the ith and jth points of the spatial units. The range fof Global Moran’s I index is range from −1 to 1. The index of the variable greater than 0 shows a positive spatial correlation; if it is less than 0, it presents that there is a negative correlation; if it is equal to 0, it presents that there is no correlation.
Cold/Hot Spots Analysis
The Gets-Ord General G index is mainly used to explore the existence of spatial clustering phenomenon. The Gets-Ord Gi* index is an optimization of Gets-Ord coordination and weighing General G. It can be used to analyze the spatial aggregation degree of element values. In this paper, the Gi* index is used to judge the degree of spatial aggregation of the level of equalization of public services in China, that is, to identify the spatial distribution pattern of the “hot spots” and “cold spots” of ecosystem service functions (Gimona & van der Horst, 2007). The calculation formula of Gets-Ord Gi* index is as follows:
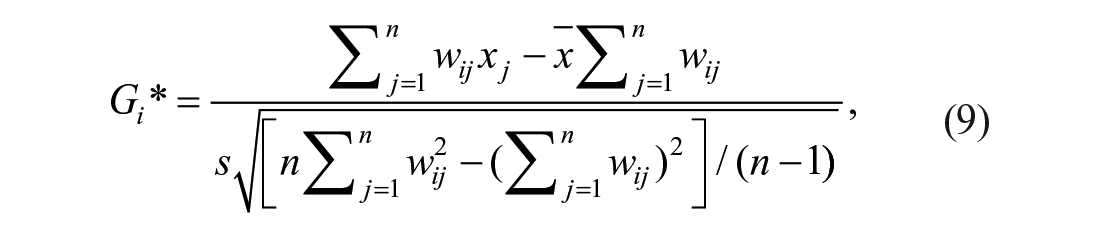
where xj is the level of equalization of public services of jth point of the spatial units in China; wij is the spatial weight between the ith and jth points of the spatial units.
Econometric Model
In this study, the main aim was to explore the inherent impact of the level of equalization of public services on the ratio of investment to consumption in China, so as to accordingly propose an effective path for optimizing China’s current high investment and low consumption pattern. Because the data used was short panel data with a span of 5 years, the interference items were considered to be independent and equally distributed, and the regression model of the cluster standard errors was selected.
The ratio of investment to consumption (IC) was used as the explained variable. The total social investment is equal to the total capital investment minus the budget, and the total social consumption was represented by the household consumption. The seven evaluation criteria of the level of equalization of public services, that is, Infrastructure (In), Environmental protection (EP), Public education (PE), Health care (HC), Welfare guarantee (WG), Cultural service (CS1), and Communication service (CS2), were used as the core explanatory variables. Its measurement results are shown in the preceding discussion.
For the control variables selection, we refer to the results of related scholars’ studies (He et al., 2017; Lv & Mao, 2014). According to the China New Urbanization Report 2012 released by the Chinese Academy of Sciences, China’s urbanization rate has exceeded 50%. However, the urbanization rate is generally classified between 40% and 50% in exam-oriented education. At the same time, considering that China has undergone a longer period of reform and opening up and has become the second largest economy in the world, the economic growth rate may not be significant. For this reason, urbanization indicators, urban-rural income disparity indicators, and economic growth rate indicators are not included in the control variables in this study. In addition, the degree of economic openness for a country has a positive impact on the level of investment, while the Gini coefficient is also an effective measure to help picture income inequality around the study area. Finally, the indicators of fiscal decentralization (Fisdec), industrialization degree (Industry), Gini coefficient (GINI), and economic openness (FDI) were selected as control variables.
Fisdec, the fiscal decentralization indicator, was expressed in terms of the proportion of fiscal expenditure per capita in each provincial region in the current year:

Fisdecit represents the fiscal decentralization level of the ith province in year t; Pfisit represents the budgetary expenditure of the current per capita level of the ith province in year t; and Cfisit represents the budgetary expenditure of the central per capita level of the ith province in year t. Industry, the degree of industrialization indicator, is expressed by the ratio of secondary output to GDP. Gini, the degree of Gini coefficient indicator, is expressed by a measure of the inequality of the incomes with the Lorenz curve. FDI, the degree of economic openness indicator, is expressed by the ratio of total import and export to GDP.
Based on the theoretical analysis presented above, this paper assumes that the public service equalization level is the core explanatory variable and the ratio of investment to consumption (IC) is the explained variable. The following panel measurement model was established:
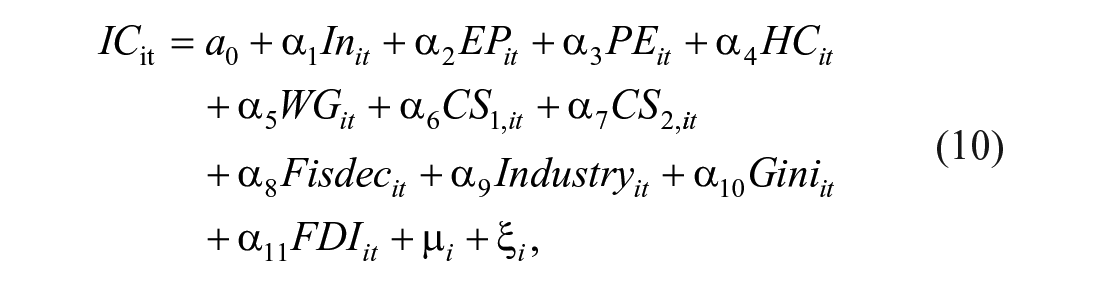
where t represents time, i represents province, a0 represents the constant term, ICit represents the ratio of investment to consumption of province i in year t, EPSit represents the equalization of public service of province i in year t, Industryit represents the degree of industrialization of province i in year t, ui is the individual random effect, and εit is the random interference term.
Results and Discussion
Equalization of Public Services by Provincial Regions in China
Using the above index system, the levels of equalization of public services were calculated for the remaining 30 provincial regions from 2013 to 2017. The level of equalization of public services for the study area in 2013 and 2017 is shown in Figure 1. It can be seen that the level of equalization of public services in China has increased more significantly from 2013 to 2017, with the low level areas in 2013 roughly distributed to the left of the Hu line. Areas with high level of equalization of public service are mainly concentrated in coastal cities.

The levels of equalization of public services in 2013 and 2017.
Next, the Moran’s I indexes and Gi* indexes were calculated by ArcGIS 10.6 software (Table 3 and Figure 2). As shown in Table 3, the Moran I indices for the level of equalization of public services during the study years are all greater than 0, but they are all smaller and none passed the significance test. This indicates that the spatial distribution of the level of equalization of public services in the study years has some positive spatial autocorrelation but has a dispersed spatial pattern.
The EPS in China Moran’s I Spatial Autocorrelation Index.

Note. EPS = equalization of public services.
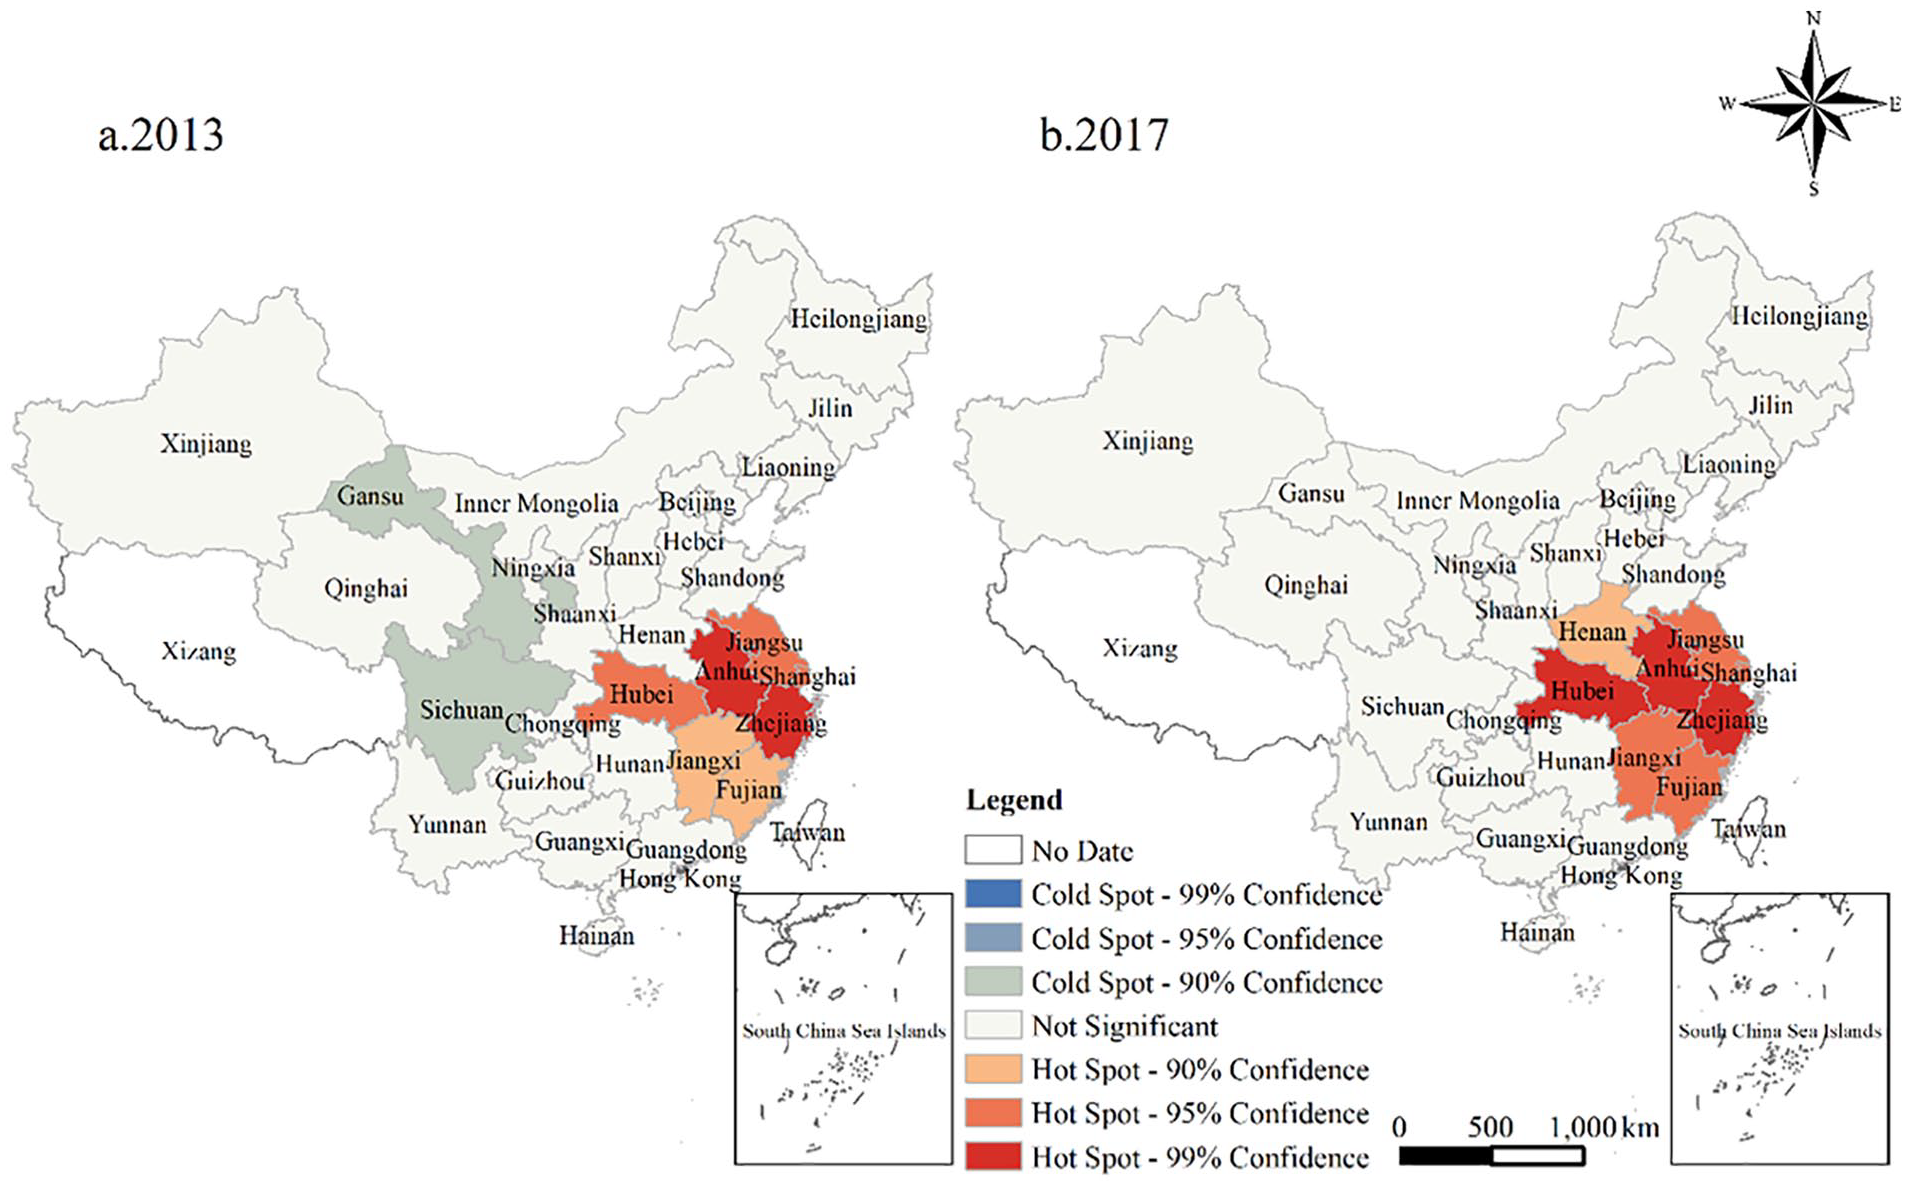
Distribution of the level of equalization of public services in 2013 and 2017 based on Gi* index.
As shown in Figure 2, the hot spots of the level of equalization of public services in 2013 and 2017 are concentrated in the eastern coastal cities. The levels of equalization of public services showed cold spots only in 2013 and was concentrated in the western region.
In addition, in order to reveal more clearly the regional differences in China’s public services, the levels of equalization of public services were converted into relative values according to the provincial average. Specifically, we divided the public service level of each province by the average public service level of China and converted it into a relative value. A relative value of more than 1.0 indicates that the level of public service equalization is above the national average and a value of less than 1.0 indicates that the level of public service equalization is below the national average. We further explored the regional differences in the level of equalization of public services in China in the context of the division of the four major economic zones of China by the National Bureau of Statistics of China, namely eastern region, central region, western region, and northeastern region. The eastern region comprises Beijing, Tianjin, Hebei, Shanghai, Jiangsu, Zhejiang, Fujian, Shandong, Guangdong, and Hainan, that is, a total of 10 provinces. The central region comprises Shanxi, Anhui, Jiangxi, Henan, Hubei, and Hunan, that is, a total of six provinces. The western region comprises Inner Mongolia, Guangxi, Chongqing, Sichuan, Guizhou, Yunnan, Shaanxi, Gansu, Qinghai, Ningxia, and Xinjiang, that is, a total of 11 provinces. The northeast region comprises Liaoning, Jilin, and Heilongjiang, that is, a total of three provinces.
Figure 3 shows the trend of the level of equalization of public services in various regions over time. There are significant differences in the relative levels of provincial public service supply in China, which indicates that the level of equalization of public services in China is low, similar to previously reported results (Liao, 2017; Song et al., 2017; Wang & Chen, 2020). The relatively high level of public services in China’s relatively developed regions, such as Beijing, Hebei, Shanghai, Jiangsu, Zhejiang, Shandong, Henan, Hunan, Guangdong, and other provinces, are above the average of 1.0. The relative levels of equalization of public services in Guangdong, Zhejiang, and Jiangsu are significantly higher than other provinces. The levels of equalization of public services in all provinces are generally on the rise. It is worth noting that Sichuan was the only province in the western region that had a high relative level of equalization of public services, amounting to more than 1.0. The main reason is that local governments at all levels in Sichuan have made great efforts in improving the provision of public services in recent years. Finally, for the remote province of Xinjiang in the western region, the relative level of public service equalization was 0.984. This is higher than most provinces in the central, western, and northeastern regions and even a few provinces in the eastern region. These results suggest that the improvement of the level of public services depends not only on the level of regional economic development but also on effective local policies (Pratt & Warner, 2018).

Values and average values of relative levels of equalization of public services by provincial regions in China.

Values and average values of equalization of public services by regions in China.
The level of equalization of public services for each economic zone was converted into the average value of the relative level (Figure 4). From Figure 4, the annual average value of the eastern region is significantly higher than the average of 1.0, followed by the northeastern, central, and western regions. This further indicates that there are significant differences in the relative levels of public service supply in China owing to the differences in economic development levels and differences in resources and environment.
Regional Disparities of the Ratio of Investment to Consumption in China
Using the above calculation methods, the ratio of investment to consumption and annual averages of the remaining 30 provincial regions in China from 2013 to 2017 were estimated. The standard errors of the ratio of investment to consumption were also calculated to test the credibility of the values (Figure 5).
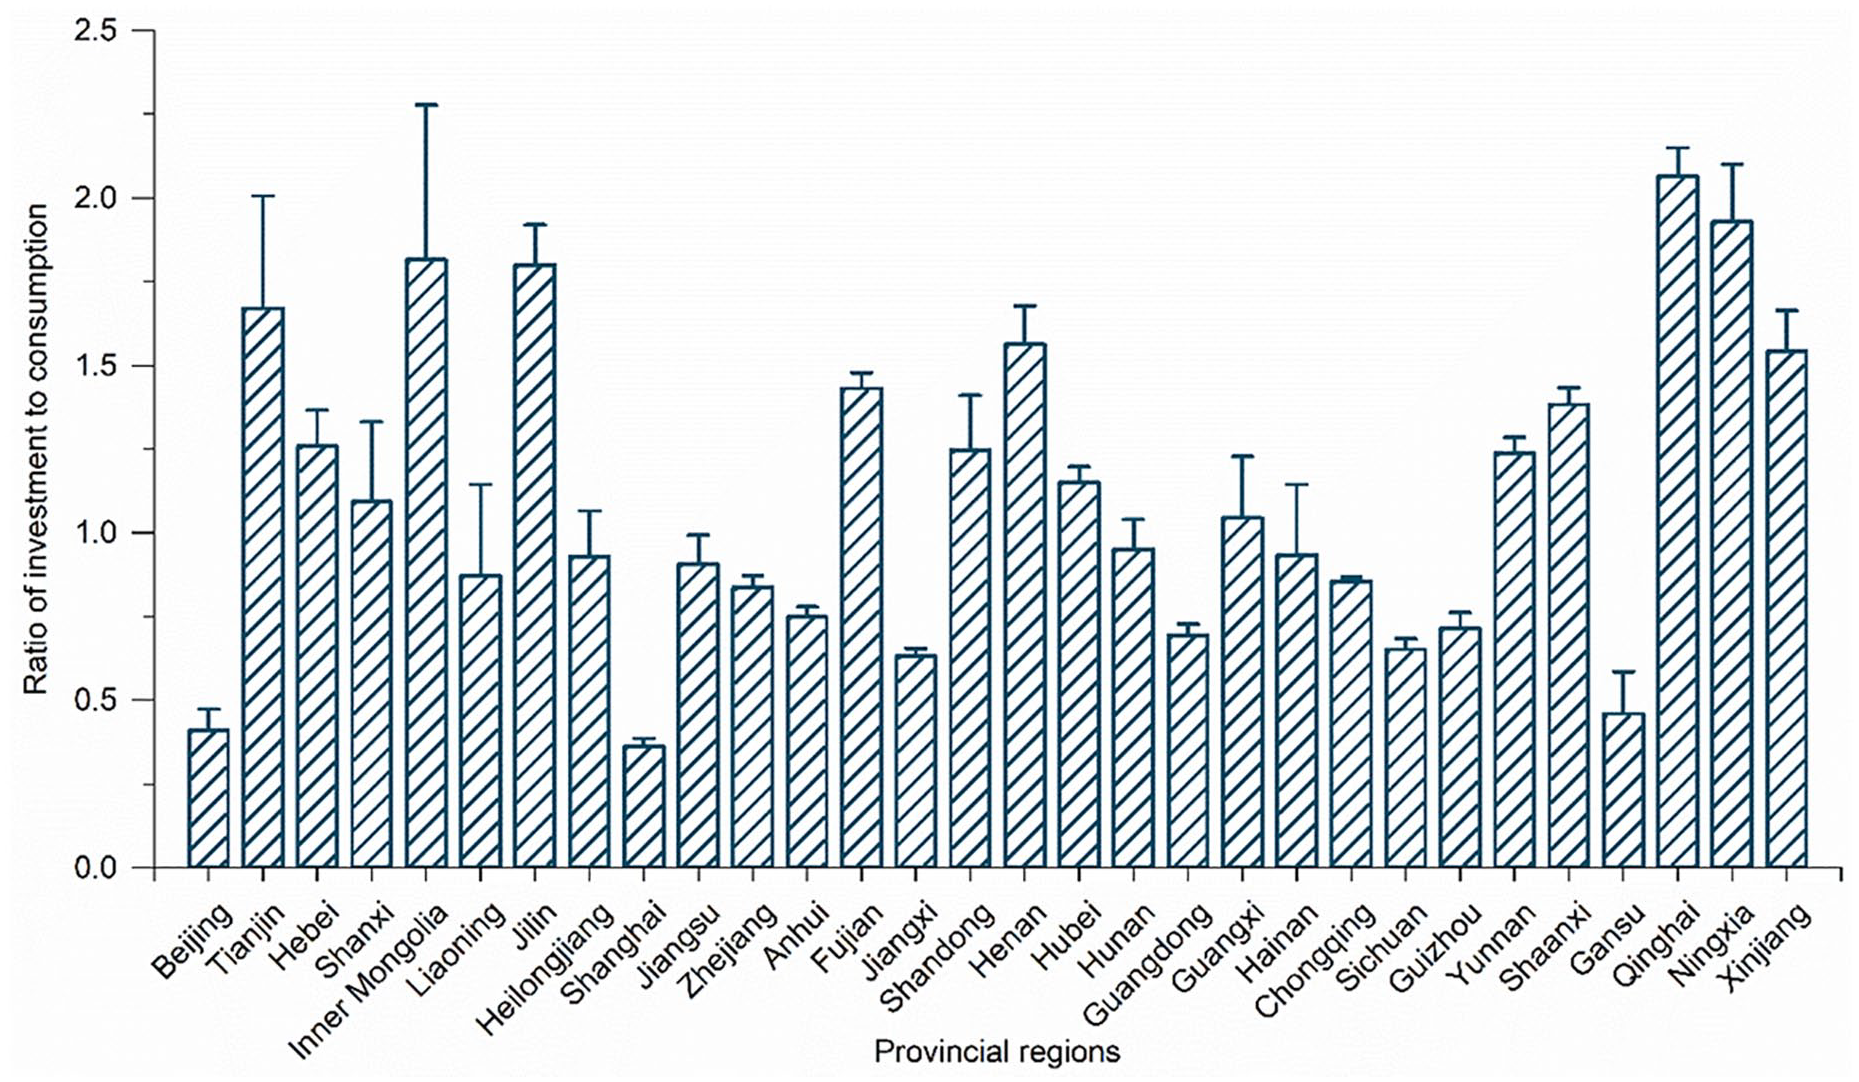
Provincial disparities in the ratio of investment to consumption in China. Vertical bars represent the standard error.
Similarly, the above method was used to estimate the ratio of investment to consumption, annual average value, and standard error for the eastern, central, western, and northeastern regions from 2013 to 2017 (Figure 6).

Economic regional disparities in the ratio of investment to consumption in China. Vertical bars represent the standard error.
It can be seen from Figure 5 that there is a significant difference in China’s ratio of investment to consumption and that China’s high investment and low consumption are becoming more serious. We can also observe that China’s developed provinces generally have a lower ratio of investment to consumption, such as Beijing, Shanghai, and Guangdong, whereas those with less developed economies generally have a higher ratio of investment to consumption, such as Qinghai, Inner Mongolia, Ningxia, and Xinjiang. Interestingly, the ratio of investment to consumption of Gansu was observed to be lower than that of Guangdong. This may be due to Gansu’s weak ability to attract investment together with its remote geographical location and natural resource restrictions. As a municipality adjacent to Beijing, although Tianjin has a better geographical location than other provinces, its ratio of investment to consumption is higher than most provinces. The reason for this may be the radiation effect of the capital’s economy on Tianjin. Fortunately, the ratio of investment to consumption in all provinces in China declined from 2013 to 2017.
Figure 6 shows that the ratio of investment to consumption in the northeast region is higher than that of the eastern and central regions, but the difference between the three regions is not stark. However, the ratio of investment to consumption in the western region is significantly higher than the other three regions. This may be due to China’s implementation of the western development strategy resulting in an increase in investment in the western region. The ratio of investment to consumption in the four major economic zones has declined over time, which indicates that China’s high investment and low consumption have been alleviated on a regional scale.
Effects of the Equalization of Public Services on the Ratio of Investment to Consumption
Based on the above results, econometric models were constructed to further analyze the effect of the seven evaluation criteria of equalization of public services on the regional disparities in the ratio of investment to consumption in China. Then, for the result of the Hausman test, the P-value was 0.471. Therefore, the null hypothesis was not rejected and the random effects model was chosen. To eliminate the problems of heteroscedasticity, a random utility regression model with clustered standard errors was adopted in this study. Provincial panel data of China for the period 2013 to 2017 was used to run the models.
Based on the econometric models, the impacts of the seven evaluation criteria of equalization of public services on the ratio of investment to consumption were investigated on the regional and national scales. The results are shown in Table 4.
Regression Results of Investment to Consumption Ratio and Public Service Equalization From 2013 to 2017.

Note. The value of the t statistic is in parentheses.
p, **p, and ***p mean significance level of 10%, 5%, and 1%, respectively.
In M1, the analysis scope includes 30 provinces in China mentioned above. The public education of the level of equalization of public services is negatively correlated with the ratio of investment to consumption is statistically significant at the level of 5%. This indicates that the improvement of public education to promote the level of equalization of public services will help to optimize balance between investment and consumption in China, and it has a significant effect on the ratio of investment to consumption. This is similar to the research conclusions of related studies (Chan et al., 2016; Li et al., 2017). Accordingly, there will be a reduction in the ratio of investment to consumption. With respect to the control variables, fiscal decentralization is positively correlated with the ratio of investment to consumption and is statistically significant at the level of 1%. This shows that fiscal decentralization will also lead to an increase in the ratio of investment to consumption. The degree of industrialization has a positive correlation with the ratio of investment to consumption is statistically significant at the level of 1%. This is because increase in the degree of industrialization will prompt enterprises to expand the scale of investment, thereby increasing the ratio of investment to consumption. The Gini coefficient has a negative correlation with the ratio of investment to consumption at the significance level of 1%.
In models M2 to M5, the analysis scope is limited to the eastern, central, western, and northeastern regions, respectively. The results of the eastern region show that public education has a positive correlation with the ratio of investment to consumption is statistically significant at the level of 5%, which is consistent with the results of M1. In addition, infrastructure has a positive correlation with the ratio of investment to consumption is statistically significant at the level of 1%. Environmental protection is positively correlated with the ratio of investment to consumption, cultural service is negatively correlated with the ratio of investment to consumption, and both are statistically significant at the level of 5%. Different from the previous report (Ren et al., 2020), this further indicates that improvement of the level of equalization of public services in the eastern region can effectively reduce the ratio of investment to consumption. The results in the central region show that public education and welfare guarantee are negatively correlated with the ratio of investment to consumption, and they are significant at the levels of 1% and 5%, respectively. Health care and cultural service are negatively correlated with the ratio of investment to consumption, which both are statistically significant at the level of 1%. The results for the western region show that the ratio of investment to consumption was positively correlated with the infrastructure of the level of equalization of public services and negatively correlated with the health care of the level of equalization of public services, and both are statistically significant at the level of 1%. These results indicate that the effect of the indicators in the western region on the ratio of investment to consumption is of practical significance. The reason for this is relative underdevelopment of the economy and insufficient regional investment in the western region. Therefore, in accordance with previous research (Shiu et al., 2016), a new round of western development should be carried out to improve infrastructure construction in order to obtain more investment. However, the seven criteria of equalization of public services in northeast region are not statistically significant with the ratio of investment to consumption.
In terms of the control variables, except central regions, fiscal decentralization is positively correlated with the ratio of investment to consumption in other regions. Fiscal decentralization is statistically significant at the level of 1% in the western region and is statistically significant at the level of 10% in the northeastern region. It is not statistically significant in the eastern and central regions. The coefficient in the northeastern region is several times than western region. These results indicate that fiscal decentralization policy is critical for the currently relatively underdeveloped western and northeastern regions. Compared with Wei et al. (2019), this further indicates that the fiscal decentralization policy is of vital importance to the ratio of investment to consumption in China. The degree of industrialization is positively correlated with the ratio of investment to consumption in all regions and is statistically significant at the level of 1% in the eastern and western regions, which is consistent with the results of M1. This result further indicates that as the degree of China’s industrialization increases, the investment scale increases. Therefore, it is necessary to target a reasonable investment scale to adjust the ratio of investment to consumption in China (Bekele et al., 2020). The Gini coefficients are negatively correlated at a significant level of 1% in the eastern region, and positively correlated at a significant level of 5% in the northeastern region. Economic openness is only negatively correlated in the western region at a significant level of 1%. This result indicates that the western region needs to further expand economic opening in order to promote a reduction in the ratio of investment to consumption.
The results for each economic zone show that the level of equalization of public services, fiscal decentralization, degree of industrialization, Gini coefficient, and economic openness have different effects on the ratio of investment to consumption in different regions. There are cross-regional differences in the impact on the ratio of investment to consumption. Continuous implementation of reasonable and effective policies is conducive to achieving a balance between high investment and low consumption in various regions.
Conclusions
Insufficient level of equalization of public services and a high ratio of investment to consumption have been two typical features of the Chinese economy for a long time. In order to examine the relationship between the two, this paper measured the level of equalization of public services for each province (municipalities and autonomous regions) in China, except Tibet, Taiwan, Hong Kong, and Macao, from 2013 to 2017. Based on the evaluation results, econometric models were constructed to further analyze the effect of the seven criteria of equalization of public services on the regional disparities in the ratio of investment to consumption in China from the regional and national scales, respectively.
The main findings are summarized as follows: (1) The level of equalization of public services for each province shows an increasing trend from 2013 to 2017 except for some provinces in western China, but there are still large regional differences. (2) Except for the northeast region, the equalization of public services in different dimensions can significantly optimize the ratio of investment to consumption in China. (3) Fiscal decentralization will significantly increase the ratio of investment to consumption, and it will be more obvious in the western and northeastern regions. The higher the degree of industrialization will increase the ratio of investment to consumption in China. The Gini coefficient will significantly affect the ratio of investment to consumption, but the effect is opposite in the northeast and eastern regions.
Based on the above conclusions, we suggest some reasonable and effective policy considerations. First, the overall level of equalization of public services in China should be improved as soon as possible, and the inter-regional gaps should be narrowed, especially for infrastructure and social welfare. The government should further improve the social security system by comprehensively establishing basic endowment insurance system and basic medical insurance system for urban and rural residents. Second, China should pay more attention to public education in order to more effectively optimize the ratio of investment to consumption. Since education is an important factor affecting income disparity, effective policies should be formulated to increase support for compulsory education and even higher education, so that children of low and middle income families can receive secondary education and higher education. Finally, the central government should promote the transformation of China’s economic growth mode from investment-driven to consumption-driven through top-level policy design and a series of supporting measures. Especially, the central government should consider the actual situation in the different evaluation criteria for the equalization of public services in various regions, with a view to further optimizing the ratio of investment to consumption.
Footnotes
Declaration of Conflicting Interests
The author(s) declared no potential conflicts of interest with respect to the research, authorship, and/or publication of this article.
Funding
The author(s) disclosed receipt of the following financial support for the research, authorship, and/or publication of this article: This work was supported by the Social Science Planning Fund of Chongqing under Grant (2021NDYB046), Humanities and Social Sciences Research Project of Chongqing Municipal Education Commission under Grant (16SKGH096), Chongqing Municipal Natural Science Foundation under Grant (cstc2018jcyjAX0497), and the Postgraduate Innovation Research Foundation of Chongqing Technology and Business University (No. yjscxx2021-112-72).