
Abstract
Inclusive green growth (IGG) fosters enduring advancement, particularly in less developed regions. This study constructs a reasonable evaluation system, analyzing panel data spanning 2010 to 2021, to measure the IGG in China’s old revolutionary base areas. By employing quantitative methods such as entropy weights, kernel density estimation, the Theil index, and convergence analysis, this study investigates the spatiotemporal disparities in and the evolutionary trends of IGG. Results reveal a consistent increase in the level of holistic IGG level, with a reduced concentration in its distribution. However, significant disparities persist across the regions, with the ecological well-being subsystem exhibiting notable volatility, particularly in the Dabie Mountain and Left and Right Rivers areas. The key findings include overall growth and regional disparities, that is, the IGG metric rose by 30.33% between 2010 and 2021, but regional disparities widened. Although the economic development and social equity subsystems show progressive improvement, the ecological well-being subsystem experienced significant fluctuations, which underscores the persistent environmental challenges. Targeted interventions are needed to address regional disparities, enhance ecological resilience, and promote balanced development. This study offers crucial perspectives for policymakers pursuing sustainability goals in underdeveloped regions.
Introduction
Defined by the International Monetary Fund (IMF), a model for enduring advancement, inclusive green growth (IGG) aligns developing nations’ prosperity (Spratt & Griffith-Jones, 2013). There’s a growing agreement that IGG is the way to go for sustainable development, as it balances social fairness, strong economic returns, and a stable environment (Wang, Hou, et al., 2022). In the current era of unprecedented transformation, humanity is confronted by a multitude of challenges, encompassing poverty, hunger, inequality, and climate change. Moreover, economic growth in developing nations typically manifests as disparities between regions and urban–rural areas, which may exacerbate social instability and inequity. With the acceleration of economic progress, developing countries are confronted by grave environmental issues, such as water pollution, air pollution, and land degradation, which can harm people’s well-being and life quality and have detrimental implications for sustainable development. The UN General Assembly rolled out the blueprint for “Transforming Our World.” This ambitious plan sets out to tackle the big-ticket items impacting society, the economy, and the planet (United Nations, 2015).
As of 2022, over 700 million people worldwide remain below the poverty line, according to the World Bank data shown in Figure 1. Moreover, The Global Economic Prospects for 2025 underscores that, since 2014, developing economies (excluding China and India) have seen their average per capita income growth lag behind that of wealthy economies by half a percentage point. Annual emissions of fluorinated gases from global industrial processes surged from 928.5 megatons of CO equivalent in 2012 to 1,400 megatons in 2022, as shown in Figure 2. The combined challenges of increasing poverty, diverging economic growth, and rising industrial emissions have severely constrained developing countries’ pursuit of IGG and impeded global progress toward sustainable development. China has achieved relatively rapid economic development; however, its growth relies heavily on resource inputs but ignores green development (Song et al., 2018; Wen & Jiang, 2024). Boosting the advancement of China’s old revolutionary base areas (C-ORBAs) is crucial for bridging internal and regional disparities and offering a roadmap for sustainable growth to other underdeveloped areas.
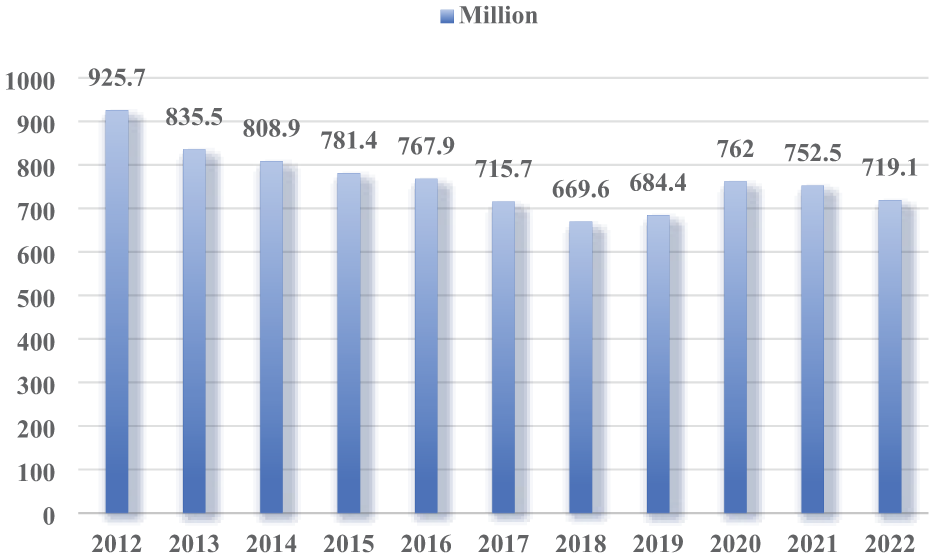
Global poor population.

Fluorinated greenhouse gas emissions from industrial processes.
This study significantly advances the domain of IGG. First, this study expands the concept of IGG in developing nations. By drawing from the ideas of inclusive growth (Klasen, 2010) and green growth (World Bank, 2012) theories, posits that inclusive green growth seeks to foster human liberation and advancement while encouraging a peaceful cohabitation with the natural world. This model champions sustainable development by seamlessly integrating economic, social, and environmental considerations, fostering a virtuous cycle where each element bolsters the others.
Second, this study objectively evaluates the evolutionary trends of IGG in C-ORBAs through the construction of an index system. This study examines the developmental trajectory of IGG within C-ORBAs by establishing a comprehensive assessment framework from four aspects, economic development, social fairness, livelihood security, and ecological well-being. This can provide academic support for effectively evaluating IGG levels in underdeveloped regions around the world.
Third, this study employs diverse techniques to methodically evaluate and analyze the spatial and temporal disparities of IGG in C-ORBAs. This study leverages data acquired through the entropy weight method, the kernel density estimation method, the Theil Index, the coefficient of variation, sigma convergence, beta convergence, and ArcGIS, to delve into the temporal shifts in the indices of IGG subsystems and to identify spatial disparities both within and across the old revolutionary base areas and their corresponding prefectural cities. This offers conceptual backing to narrow disparities in worldwide underdeveloped regional growth.
This study is structured as follows: Section “Literature Review” offers a critical review of existing literature, section “Research Design” describes the estimation model, section “Results Analysis” discusses key findings, and section “Conclusion and Implications” concludes with insights and recommendations. Figure 3 depicts the research framework.

Research framework.
Literature Review
Various international bodies have provided definitions for IGG. At the Rio + 20 summit in 2012, the idea was first floated with the aim of aligning the economic prosperity of developed countries with the sustainable and equitable growth of developing nations (Cao, 2022). Main debates on the meaning of IGG are commonly split into two perspectives. From an economic development perspective, inclusive green growth is viewed as an enduring advancement strategy. The World Bank’s (2012) definition of inclusive green growth outlines an enduring economic advancement framework that integrates social fairness, ecological conservation, and enduring commerce. The Organization for Economic Co-operation and Development (OECD) views inclusive green growth as a strategic method for countries to preserve inclusiveness and eco-conscious economic advancement (OECD, 2012). According to the United Nations Environment Program (UNEP), inclusive green growth comprises three fundamental pillars: societal, ecological, and financial durability (UNEP, 2011). Meanwhile, the IMF conceptualized IGG as a framework designed to foster sustainable progress through balancing the needs of developing nations (Spratt & Griffith-Jones, 2013). The welfare-economic perspective posits that economic expansion aims to enhance societal welfare. According to Albagoury (2016), IGG can improve the well-being of present and succeeding populations. Bouma used welfare theory to define inclusive green growth and stated that such growth emphasizes trade-offs between growth, greenness, and inclusiveness while considering the welfare growth of present and succeeding populations (Bouma et al., 2015). Berkhout et al. (2018) contended that IGG broadens conventional growth views by integrating the enhancement of poverty alleviation and the well-being of coming generations.
The literature explains the connotation of IGG in detail from different aspects. The majority of previous studies concurs that inclusive green growth necessitates a harmonious equilibrium between the three subsystems of inclusivity, environmental sustainability, and economic expansion (He, Zhou, & Wen, 2024; Sun et al., 2020; Wu & Zhou, 2021). Thus, inclusive green growth represents a natural progression and extension of sustainable development by emphasizing the interdependent relationship between inclusivity, greenness, and growth. A novel developmental model that integrates growth principles into the relationship between growth and inclusivity can enable a considerable number of countries to opt for sustainable development pathways (Sohag et al., 2019; Safitri et al., 2022; Zhang et al., 2022). Owing to the adoption and widespread acceptance of the notion of inclusive green growth, numerous nations perceive it as a long-term strategic approach. Many scholarly investigations classified inclusive green growth into three dimensions, namely, Eco-friendly progress, inclusivity, and equitable greenness (Maji, 2019; Maskin, 2019; Song & Wang, 2018). Some studies examined three layers of inclusive green growth, namely, economic, environmental, and social equality (Jha et al., 2018; Li, Li, et al., 2023). Meanwhile, Sun et al. (2022) considered the four aspects of economic expansion, equitable social opportunity, sustainable production and consumption practices, and environmental protection in constructing an evaluation system index.
Assessing IGG is a significant focus within its research domain. Previous studies employed the subjective weighting method (Albagoury, 2016), the entropy method (Zhou & Wu, 2018), and the entropy TOPSIS method (Jiang et al., 2022) to determine the weights of indicators. Some studies evaluated inclusive green growth efficiency by using an input–output evaluation system based on relative efficiency analysis (Sun et al., 2020). Despite growing rates of IGG expansion in select areas, disparities across regions persistently grow. Spatial and temporal characteristics can be obtained through kernel density estimation (Liu et al., 2021; Li, Zhang, & Lyu, 2023; Sun et al., 2022), and regional differences can be analyzed by using the Theil Index and the Gini coefficient (Xin et al., 2023). Convergence analysis has also been conducted to disclose IGG developmental trends and determine whether backward regions can quickly catch up with leading regions (Chen et al., 2020).
Spatiotemporal variation analysis is vital in IGG studies. Prior research has assessed this growth across China’s eastern, central, and western regions. From 2008 to 2018, Chin’s eastern provinces demonstrated a significantly higher level of IGG compared to other regions. Meanwhile, the midland and occidental provinces exhibited a more pronounced catch-up effect than their counterparts elsewhere (Sun et al., 2022; Wang, Ullah, et al., 2022). Regional differential analysis has been conducted between Chinese provinces. Since 2010, there has been a consistent upward trend in IGG across the board. However, significant disparities exist—not just from 1 year to the next but also between different provinces and regions (Zhou, 2022). Differential analysis has also been performed within cities. Some studies revealed severe internal imbalances within urban clusters, accompanied by widening disparities (Liu et al., 2021). Furthermore, IGG spatiotemporal characteristic analysis has been conducted for specific regions, such as the Asia–Pacific region and Belt and Road countries (Li et al., 2021; Wang, Ullah, et al., 2022).
Although the concept of IGG has gained global recognition, most studies focused on developed or urban regions and thus have left underdeveloped areas underrepresented. Moreover, their analyses largely overlooked the unique challenges faced by less developed regions, such as C-ORBAs. The literature underscores the importance of IGG in addressing regional disparities. However, comprehensive research on how the concept applies to regions with fragile ecological environments, inadequate infrastructure, and institutional inefficiencies is lacking.
Research Design
Background
C-ORBAs are scattered across 1,300 counties (cities and districts) in the 27 provinces, autonomous regions, and centrally administered municipalities. Due to a blend of historical, environmental, and geographical factors, these areas have seen economic growth that lags far behind the national norm, grappling with the issue of uneven and insufficient regional advancement. Such areas have a vast coverage, with many of the regions being located in mountainous and plateau areas and having a fragile overall ecological environment. In addition, the pursuit of development in the past has consumed a large amount of resources, and the green development of C-ORBAs is currently facing many challenges (Wen and Jiang, 2024).
The Chinese government issued the “Opinions of the State Council on Supporting the Revitalization and Development of the Former Central Soviet Areas in Southern Jiangxi and Other Areas” in 2012 to foster reinvigoration and expansion of old revolutionary base areas. Subsequently, the State Council approved the reinvigoration and expansion plans for C-ORBAs in Jiangxi–Fujian–Guangdong, Shaanxi–Gansu–Ningxia, Dabie Mountain, Sichuan–Shaanxi, and the Left and Right Rivers to establish a policy system to gather forces from all sides to support the old revolutionary base areas. The policy system targets difficulties and problems in such areas and promotes their revitalization and development with unprecedented effort. Following the United Nations’ 2016 declaration of updated sustainability targets, the concept of IGG became widely acknowledged. China adopted a development strategy centered around inclusive green growth to reduce poverty, promote social inclusiveness, and improve the ecological environment quality while ensuring sustained economic development in old revolutionary base areas (He, Shi, & Wen, 2024; Liu et al., 2024).
Construction of Indicator System
Some scholars assessed the IGG level by establishing an evaluation system that combines the indicators of certain dimensions, such as economic growth, social equity, sustainable production, and environmental conservation (Albagoury, 2016; Zhou et al., 2018; Wu & Zhou, 2019). This study develops an evaluation framework for IGG in C-ORBAs, grounded in its core theoretical foundations. Grounded in the specific conditions of the regions, this study further distinguishes the concept of inclusiveness as social equity and livelihood security and establishes a four-dimensional structure consisting of economic development, social fairness, livelihood security, and ecological well-being, as shown in Table 1. IGG necessitates economic development as a foundational element, which encompasses quantitative expansion and qualitative enhancement and thus embodies the organic integration of quantity and quality. Social equity serves as the normative orientation of IGG and comprehensively reflects the inclusiveness of economic expansion in terms of opportunity acquisition and procedural justice. Livelihood security is the fundamental objective of IGG, because ensuring basic livelihood is an indispensable requirement for promoting shared prosperity. Meanwhile, ecological well-being represents the core connotation of IGG, because a thriving ecosystem is crucial for sustainable national and societal progress.
Evaluation Indicator System for Inclusive Green Growth (IGG).

Source. Author’s own elaboration.
Research Object
Selection of Research Object
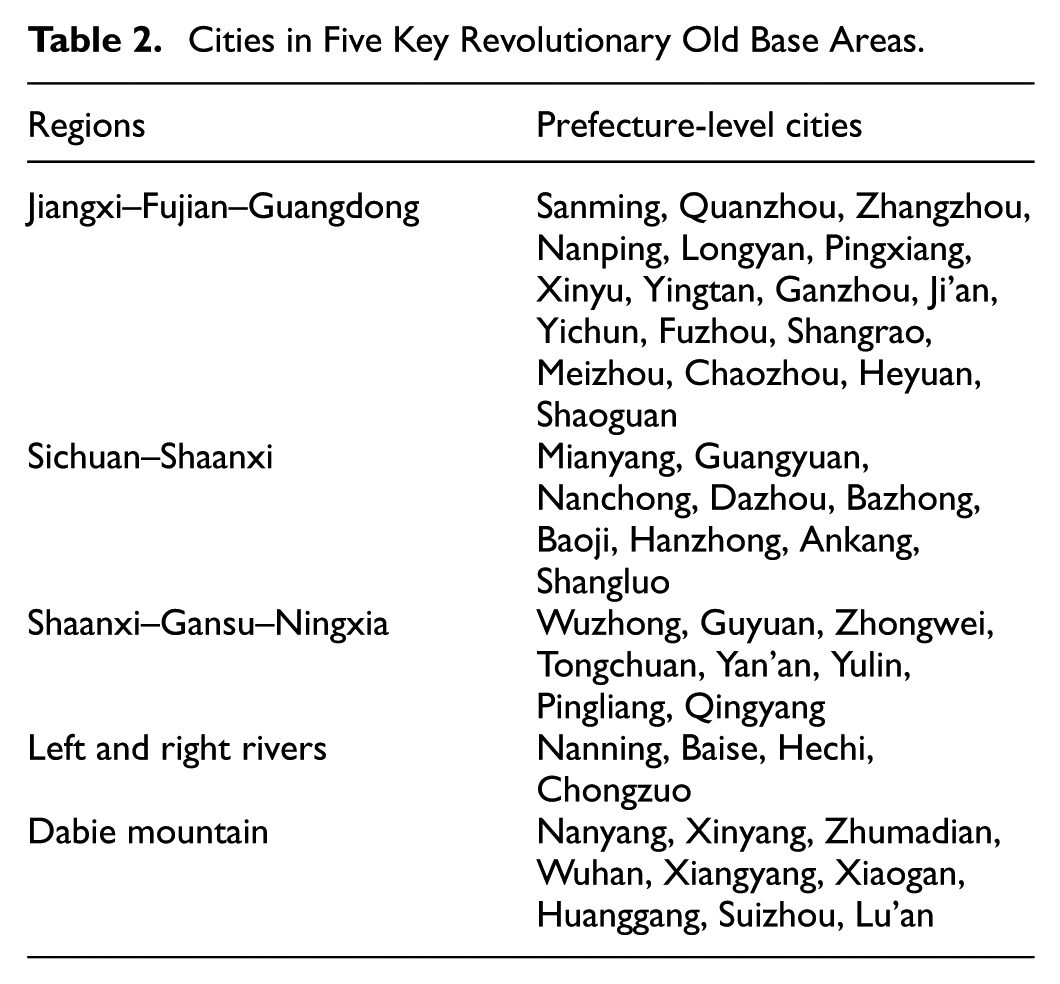
The study focuses on 48 prefectural cities engaged in the rejuvenation and strategic planning for C-ORBAs depicted in Figure 4, namely, the Jiangxi–Fujian–Guangdong, Sichuan–Shaanxi, Shaanxi–Gansu–Ningxia, Left and Right Rivers, and Dabie Mountain. Geographically, the selected cities are located in 11 provinces and autonomous regions across eastern, central, and western China. The inclusion of the cities in the research sample reflects their representativeness and socio-spatial diversity. The sampled old revolutionary base areas face significant challenges in coordinating their environmental, economic, and social development. Thus, a detailed examination of these zones can yield indispensable practical data for the enhancement of IGG within other historically significant regions and broad underdeveloped territories (Table 2).
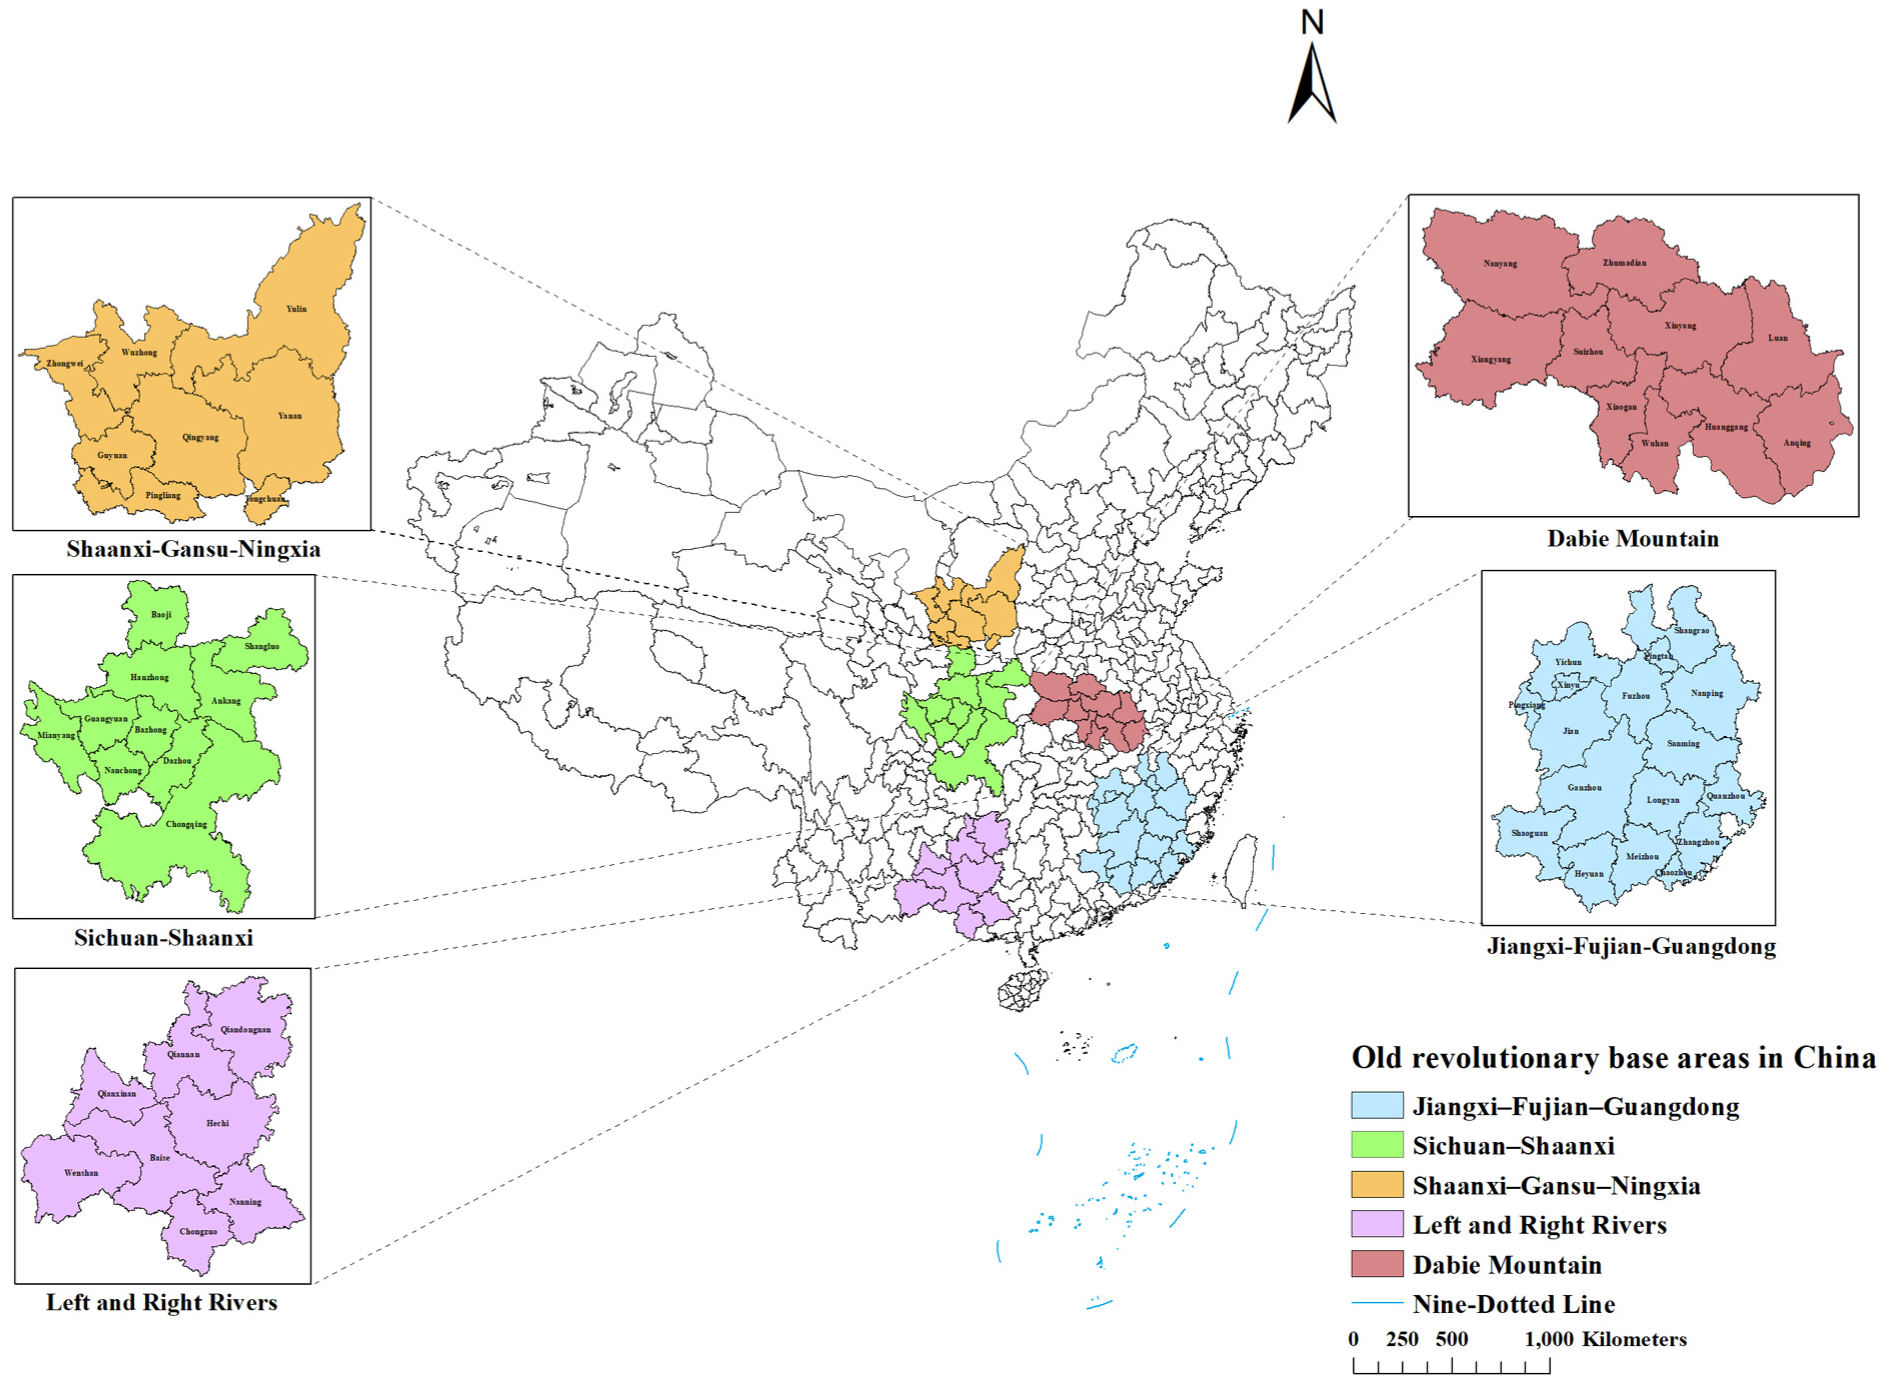
Distribution map of five key old revolutionary base areas.
Cities in Five Key Revolutionary Old Base Areas.
Data Sources
The reinvigoration and expansion plans for the C-ORBAs were issued in 2012, 2014, 2015, and 2016. To get a handle on the broad and specific IGG trends in C-ORBAs, this study has drawn upon panel data spanning from 2010 to 2021, focusing on cities included in their revitalization and development blueprints. Given data availability and the need for up-to-date information, this study excludes the prefecture-level cities that had considerable gaps in their data. This study uses the method of interpolation to supplement some of the missing data and collects the data from the China Urban Statistics Yearbook, the China Regional Economic Statistics Yearbook, provincial and municipal statistical yearbooks, government-issued statistical reports, and the Wind database.
Research Methods
Entropy Weight Method
This study follows specific steps and uses the entropy weight method to assess the comprehensive IGG level in C-ORBAs.
Due to differences in the scale of chosen assessment criteria and the distinction between the positive and negative indicators, this study employs the range normalization technique to standardize the initial dataset. The standardized values of the indicators range from 0 to 1. In the indicator system, urban registered unemployment rate, industrial sulfur dioxide emissions, and industrial wastewater discharge are negative indicators, whereas the remaining indicators are positive. The calculation is as follows:


where
The data of the j-th index of the

where
Then, this study computes each dimension’s entropy, variation coefficient, indicator weights, and regional composite scores using Equations 4 to 7.


Entropy values is
Kernel Density Estimation Method
This study uses kernel density estimation, as a nonparametric estimation method, to examine the distribution, shape, and spread of the IGG levels and subsystems in C-ORBAs. This study employs continuous density curves for the dynamic visualization of the distribution. Let X1, X2, X3, …, Xn be a sample from the continuous population

where
Coefficient of Variation
To discern variations in the IGG of C-ORBAs, this study calculates the coefficient of variation by using the following equation:

where
Theil Index
This study adopts the Theil exponent to calculate and decompose the zonal disparities to clarify the differences in the IGG of C-ORBAs between and within the regions, as follows:


where
Sigma Convergence
Upon analyzing disparities in in the IGG of C-ORBAs, this study further explores whether the average IGG changes over time and hence introduces the sigma (

where
Beta Convergence
The beta (

Equation’s left side depicts IGG score acceleration, and
Results Analysis
Variation Characteristics of Comprehensive Index of Inclusive Green Growth
Temporal Characteristics
The temporal variations in the general proficiency of IGG in C-ORBAs between 2010 and 2021 are presented in Table 3. First, during the period of 2010 to 2021, a consistent and notable upward trajectory can be seen in the integral IGG level in C-ORBAs. This growth is evidenced by the significant increase from .0722 to .0941, which reflects an impressive improvement of 30.33%. Second, the comprehensive IGG level in C-ORBAs demonstrated significant increases during the periods of 2011 to 2014 and 2016 to 2019, with a mean annual increase rate of 6.8% and 5%, respectively. The improvements coincide with key policy implementation phases: the commencement of the 12th 5-Year Environmental Protection Strategy (December 2011) and the release of the Guiding Opinions on Increasing Support for Poverty Alleviation in Old Revolutionary Base Areas by the CPC Central Committee and State Council General Offices (February 2016).
Temporal Changes in IGG.

Kernel Density Variation Trend
This study employs select representative years to illustrate the evolving nature of the holistic IGG index within C-ORBAs by using the kernel density estimation method. The method considers the distribution position, the peak trend, and the spread, as illustrated in Figure 5.

Evolution of inclusive green growth (IGG).
The distribution position of the kernel density curve generally exhibits a rightward shift over the observation period, thereby further validates the enhanced IGG in C-ORBAs. The kernel density plot shows a shift in peak morphology, from a sharp apex to a widened distribution, which indicates a highly dispersed distribution after 2011. The number of peaks is in a unimodal state before 2013, but bimodal distributions emerged, with the main and the side peaks appearing close together after 2013. The findings suggest a reduction in the concentration of comprehensive IGG in C-ORBAs. The comprehensive index for IGG in C-ORBAs shows an elongation in the right tail of the kernel density plot during the study period.
The bimodal pattern reveals an expansion in the disparity of IGG across regions, because the five selected old revolutionary base areas demonstrate significant geographical differences. The high value-added industries are concentrated in eastern China, owing to its proximity to the coast, strong economic foundation, and large investments in public services and environmental governance. By contrast, the sectors in the heartland and the west are mostly limited to solitary, low-value operations where economic bedrock is quite shaky, and the west is characterized by its rugged landscapes and delicate ecosystems. Notably, the eastern region starkly contrasts with the central and western regions, especially when it comes to the state of infrastructure and environmental stewardship. Moreover, high-quality resources continue to flow to the east, which has exacerbated the imbalance in IGG between the regions.
Dynamic Evolution of Subsystem Indices of Inclusive Green Growth
Weights of Subsystems in the Evaluation System
Leveraging scientific and objective principles, this study employs the entropy weight method to ascertain the significance of subsystems and indices within the IGG evaluation framework for C-ORBAs. The weights of the four subsystems are as follows: .3109 for social equity, .3033 for economic development, .2535 for livelihood security, and .1320 for ecological well-being. The social equity and economic development subsystems have a relatively large weight, which indicates their key contribution in driving IGG in C-ORBAs. Among the specific indicators, expenditure on science and technology/GRP, number of public buses per 10,000 people, number of urban workers with old-age insurance, number of university students per 10,000 people, and number of urban workers with basic medical insurance have a relatively large weight exceeding .08. The indicators can affect the whole IGG level and the subsystems in C-ORBAs. Conversely, indicators such as natural gas penetration rate, sewage treatment rate, water usage penetration rate, per unit employment rate in secondary and tertiary industries, industrial sulfur dioxide emissions, rate of harmless treatment of domestic waste, and industrial wastewater discharge have the lowest weights, that is, below .01. The indices have the smallest impact on the overall IGG and its subsystems within C-ORBAs. The weight of the other indicators ranges from .014 to .081.
According to the entropy weight calculation principle, the weight of an indicator is directly proportional to the dispersion present in the original data. C-ORBAs encountered the predicament of being marginalized in terms of policy investment. Their fiscal self-sufficiency is weak, and without economic growth, supporting their social security and ecological improvement would be impossible. Thus, among the four subsystems, social equity and economic development have a relatively large weight.
Temporal Characteristics of Subsystem Indices
This study calculates the subsystem indices of IGG in C-ORBAs by using the entropy weight method. From the perspective of temporal changes in the subsystem indices, apart from ecological well-being, the development of the other subsystems shows annual increases. Moreover, significant trend differences can be seen between the four subsystems, as illustrated in Table 2.
First, the economic development index maintained the highest rank among the indices of the four subsystems from 2017 to 2021 and thus demonstrated robust growth momentum. Second, the social equity index shows an annual increase, with a relatively narrow variation range, and consistently maintains a commendably high rank among the indices of the four subsystems. Third, the livelihood security index demonstrates moderate fluctuations and a sawtooth-like pattern of fluctuations. Fourth, the ecological well-being index exhibits significant fluctuations and experienced a notable decline from 2015 to 2016, followed by an overall trend of rise–decline–rise during the study period.
Such fluctuations are due to the main topographical characteristics of the Left and Right Rivers old revolutionary base area being a karst limestone landform, where the problems of rocky desertification and soil erosion are prominent. The Shaanxi–Gansu–Ningxia old revolutionary base area spans the Loess Plateau, the desert, and the agricultural and pastoral transitional zone, and its terrain is highly fragmented. Furthermore, owing to excessive development and industrial activities, periodic environmental degradation can be seen in the area.
Kernel Density Variation Trend of Subsystem Indices
Kernel density estimation serves as the analytical technique in this research to delve into the shifting patterns of the subsystem indicators within the IGG assessment framework specific to C-ORBAs. Figure 6 depicts the dynamic features of the four subsystems in 2010 and 2021.
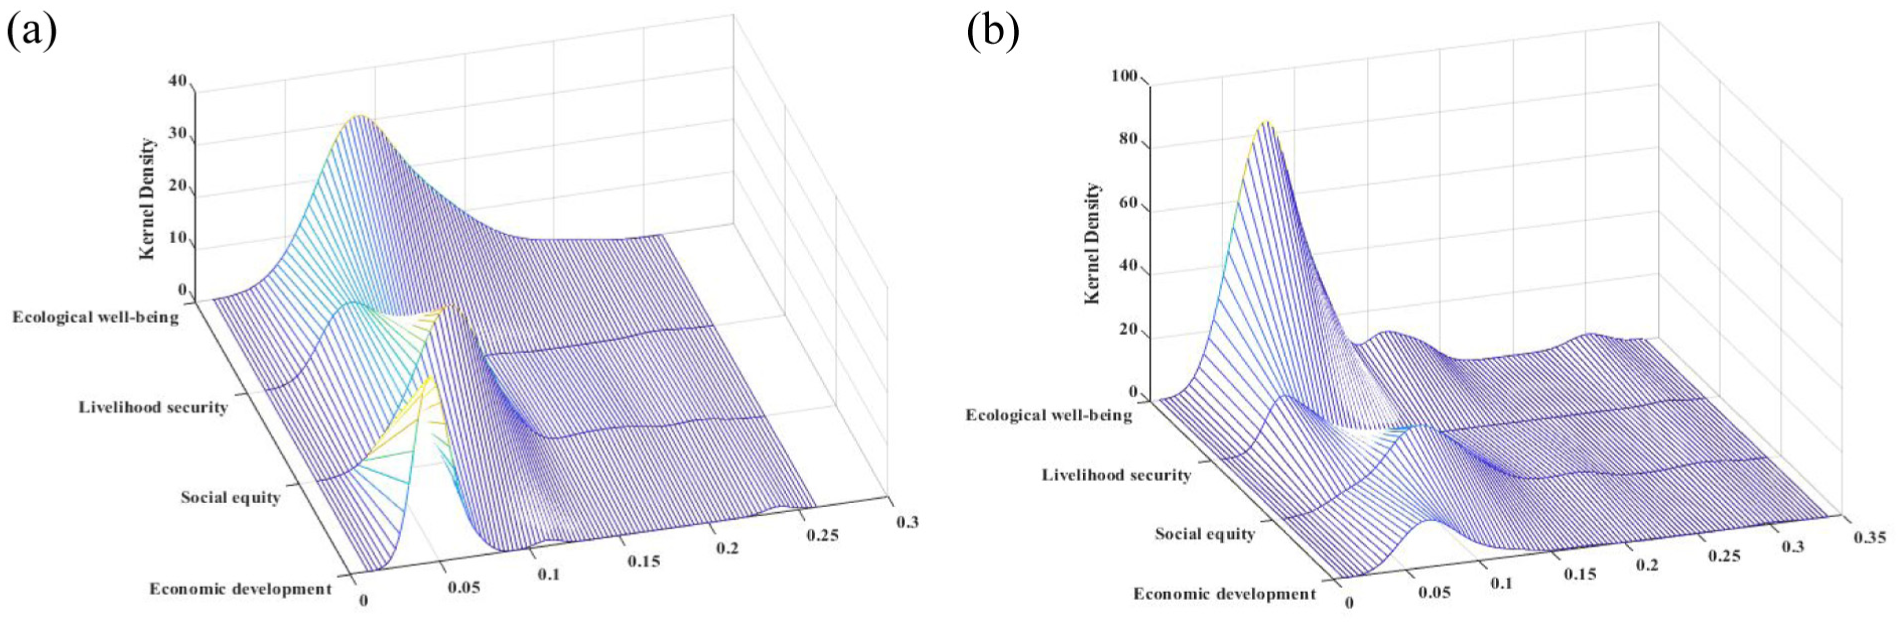
Evolution of subsystem indices of IGG. (a) Subsystem indices in 2010, (b) Subsystem indices in 2021.
The distributional positioning reveals varying degrees of rightward shifts in the subsystem kernel density plots, with the exception of ecological well-being, which indicated the gradual enhancement of IGG in C-ORBAs between 2010 and 2021. In terms of the distribution morphology, the kernel density curves of economic development and social equity exhibit a significant downward trend, whereas those of livelihood security and ecological well-being demonstrate an upward trend, indicating that the IGG subsystems in C-ORBAs demonstrate varying development levels. The peaks of the social equity and ecological well-being subsystems transition from double or multiple peaks to a single peak or weak double peaks, indicating diminishing polarization and decreasing concentration. With regard to the dispersion, economic growth and social impartiality demonstrate a noticeable right-skewed distribution, because notable economic advancement and social equity achievements in several regions of C-ORBAs in 2021. For instance, Wuhan boasts the highest economic development index in 2021, which was 12.13 times greater than that of Hechi, the city with the lowest index. Similarly, Wuhan achieves the highest social equity index in 2021, surpassing Chongzuo, which had the lowest index of 4.88.
Regional Disparities in Inclusive Green Growth
Differential Characteristics at the Region Level
This study employs the entropy weighting approach to assess comprehensive IGG indicators across C-ORBAs. Between 2010 and 2021, these areas demonstrated consistent improvement in their overall sustainable development performance, albeit with significant variations, as depicted in Table 4.
IGG Indices in Old Revolutionary Base Areas.

The Jiangxi–Fujian–Guangdong old revolutionary base area shows the most commendable performance in terms of its IGG level, with an average value of .0301. The Sichuan–Shaanxi old revolutionary base area is positioned in the upper-middle range in terms of its comprehensive IGG indices; however, the indices lack stability and exhibit fluctuations and a recent downward trend. The Shaanxi–Gansu–Ningxia area and Left and Right Rivers old revolutionary base areas exhibit relatively low comprehensive IGG indices, with a mean of .0113 and .0070, respectively, thereby ranking fourth and fifth among C-ORBAs. The Dabie Mountain old revolutionary base area exhibits a relatively good performance in terms of its comprehensive IGG indices and generally maintains a steady growth trend, despite the noticeable downward trends in certain years, such as 2013 and 2015.
Overall, the IGG in C-ORBAs improved from 2010 to 2021, but their comprehensive indices fluctuated during the study period. The disparities are driven by varying levels of economic development, social equity, and ecological well-being. Regions such as Jiangxi–Fujian–Guangdong benefit from a high per capita GRP and industrial diversification, whereas the Left and Right Rivers struggle because of their limited industrial capacity and infrastructure. Access to education and healthcare varies widely, with the Dabie Mountain and Left and Right Rivers regions facing significant deficits compared with the more developed areas. The fragility of the ecosystems of the Left and Right Rivers and Dabie Mountain regions can exacerbate their environmental challenges and thus further widen the disparities.
To delve deeply into the ever-changing traits of IGG in C-ORBAs, this study selects the indices of IGG in the areas for 2010 and 2021. Kernel density estimation serves as the analytical technique in this study, as depicted in Figure 7. In terms of the distribution position, the main peaks of the kernel density curves of the general IGG indices in C-ORBAs collectively shift toward high values, indicating an overall uptrend in IGG in each of C-ORBAs. With regard to the distribution spread, the kernel density curves of the comprehensive IGG indices in the Jiangxi–Fujian–Guangdong, Sichuan–Shaanxi, Shaanxi–Gansu–Ningxia, and Left and Right Rivers old revolutionary base areas do not exhibit any noticeable tails. This result suggests that, in C-ORBAs, the comprehensive IGG indices are minimal outliers. However, the Dabie Mountain old revolutionary base area displayed a significant right-tail phenomenon in 2010 and 2021 owing to Wuhan’s dominant position in the region.

Evolution of IGG in five old revolutionary base areas. (a) Inclusive green growth composite score in 2010. (b) Inclusive green growth composite score in 2021.
Regarding the distribution form, the comprehensive IGG indices in the Jiangxi–Fujian–Guangdong old revolutionary base area exhibited a significant decrease in their peak values and an increase in their width from 2010 to 2021, thereby indicating a decline in the IGG concentration in the region and a gradual widening of the relative differences. The kernel density curves of the comprehensive IGG indices in the Sichuan–Shaanxi old revolutionary base area transitioned from a bimodal distribution to a unimodal distribution in 2021, thereby indicating a reduction in the polarization trends in the region. The kernel density curves’ peak value for the comprehensive IGG indices in the Shaanxi–Gansu–Ningxia and Left and Right Rivers old revolutionary base areas exhibited a decrease compared with that in 2010. This finding reflects a decrease in the concentration of IGG in the two regions. The kernel density plots for the comprehensive IGG indices in the Dabie Mountain old revolutionary base area showed a noticeable drop in peak height by 2021 relative to 2010, shifting from a faint bimodal pattern to a single-peaked distribution. This trend suggests both a dispersion in IGG clustering and the disappearance of previously observed polarization in the index values.
Differential Characteristics at the Municipal Level
This study assesses and examines IGG in C-ORBAs between 2010 and 2021. In addition, this study conducts spatial visualization analysis on IGG in the areas at the municipal level by using ArcGIS. This study divides the survey regions into five types, according to the natural breaks classification method: low-value region, relatively low-value region, median region, relatively high-value region, and high-value region. To present the time sequence variation traits of the IGG indices in C-ORBAs, this study shows the specific distribution of the indices in 2010 and 2021, as shown in Figure 8.

Distribution map of IGG in old revolutionary base areas. (a) Distribution map of IGG in 2010. (b) Distribution map of IGG in 2021.
In 2010, the IGG level in C-ORBAs was uneven, with the cities with a high development level mainly distributed in the Jiangxi–Fujian–Guangdong along the southeast coast of China. The high-value IGG area was Wuhan, whereas the relatively high-value areas were Quanzhou, Meizhou, and Nanning. The median areas were Shaoguan, Mianyang, Shangluo, Ganzhou, Xiangyang, Shangrao, Nanyang, Zhangzhou, Pingliang, Anqing, Yan’an, Xinyang, Yichun, Huanggang, and Sanming, whereas the relatively low-value areas were Chaozhou, Fuzhou, Baoji, Xiaogan, Dazhou, Heyuan, Nanchong, Ji’an, Yulin, Zhumadian, Longyan, Wuzhong, Pingxiang, Qingyang, Nanping, Hanzhong, Guyuan, Xinyu, Tongchuan, Zhongwei, and Yingtan. Meanwhile, the low-value areas were Chongzuo, Suizhou, Hechi, Guangyuan, Baise, Ankang, Lu’an, and Bazhong.
In 2021, the IGG level in the five old revolutionary areas was high in the East-Central regions but low in the west. The high-value IGG areas were Wuhan, Nanning, Quanzhou, Ganzhou, Shaoguan, and Mianyang, and the relatively high-value areas were Nanyang, Yichun, Shangrao, Xiangyang, Fuzhou, Pingxiang, Zhangzhou, Xinyu, Longyan, and Ji’an. The areas with a median value were Xinyang, Zhumadian, Anqing, Nanchong, Baoji, Yulin, Huanggang, Sanming, Chongzuo, Yingtan, Xiaogan, Hanzhong, Dazhou, Tongchuan, Guyuan, Meizhou, Yan’an, Heyuan, and Baise, and the areas with a relatively low value were Nanping, Pingliang, Guangyuan, Lu’an, Wuzhou, Ankang, Zhongwei, Qingyang, Hechi, Bazhong, and Chaozhou. Meanwhile, the low-value areas were Suizhou and Shangluo, which faced systemic constraints from their comparatively limited economic scale; spatially uneven provision of public services; high ecological vulnerability, with constrained resilience; and acute tension between their industrial expansion goals and environmental conservation imperatives. Collectively, the structural factors manifest as persistent deficits in regional ecosystem conservation and management.
Overall, the IGG level rose considerably in 2021 compared with that in 2010, mainly owing to the progression of the cities from being a low-value area to a median area. The major cities that progressed are Baoji, Xiaogan, Dazhou, Heyuan, Nanchong, Ji’an, Yulin, Zhumadian, Longyan, Pingxiang, Hanzhong, Guyuan, Xinyu, Tongchuan, and Yingtan. Furthermore, the mean annual growth ratio of the general IGG indices in the 48 municipalities in C-ORBAs stood at 2.24% from 2010 to 2021, with a total of 29 municipalities surpassing the average and achieving a mean growth ratio of 3.65% during the specified period.
The relationship between economic advancement, social equity, and ecological well-being is complex and interdependent. Economic growth in regions such as Jiangxi–Fujian–Guangdong improved their social equity by increasing their access to education and healthcare. However, this growth led to environmental degradation in some areas, thereby highlighting the trade-offs between development and sustainability. By contrast, regions like the Left and Right Rivers experienced weak economic growth and made limited investments in social services and ecological restoration. The results underscore the need for integrated policies that can balance economic, social, and environmental goals.
Decomposition of Regional Disparities
This study calculates the coefficient of variation and the Theil Index in C-ORBAs. The overall Theil Index and coefficient of variation in C-ORBAs exhibited significant fluctuations between 2010 and 2021, as shown in Figure 9. The variations show a steady rise, with the values increasing from .09777 to .11073 and from .56339 to .57391, thereby highlighting the widening of the IGG disparities between the areas.

Theil Index and coefficient of variation in old revolutionary base areas.
The regional-level analysis presented in Table 5 reveals that, during the period of 2010 to 2018, the Jiangxi–Fujian–Guangdong old revolutionary area experienced fluctuations in its Theil Index, which indicates an overall downward trend and a reduction in the regional disparities. The Theil Index of the Jiangxi–Fujian–Guangdong old revolutionary base area began to rise in 2019 owing to significant fluctuations in the general IGG indices of the individual cities in the area. The Theil Index of the Sichuan–Shaanxi old revolutionary base area exhibited a general decline from 2010 to 2017, characterized by minor fluctuations and reduced regional disparities. During the period of 2018 to 2021, the Theil Index of the Sichuan–Shaanxi old revolutionary base area demonstrated an oscillating trend of rising–falling–rising, indicating significant fluctuations in the comprehensive IGG indicators between the prefecture-level cities within the region. The Theil index of the Shaanxi–Gansu–Ningxia old revolutionary base area exhibited significant fluctuations from 2010 to 2021, indicating notable shifts in the areal differences. The Theil Index of the Left and Right Rivers and Dabie Mountain has consistently presented an increase since 2013, indicating widening regional disparities. The Theil Index of the old revolutionary areas exhibited a general uptrend from 2010 to 2021, with marginal declines in 2013 and 2017 and minimal fluctuations between 2018 and 2020. The findings suggest a gradual widening of the disparities between C-ORBAs.
Regional Decomposition of IGG Disparities.

The growing chasm in IGG among the C-ORBAs can likely be attributed to the absence of tailored support strategies, which hampers the progress of less developed regions in capitalizing on their distinctive growth opportunities. The absence of a coordinated cooperation platform and talent exchange may lead to the one-way circulation of high-quality resources, which can exacerbate the disparities between the regions.
This study assesses the disparities in IGG across and within C-ORBAs, and the degree to which the discrepancies are influencing each of the five regions. From 2010 to 2021, the disparities in IGG in C-ORBAs stemmed primarily from the Dabie Mountain and Left and Right Rivers, and from the internal differences in C-ORBAs, as elaborated in Table 5. For example, in 2021, notable inequalities are evident in the progression of C-ORBAs, with the Left and Right Rivers and Dabie Mountain old revolutionary base areas playing a prominent role in such disparities. The differences exceeded 11% and contributed significantly to the overall regional disparities. Notably, the Dabie Mountain old revolutionary base area exhibits the highest contribution rate of 56.08%, thereby ranking first among the sources of the disparities.
Uneven policy implementation and institutional inefficiencies can further exacerbate regional disparities. Underdeveloped regions, such as the Left and Right Rivers region, lack sufficient financial support for infrastructure and ecological projects, which can slow their IGG. Limited coordination between the local government and central agencies can hinder the effective implementation of revitalization plans, particularly in the Dabie Mountain and Left and Right Rivers regions. Moreover, the misallocation of resources, such as prioritizing industrial expansion over ecological restoration, has led to environmental degradation in the ecologically fragile regions. Therefore, the upgrade of the IGG level in C-ORBAs should be accompanied by intensified efforts to address the polarization between and the internal disparities within the areas.
Convergence Analyses
Sigma Convergence Analysis
The response coefficients depicted in Figure 10 reveal the regional convergence or divergence in the pursuit of IGG. Evidence of convergence in the IGG level in C-ORBAs is generally lacking. From a holistic perspective, the sigma convergence coefficient increased from .065 in 2010 to .091 by 2021, whereas the standard deviation of IGG demonstrated a consistent increase over time. Despite the decreasing coefficients in the individual years, a clear overall divergence trend can be observed, indicating that the overall disparity has widened further. This finding aligns with the aforementioned results.
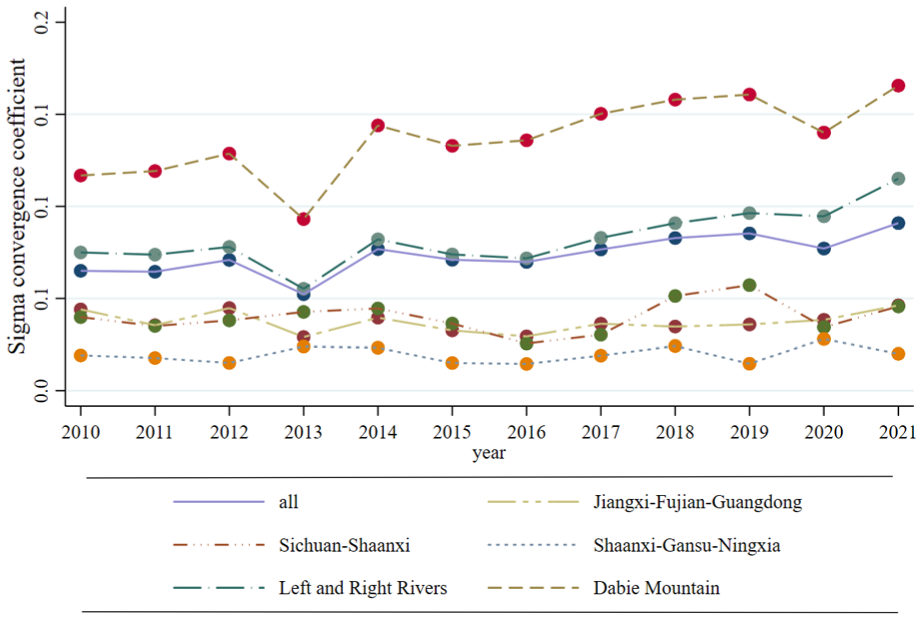
Trends of interregional differences in IGG.
From a regional perspective, the sigma convergence coefficient of the Left and Right Rivers and Dabie Mountain old revolutionary base areas demonstrates a consistently upward trend, in line with the overall pattern, which indicates a significant increase in IGG at a highly dispersed level. Despite demonstrating significantly lower growth rates compared with the Left and Right Rivers and Dabie Mountain old revolutionary base areas, the Sichuan–Shaanxi and Jiangxi–Fujian–Guangdong old revolutionary base areas show a general rise in their coefficient. The Shaanxi–Gansu–Ningxia old revolutionary base area exhibits relatively stable coefficient changes; however, they did not fluctuate over time. Specifically, the area’s sigma convergence coefficient increased from .019 in 2010 to .020 by 2021, thereby suggesting no clear convergence trend. The findings indicate that disparities exist in the overall and interregional IGG levels in C-ORBAs, which fail to meet the conditions for sigma convergence.
The lack of sigma convergence indicates that the IGG disparities will widen over time. The divergence is highly pronounced in the Left and Right Rivers and Dabie Mountain regions, where economic and social development is lagging. The regions face structural barriers, such as limited access to education and healthcare, and environmental vulnerabilities, which can hinder their ability to catch up with the highly developed areas. The findings suggest that, without targeted interventions, the disparities will likely persist.
Beta Convergence Analysis
Table 6 displays the results of absolute beta convergence. The beta coefficient for IGG across all the old revolutionary base areas exhibits a positive trend and is statistically significant. This finding signifies that the IGG levels have not converged to a common steady-state level, thereby suggesting a trend of beta divergence. Regionally, the beta convergence coefficients for IGG in C-ORBAs are positive. Findings imply that, during the period under investigation, the regional IGG disparities widened gradually. The low-level areas with a weak economic foundation and extensive production methods that may lead to environmental pollution will find catching up to the high-level areas challenging.
Absolute Beta Convergence Regression Results.

Note. Standard errors in parentheses.
p < 0.01. **p < 0.05. *p < 0.1.
The conditional beta convergence results are shown in Table 7. On the basis of absolute beta convergence, this study adds region and year fixed effects to control for the region-invariant time traits and the time-invariant regional characteristics to achieve conditional beta convergence. The beta convergence coefficients for overall IGG in C-ORBAs are positive and significant, thereby indicating no conditional beta convergence and the expanding IGG disparities between the regions. From a regional perspective, the conditional beta convergence coefficients for IGG across C-ORBAs are all positive and significant, this suggests that IGG between the five revolutionary old areas is diverging and not converging toward a steady-state level. The steady-state IGG level between the cities is not the same; thus, the imbalance in regional IGG persists and will not likely be reversed effectively in the short term.
Conditional Beta Convergence Regression Results.

Note. Standard errors in parentheses; year FEs and city FEs denote time fixed effects and region fixed effects.
p < 0.01.
The absence of beta convergence highlights the challenges of achieving balanced development across the regions. The low-income regions with fragile ecosystems, such as the Left and Right Rivers region, struggle to converge with the high-income regions owing to their limited capacity for green technology adoption and resource-intensive development models. This finding underscores the need for tailored policies that can address the unique challenges of underdeveloped regions to foster their sustainable and inclusive growth.
Conclusion and Implications
Conclusion
This study integrates the theoretical IGG framework with the specific realities of C-ORBAs and constructs a comprehensive evaluation indicator system. By using panel data from 2010 to 2021, this study employs the entropy weight method and kernel density estimation to assess and analyze IGG levels and characteristics. Moreover, this study delves into spatial inequalities and their underlying causes with the aid of the coefficient of variation and the Theil index, while employing convergence models to analyze the trends of IGG. The key conclusions are presented below.
IGG is characterized by overall growth and regional disparities. The comprehensive IGG level in C-ORBAs exhibited a steady upward trend from 2010 to 2021. However, regional disparities have widened, which reflects significant differences in development across the eastern, central, and western regions. This finding aligns with that of the literature, such as Wang, Hou, et al. (2022), who highlighted the uneven distribution of IGG across China.
The subsystems exhibit different characteristics of change. Specifically, the economic development and social equity subsystems exhibit narrowing disparities, whereas the livelihood security and ecological well-being subsystems remain low and concentrated. This finding underscores the persistent challenges of environmental degradation and resource exhaustion, which is consistent with the global concerns raised by Baniya (2021).
The regional and internal variations are obvious. The IGG levels vary considerably between C-ORBAs, with the Dabie Mountain and Left and Right Rivers regions contributing the most to the regional disparities. Internal differences within the regions have also widened.
The differences show varying trends. The sigma and beta convergence analyses reveal the lack of convergence in the IGG levels across the regions, which signifies that the disparities will likely persist without concerted efforts. This disparity corroborates the research of Chen et al. (2020) and Sun et al. (2022), which emphasized the challenges of achieving balanced development in less developed regions.
The study reveals that, While the general trajectory of IGG has shown advancement, the disparity among and within underdeveloped areas persists. This discrepancy can be attributed to levels of investment and the efficacy of policy execution. For example, in C-ORBAs, from the perspective of social development and investment, the eastern region exhibits robust economic progress and substantial investment potential in essential public services. The internal urban–rural gap in the central and western regions is also large, which can further exacerbate the overall regional backwardness. The Left and Right Rivers and Dabi Mountain areas contribute significantly to the differences in IGG owing to the concentrated and extensive stone desertification in the former and the population outflow in and lack of investment attractiveness of the latter. Moreover, the policy implementation gap in the revitalization plans and sustainable development projects has further exacerbated inequality in and slowed the progress of the underdeveloped regions.
Implications
First, for the underdeveloped regions, efforts should be made to minimize differences in IGG. C-ORBAs should enhance their regional coordination and promote common development, including facilitating the transregional flow of capital, knowledge, technology, and management methods (Chen et al., 2023; Song et al., 2023). Underdeveloped countries and regions need to establish a comprehensive regional collaborative development mechanism to narrow the development gap. Efforts should be made to advance the construction of a unified large market, accelerate the development of regional products, property rights, and human resource markets, and strengthen coordination in aspects such as technological resources, credit systems, market access, and mutual benefit.
Second, underdeveloped countries and regions should attach importance to scientific and technological innovation to enhance the vitality and potential of economic development. Through the development of light or even zero-pollution industries such as information technology and the Internet, underdeveloped countries and regions can better achieve IGG. Underdeveloped countries and regions should adopt effective measures to promote the sharing of educational resources and achieve equal educational opportunities. Underdeveloped countries and regions should advance regional integration reforms, create a fairer employment environment and business climate, improve infrastructure, enhance the availability of key equipment, promote equal employment opportunities, and ensure the living standards of the population.
Third, underdeveloped countries and regions should based on their own resource bases and deficiencies, clearly define the main focus points for enhancing the level of inclusive green growth, so as to achieve sustainable economic, environmental and social development. These regions can enhance their sustainability and economic benefits by developing related products (Cao, 2022). Furthermore, economic networks should be established with the highly developed regions as the center to break through the development islands among cities in the region, guide the surrounding peripheral urban areas to accelerate the development of supporting industries in service centers and intermediate regions, speed up the formation of smooth industrial development channels, and enhance the overall IGG level.
Fourth, in view of the significant regional differences in IGG, underdeveloped countries and regions should focus on building a precise, differentiated and collaborative policy system. The government needs to cooperate with international organizations to set up a green revitalization fund specifically for backward areas. Guide local governments to design implementation plans based on their own resource endowments. The ineffectiveness of policies often stems from the implementation process. To this end, under the framework of national core policies, local governments should be given the power and responsibility to formulate quantifiable, executable, and clear implementation plans based on local diagnosis, and encourage deep community participation in the design and monitoring process.
This study’s constraints and suggested avenues for subsequent inquiry merit exploration. A comparative analysis of IGG across different regions or countries could provide broad insights into the factors that can drive disparities and convergence. This study uses quantitative methods to examine factors such as laws, limitations, working hours, and other objective conditions. In the future, qualitative methods may be considered to make the research highly comprehensive.
Footnotes
Consent to Participate
This article does not contain any studies with human or animal participants. There are no human participants in this article, and informed consent was not required.
Funding
The authors disclosed receipt of the following financial support for the research, authorship, and/or publication of this article: This study was supported by the Jiangxi Province Social Science Fund Project (No. 24YJ22); Management Science and Technology Project of Jiangxi Province, China (No.20252BAA100063).
Declaration of Conflicting Interests
The authors declared no potential conflicts of interest with respect to the research, authorship, and/or publication of this article.
Data Availability Statement
The data supporting the results of this study can be obtained from the corresponding author upon reasonable request.