
Abstract
This paper examines the relationship between teacher pay and students’ academic achievement, using nationally representative, district-level linked data between districts’ performance on standardized tests and average teacher base salary. By employing state fixed effects and multilevel mixed effects models, we find that both mathematics and English test scores are significantly higher in districts that offer higher base salaries to teachers, compared with those in districts with a lower teacher base salary. We also find that higher teacher base salaries reduce achievement gap between white and black students, as well as between white and Hispanic students, by raising test scores more for those minority students.
Signals of concern about teacher working conditions have become a new norm in the public and policy spheres in the United States. These signals—especially those expressed in recent waves of teacher strikes and protests episodes—have increased the pressure to improve teacher pay and working conditions. Unfortunately, there is a dearth of evidence to help understand what the ultimate consequences of teacher salary increases are, not just for teachers but also for public educational systems. State legislatures that are considering approving salary increases for teachers, as well as federal policymakers who are discussing similar initiatives are in need of more research-based guidance to help them make meaningful proposals.
Surprisingly, there is very limited evidence on the relationship between teacher pay levels and student performance, especially from studies that either rely on national level data and/or use proper quasi-experimental methods (Britton & Propper, 2016; Figlio & Kenny, 2007; Loeb & Page, 2000). Similarly, little is known regarding how teacher wage raises may have an impact on any of the persistent achievement gaps and education inequities in the country (i.e., race, socioeconomic status). Both facts are in part driven by lack of nationally representative microdata that includes schools’ personnel practices in conjunction with, or linkable with, information of student performance at the district level. Therefore, the lack of reliable, representative, and updated evidence certainly inhibits knowing the role teacher salary plays as a factor that improves the quality of the education system and its productivity.
Our study examines the following research questions: what is the relationship between school teacher pay and students’ test scores in US districts? How does the relationship between the two vary across different subgroups of students? To answer these questions, we use two sets of nationally representative data. We benefit from the existence of district level performance data for the U.S. school districts (from the Stanford Education Data Archive, between 2009 and 2015), which we combine with teacher salary information at the district level (from the National Center for Education Statistics (2007–2008) and National Center for Education Statistics (2011–2012) Schools and Staffing Survey and the 2015–2016 National Teacher and Principal Survey).
This offers us the possibility to exploit within-state and within-year variation in teacher salaries and performance outcomes. State fixed effects, however, absorb a substantial amount of the variation in both student achievement and teacher salaries. Because much of the variation in teacher salaries is across states rather than within states, we also employ a multilevel (hierarchical) mixed effects model, where each state is a higher-level entity and every school district is a lower-level unit, to complement the fixed effects models. We control for a broad range of characteristics of the school districts and their communities, that may correlate with student performance, which help us reduce omitted variable bias in examining the association between teacher pay and student performance (Britton & Propper, 2016; Loeb & Page, 2000).
To our knowledge, our analysis is the first to model the relationship between teacher pay and student test scores at the district level, which is the ideal level of aggregation (as discussed by Loeb & Page, 2000 and by Figlio & Kenny, 2007), for the country. Because the availability of performance data for different subjects and grade-levels, the analyses allow us to ascertain if the patterns are consistent across them. Importantly, given the availability of performance data for different population subgroups—race/ethnic groups and socioeconomic level groups—our study also speaks to how changes in teacher salaries can contribute to closing the persistent achievement gaps. 1
This research improves upon previous literature by making several important contributions. First, we rely on nationally representative data that allow us to utilize the full breadth of variation of teacher salary and offer higher levels of external validity. Second, we use the base salary of teachers, instead of the fixed salary schedules of districts used in many studies, to better capture the variation of teacher compensation and produce more precise estimates. Third, we control for various teacher, district, and community characteristics, substantially reducing potential omitted variable bias. Finally, we conduct a comprehensive analysis of districts’ performance by disaggregating our results for various subgroups of students.
Literature Review
Two main approaches can be used to frame the empirical literature that has examined teacher wages and their relationship with teachers’ labor supply and student performance. One approach builds on ‘efficiency wages’ models used in labor economics to address issues of quality, effort, or productivity in specific labor markets. The second approach, borrowed from the economics of education, relies on traditional models of education production and how the allocation of resources to teacher-related inputs affects it. These two lines of thoughts may reveal important mechanisms through which higher salaries would help build a stronger teaching workforce (through influencing the pool of applicants, recruitment, and retention), which will ultimately improve student performance.
Efficiency wages are used in labor economics to argue that in the presence of different challenges—such as difficulty to identify quality, agency, effort, and labor outcomes—wages above market equilibrium can lead to increased labor productivity (Katz, 1986; Krueger and Summers, 1988; Stiglitz, 1986; Weiss, 1980, 2017, etc.). Higher salaries can help reduce costs associated with teacher turnover, and the increased productivity can pay for the higher salaries. This frame is also useful to examine the relationship between salaries and teacher quality and productivity—and hence, potentially student performance—because similar challenges can affect teacher labor markets. Measuring teachers’ productivity is affected by the difficulty to parcel out their contribution to an outcome that is jointly produced, by problems in the principal-agent relationships (aggravated by students, parents, and other agents in this relationship), or by monopsonistic, non-competitive features. Gius (2012) summarizes some of these challenges, building on existing research that argues about the difficulty to distinguish between individual levels of attainment “whenever outputs is jointly produced” (Murnane & Cohen, 1986), or that the principal-agent theory (specifically for merit pay purposes) is particularly difficult to implement in an education setting (Goldhaber et al., 2008). Other challenges appear because effort and quality are difficult to observe and measure, which has been used to call for the need to promote competition to increase productivity (Hanushek, 2015) because teacher labor markets may show some monopsonistic (Council of Economic Advisers [CEA], 2016).
Changes in salaries could lead to changes in quality and productivity through the following channels. First, the evidence demonstrates that higher salaries lead to higher quality students entering education, which would both strengthen the prospective teachers’ applicant pool and eventually expand the future teaching pipeline (Figlio, 1997; Hanushek et al., 2019; Leigh, 2012; Podolsky et al., 2019), where the quality of the potential pool of potential teachers is measured by teachers’ ability, test scores, their college selectivity, or other credentials. Along these lines, Figlio (1997) finds that higher wages increase the share of teachers who graduated from a selective college and the share of teachers with subject-matter qualification. For example, he finds that, in metropolitan areas, an increase of 1% in average teacher salaries would increase the share of teachers who have graduated from a selective college by 1.6%. The results hold both in the national level sample and when testing the relationship in six specific metropolitan areas. Leigh (2012) shows that an increase of 1% in the salary of starting teachers raises the average aptitude of students who enter teacher education courses by 0.6 percentile ranks. This research, which uses a model of current salaries and academic aptitude of potential future teachers and test scores for all students admitted to a university in Australia between 1989 and 2003, finds a stronger effect for those at the median of the distribution.
A related issue is that higher salaries correlate with increased interest in becoming teachers, which can potentially strengthen the quality of the pool of potential teachers. Early work by Manski (1987) shows that a 10% increase in teachers’ weekly salary increases the proportion of college graduates willing to work as teachers by 26%. This, in part, is in agreement with the lack of attractiveness of teaching as a career due to low pay among recent cohorts of students taking the ACT, who chose low salary as the most cited reason when asked why they were not interested in teaching (Croft et al., 2018). 2
Relative pay for teachers can also influence who enters the teaching profession. In Florida, the effectiveness of teachers who entered the profession during recessions was higher than for those who did so during non-recessionary periods, with the former being about 0.10 standard deviations (0.04) more effective in raising math (reading) test scores (Nagler et al., 2017), whereas an economic boom in Texas (that tripled the local tax base and boosted revenues via shale oil and gas drilling) reduced test scores and student attendance (Marchand & Weber, 2019).
The positive association between teachers’ salary and their skills is also observed using international evidence. For example, Hanushek et al. (2019) rely on international data for over 30 OECD countries to show that countries that pay teachers more “tend to draw their teachers from higher parts of the college skill distribution” (p. 63).
The second channel is that higher salaries lead to higher quality teachers. In general, the labor economics literature finds a positive relationship between wages and skills (or positive returns to skills other than educational attainment as in Murnane et al., 1995; etc.). In education, higher salaries have been shown to increase average credentialing and experience of teachers (Hendricks, 2014; Ronfeldt et al., 2013; Sorensen & Ladd, 2018). The empirical evidence produced more recently counters a historical view claiming a lack of a systematic link between quality and salary and working conditions (Hanushek & Rivkin, 2007).
Some studies show that changes in teachers’ effectiveness or quality resulting from net turnover associated with changes in the relative pay for teachers (i.e., shocks to the labor market affect who stays in the profession) lead to changes in the quality of the teaching workforce. For example, Britton and Propper (2016) find that a 10% increase in the local labor market wage in England results in a 1.4 point decrease of teaching quality (a very large change relative to a mean of 2.5 points, where quality is measured by a metric produced by inspections by the national school regulator), an increase in the share of novice teachers, and a decrease of teachers with more than 10 years of experience. Hendricks (2016) finds that increasing salaries for teachers with three or more years of experience raises high-ability teachers’ retention, whereas higher salaries for teachers with 0 to 2 years of experience increases the retention rate of low-ability teachers, where ability is measured by certification scores, in Texas public schools during the 1995 to 1996 through 2013 to 2014 school years.
The third channel is that higher salaries reduce teacher turnover, or increase retention, which is helpful for students and schools. The relationship between wages and turnover is clear in multiple pieces of research. Wages are important for retaining and attracting teachers (Gray & Taie, 2015; Grissom et al., 2015; Katz, 2018; Loeb et al., 2005; Manski, 1987; Murnane & Olsen, 1989; Podolsky et al., 2019; Stockard & Lehman, 2004). In addition, salaries are particularly important for retention of teachers in their early careers, and in high-poverty or high-needs schools, where issues of turnover and quality are more striking (García & Weiss, 2019; Hanushek et al., 1999; Loeb et al., 2005; Sorensen & Ladd, 2018).
Hendricks (2014) finds that paying teachers leads to higher retention a year later, using data from Texas between 1996 and 2012. His study controls for a set of time-varying or fixed labor market conditions and district characteristics that could be correlated with teacher pay. He finds that a 1% increase in teacher pay reduces teacher turnover by 0.16 percentage points, with a larger effect for less experienced teachers. He simulates that, through this effect, paying teachers more improves student achievement (through higher retention, and through increasing the average experience of teachers in the district). With data from Texas as well, Hanushek et al. (1999) find that increasing teacher salaries within a district by 10% reduces a teacher’s probability to leaves the district by 2% for probationary teachers, and by 1% for teachers with 3 to 5 years of experience. 3
Even having more equal salaries between teachers and non-teachers reduces teacher turnover. On relative salaries or opportunity costs, Murnane and Olsen (1989) look into how the salary of the best job alternative outside of teaching affects teachers’ retention and find that $1,000 (in 1967 $) in the opportunity cost salary correlates with a decrease of 4 years in the median length of stay in teaching (using data from Michigan’s State Department of Education, which followed teachers who started their teaching careers in the early 70s until the 1984–1985 school year). A share of studies covered below incorporates the idea of the teacher salary gap and, thus, controls for this channel, into their empirical strategies. 4
Research is also conclusive on how turnover and attrition affect student performance. A lack of sufficient, qualified teachers threatens students’ leaning ability (Darling-Hammond, 2000; Ladd & Sorensen, 2016). Instability in the teaching workforce in a school due to high turnover or high attrition negatively affects student achievement, and it diminishes teacher effectiveness and quality (Darling-Hammond, 2000; Jackson & Bruegmann, 2009; Kraft & Papay, 2014; Ladd & Sorensen, 2016; Ronfeldt et al., 2013; Sorensen & Ladd, 2018). Turnover especially depresses student achievement in the highest-poverty schools, with “turnover-induced loss of general and grade-specific experience” as the main driver of declining student achievement (see Sorensen & Ladd, 2018, citing Hanushek et al., 2016). As mentioned earlier, net turnover increases the share of inexperienced teachers who are not fully certified or credentialed to teach the subject to which they are assigned. The turnover begets further turnover, which substantially weakens the overall quality and ability of the teacher pool in a given school (Sorensen & Ladd, 2018). For novice teachers, Gray and Taie (2015) note that there is a 9 to 10 percentage-point gap in the rates of attrition between teachers who have a first-year-salary of $40,000 or more as compared with those earning less. 5
The second approach relies on the traditional production of education models and resource allocation. From the perspective of the productivity of education spending, it is known that more resources increase student performance (Jackson, 2018; LaFortune et al., 2018), and that teachers are the most important performance factor within the school (Hanushek et al., 1998; Hartel, 2013). For these reasons, it would be expected that an increase of spending on teacher factors, and/or a reallocation of resources toward these factors would yield increases in student performance. This approach always keeps the focus on some metric of productivity or of student performance (for example, test scores, student learning, graduation rates, or some non-contemporaneous outcome linked to performance, such as labor income as adults, etc.) and uses some measurement of teacher compensation to examine their association.
The empirical evidence produced so far on this front was deemed as mixed by some (Hanushek, 1997, 2003, 2015), but also as almost always positive by others (Glewwee et al., 2014), and it has been accepted as limited, incomplete, often challenged by data limitations. Shedding some light on this puzzling summary, the departing point, still recently cited, was that “there is very weak support for the notion that simply providing higher teacher salaries or greater overall spending will lead to improved student performance” (Hanushek, 2015, p. 152, based on revised Hanushek, 1997, 2003). 6 This statement is made out of meta-analysis results and the tabulation of estimates by their sign and statistical significance. The original study (Hanushek, 2003) reveals that 20% out of a total of 118 estimates showed a positive coefficient, 7% negative, and 73% were statistically insignificant. 7
More recent evidence based on alternative methods that use variation in teacher pay from state-level or country-level data, and sometimes relies on natural experiments, shows that higher wages lead to positive student outcomes. (For case studies, usually covering one or a small number of school districts, see Lin, 2010.)
For example, Loeb and Page (2000) find that a 10% increase in wages reduces the dropout rate (the percentage of 16–19 year-olds who are not attending high-school and do not possess a high-school diploma) by 3% to 6% about 10 years later (the argument being that “it takes time for wage changes to lead to higher average teacher quality,” see p. 397). Using college attendance as an alternative outcome, the paper finds an increase of 1.6% in college enrollment for a 10% wage increase. This study uses state-level data and controls for both teacher and non-teacher salaries, and tests for the consistency of the findings using district level data. 8 Card and Krueger (1992) find that, for white males born between 1920 and 1949, a 10% increase in teacher salaries led to a 0.1 percentage-point increase in the rate of return to schooling. 9
Britton and Propper (2016) find that a 10% increase in the teacher pay penalty results in an average loss of about 2% in average school performance (high stakes tests taken at the end of compulsory schooling in England). Their identification strategy uses a natural experiment created by a characteristic of how teacher salaries are set in England (they are centrally regulated), which generates an exogenous gap between wages of teachers and of non-teachers.
Another source of growing descriptive or correlational evidence lies on cross-country analyses. Most of these analyses also show a positive association between teacher wages (at the country level) and student performance (Boarini & Lüdemann, 2009; Dolton & Marcenaro-Gutiérrez, 2011; Hanushek et al., 2019). Though their methods are inadequate to issue causal claims, analyses exploiting these different sources of variation have contributed to raising awareness of differentials in teacher base salaries and compensation across countries that could in part explain the systems’ aggregate performance.
Data
This study utilizes district-level linked data from the Schools and Staffing Survey (SASS) 2007 to 2008, the Schools and Staffing Survey (SASS) 2011 to 2012, the National Teacher and Principal Survey (NTPS) 2015 to 2016, and the Stanford Education Data Archive (SEDA) 2009, 2012, and 2015. The SASS and NTPS, administered by the National Center for Education Statistics (NCES), are nationally representative data that contain about a third of public school districts in the United States. Replacing the SASS beginning the 2015 to 2016 academic year, the NTPS is redesigned with a focus on “flexibility, timeliness, and integration with other Department of Education data” (NCES, 2015–2016). Both the NTPS and SASS include detailed questionnaires at the teacher, principal, and school level, while the SASS also contains school district information. We restrict our analyses to teachers in public schools.
The SEDA, administered by the Center for Education Policy Analysis at Stanford University, incorporates our main outcome variables for performance—district-level averages of students’ test scores, in mathematics and reading, for grades third to eighth. The SEDA also includes information on the characteristics of students and their families and schools at the district level that are based on the Department of Education’s Common Core Data (CCD) and the American Community Survey via the NCES School Districts Demographic System (SDDS).
We merge the SASS, NTPS, and SEDA to construct a data set containing detailed information on school districts, teachers, students, and their communities, at three points in time, based on a unique school district ID number. Our dataset thus consists of three waves of information on the included districts: district performance and characteristics from the 2008 to 2009 SEDA linked to teacher salary information from the 2007 to 2008 SASS, the 2011 to 2012 SEDA linked to the 2011 to 2012 SASS, and the 2014 to 2015 SEDA linked to the 2015 to 2016 NTPS (see Supplemental Appendix I for descriptive statistics). 10 The total number of districts in our sample is approximately 10,000.
The SEDA contains student performance data from English and mathematics tests for the third through eighth grades. Using ordered probit models, the means and standard deviations of test scores are estimated based on reports of the counts of the number of students scoring in each proficiency category on these tests. Then, these means and standard deviations are converted to a common scale calibrated to the scores taken from the National Assessment of Educational Progress (NAEP) tests that are administered to fourth and eighth grade students in odd-numbered years (for a detailed discussion of these methods, see Fahle et al., 2018). Average means and standard deviations are reported by district, grade, year, and also separately by white, Black, Hispanic, and Asian students, as well as for students in different socioeconomic status groups. 11
Our main variable of interest is teacher base salary, which comes from the SASS/NTPS. 12 For each district, we compute the average of the base salary of individual teachers, weighted by each teacher’s final sample weight. We also compute the district-level averages for teacher’s characteristics, such as gender ratio, experience, certification status, union membership rate, and charter school enrollment, and use them as control variables.
We control for numerous characteristics of the districts and their neighborhoods and contrast districts within the same state, so that our results are based on the comparison between similar districts in various dimensions. We control for basic demographic characteristics of school districts including total grade school enrollment; the share of students who are Hispanic, Black, Asian, White, or Native American in each grade; the share of students that are English Language Learners in the district; the share of special education students in the district; the total number of teachers; the total number of instructional aides; the share of all students on free or reduced-price lunch programs; the share of public school students in charter schools; and the share of districts in an urban, suburban, town, or rural location. Additionally, we control for characteristics of the community because they are likely to be associated with districts’ socio-economic status (SES), which we measure with the share of children in poverty, median household income, the share of adults with a bachelor’s degree and above, the share of households with children and a female head, the share of residents living in the same house as in the prior year, the share of unemployed, and the Gini coefficient.
Figure 1 describes a relationship between teacher base salary and average math test scores for each district in 2015 to 2016 with a scatter plot and the line of best fit. The math test scores increase as teacher pay rises for both the fourth and eighth grades. 13 Judging based on the steepness of the slopes of the fitted lines, the strength of the association between pay and district performance is greater for the eighth grade than for the fourth grade.

Teacher base salary and districts’ mathematics performance.
Figure 2 also presents the positive relationship between teacher pay and average English test scores of districts for the fourth and eighth grades. Both fourth and eighth grade students’ English performance improves as teachers receive a higher base salary. Unlike the math test scores, the slopes of the two lines are similar.

Teacher base salary and districts’ english performance.
Methods
Although Figures 1 and 2 may suggest that teacher pay could improve overall district performance, they may depict a spurious correlation that occurs simply because students from affluent districts perform better than students from disadvantaged districts. The relationship between teacher pay and district performance may also be affected by other characteristics of the districts that may be correlated with both teacher pay and district performance.
To address this issue, we control for an extensive set of teacher, district, and community characteristics by incorporating the covariates, one category at a time. First, we add school district characteristics to control for factors that are directly associated with district performance. Second, we include community attributes as additional control variables to tease out their indirect effects on district characteristics and educational outcomes. Lastly, we control for average teacher characteristics within a district to further reduce potential omitted variable bias. 14 See Supplemental Appendix I for summary statistics for all these variables by category and by test subject.
Even though we control for various characteristics of districts to minimize potential omitted variable bias, each state’s unique features may also influence teacher pay and student performance. For instance, each state has a different cultural and legal environment, as well as a unique accountability system for its schools, reflecting a general preference toward public education that is relatively constant over the years. Moreover, all districts are exposed to common shocks in any given year, and this time effect can vary by year, potentially biasing the results. Our first attempt to control for such confounding factors is to exploit within-state and within-year variation by estimating the following equation: 15

where k, s, and t indicate districts, states, and years, respectively. Ykst represents the test score, either mathematics or English. Salarykst measures the average teacher base salary in district k in state s in year t, and it is expressed in logarithms. Xkst is a vector of district and community characteristics. δs is the state dummy and λt the year dummy. ε is the error term, reflecting variation not accounted for in the model.
Fixed effects models, however, absorb a substantial amount of the variation in both student achievement and teacher salaries in which much of the variation in teacher salaries exists across states rather than within states. In addition, there may exist unobservable factors of districts that can pose an endogeneity problem. For instance, districts within the same state may share common characteristics and experiences, such as legal and cultural environment, that are unobservable. When this commonality is large, districts in the same state may not behave independently, as they have similar state-level residuals, and the standard OLS estimates will suffer from omitted variable bias.
To tackle these issues, we also employ the multilevel (hierarchical) linear model that separates the total variance into within-group and between-group components. We estimate the following multilevel mixed-effects linear model:

where k, s, and t indicate districts, states, and years, respectively. X is the vector of control variables at the district level. Model (2) assumes that the relationship between teacher pay and district performance is the same (β1) for all states, and it estimates a single coefficient for each independent variable (fixed effects). However, the model allows a state-specific intercept (us) for each state (random effects). Because the model has both fixed effects and random effects components, it is called “mixed-effect.” Supplemental Appendix II explains details on multilevel mixed-effects linear models in which the state is considered a higher level and the district a lower level.
Researchers find that there exist inequities in the access to teacher credentials and the impacts of resources differ by various racial/ethnic and SES groups (Adamson & Darling-Hammond, 2012; Clotfelter et al., 2006; Goldhaber et al., 2014; Isenberg et al., 2013; LaFortune et al., 2018; Sass et al., 2012). Building on these studies, we run separate analyses by grade, for different race and ethnicity groups of students, and for different poverty level groups. Each subgroup shares the same cultural values and philosophy, which tend to be stable but unobservable. Thus, this subgroup analysis can provide more reliable estimates, because it also controls for those unobservable factors.
Results
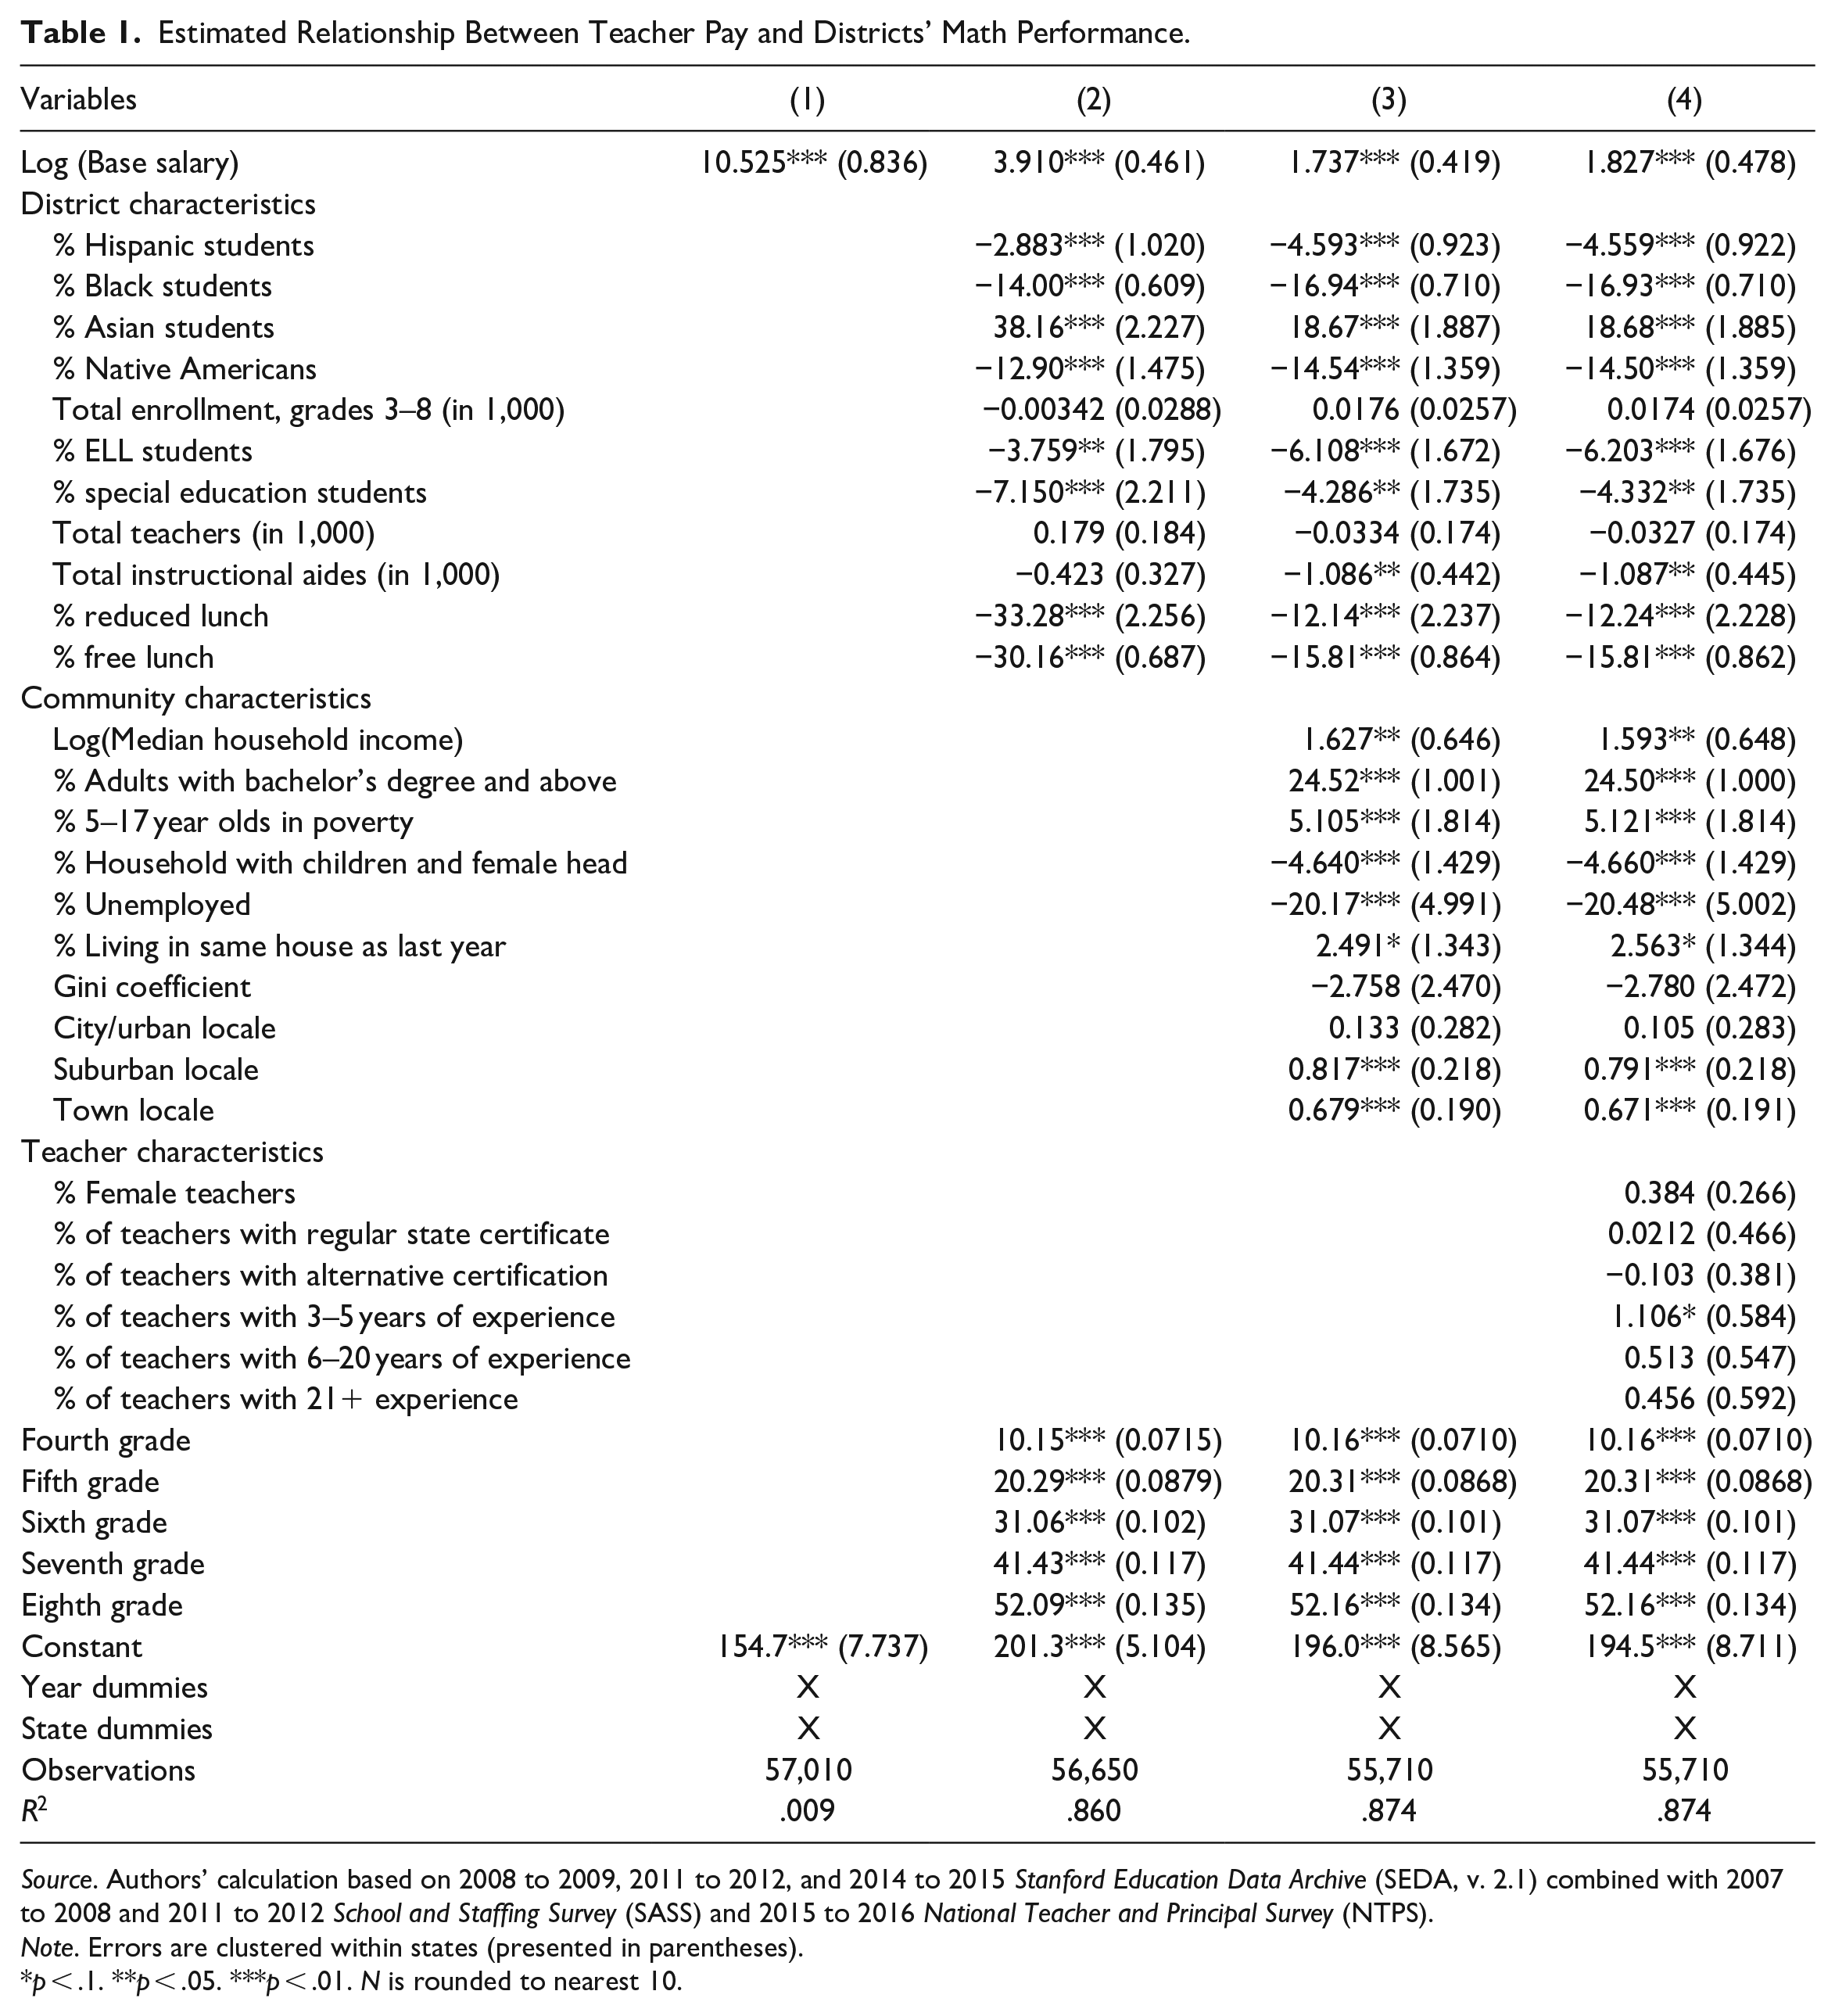
Table 1 presents the estimated results from state and year fixed effects for all students for mathematics test scores, pooling all grade and race-ethnicity groups together. All model specifications show significantly positive association between teacher base salary and districts’ math performance. In model (1), the correlation coefficient between the log of base salary and math test scores is about 10.5, indicating that a 10% increase in teacher base salary is associated with a 1.05 higher average math test score. When normalized, this is equivalent to about one-tenth of a standard deviation in district average math test scores. We control for district characteristics in model (2). The coefficient for base salary substantially falls to about 4, but it remains significant at the 1% significance level. After controlling for community characteristics in the regression in model (3), and adding average teacher attributes as additional control variables in model (4), the coefficients for teacher salary are cut in half, but the significance is still intact. A 10% increase in teacher salary is associated with about 0.2 points (0.01 of a standard deviation) higher average math score.
Estimated Relationship Between Teacher Pay and Districts’ Math Performance.
Source. Authors’ calculation based on 2008 to 2009, 2011 to 2012, and 2014 to 2015 Stanford Education Data Archive (SEDA, v. 2.1) combined with 2007 to 2008 and 2011 to 2012 School and Staffing Survey (SASS) and 2015 to 2016 National Teacher and Principal Survey (NTPS).
Note. Errors are clustered within states (presented in parentheses).
p < .1. **p < .05. ***p < .01. N is rounded to nearest 10.
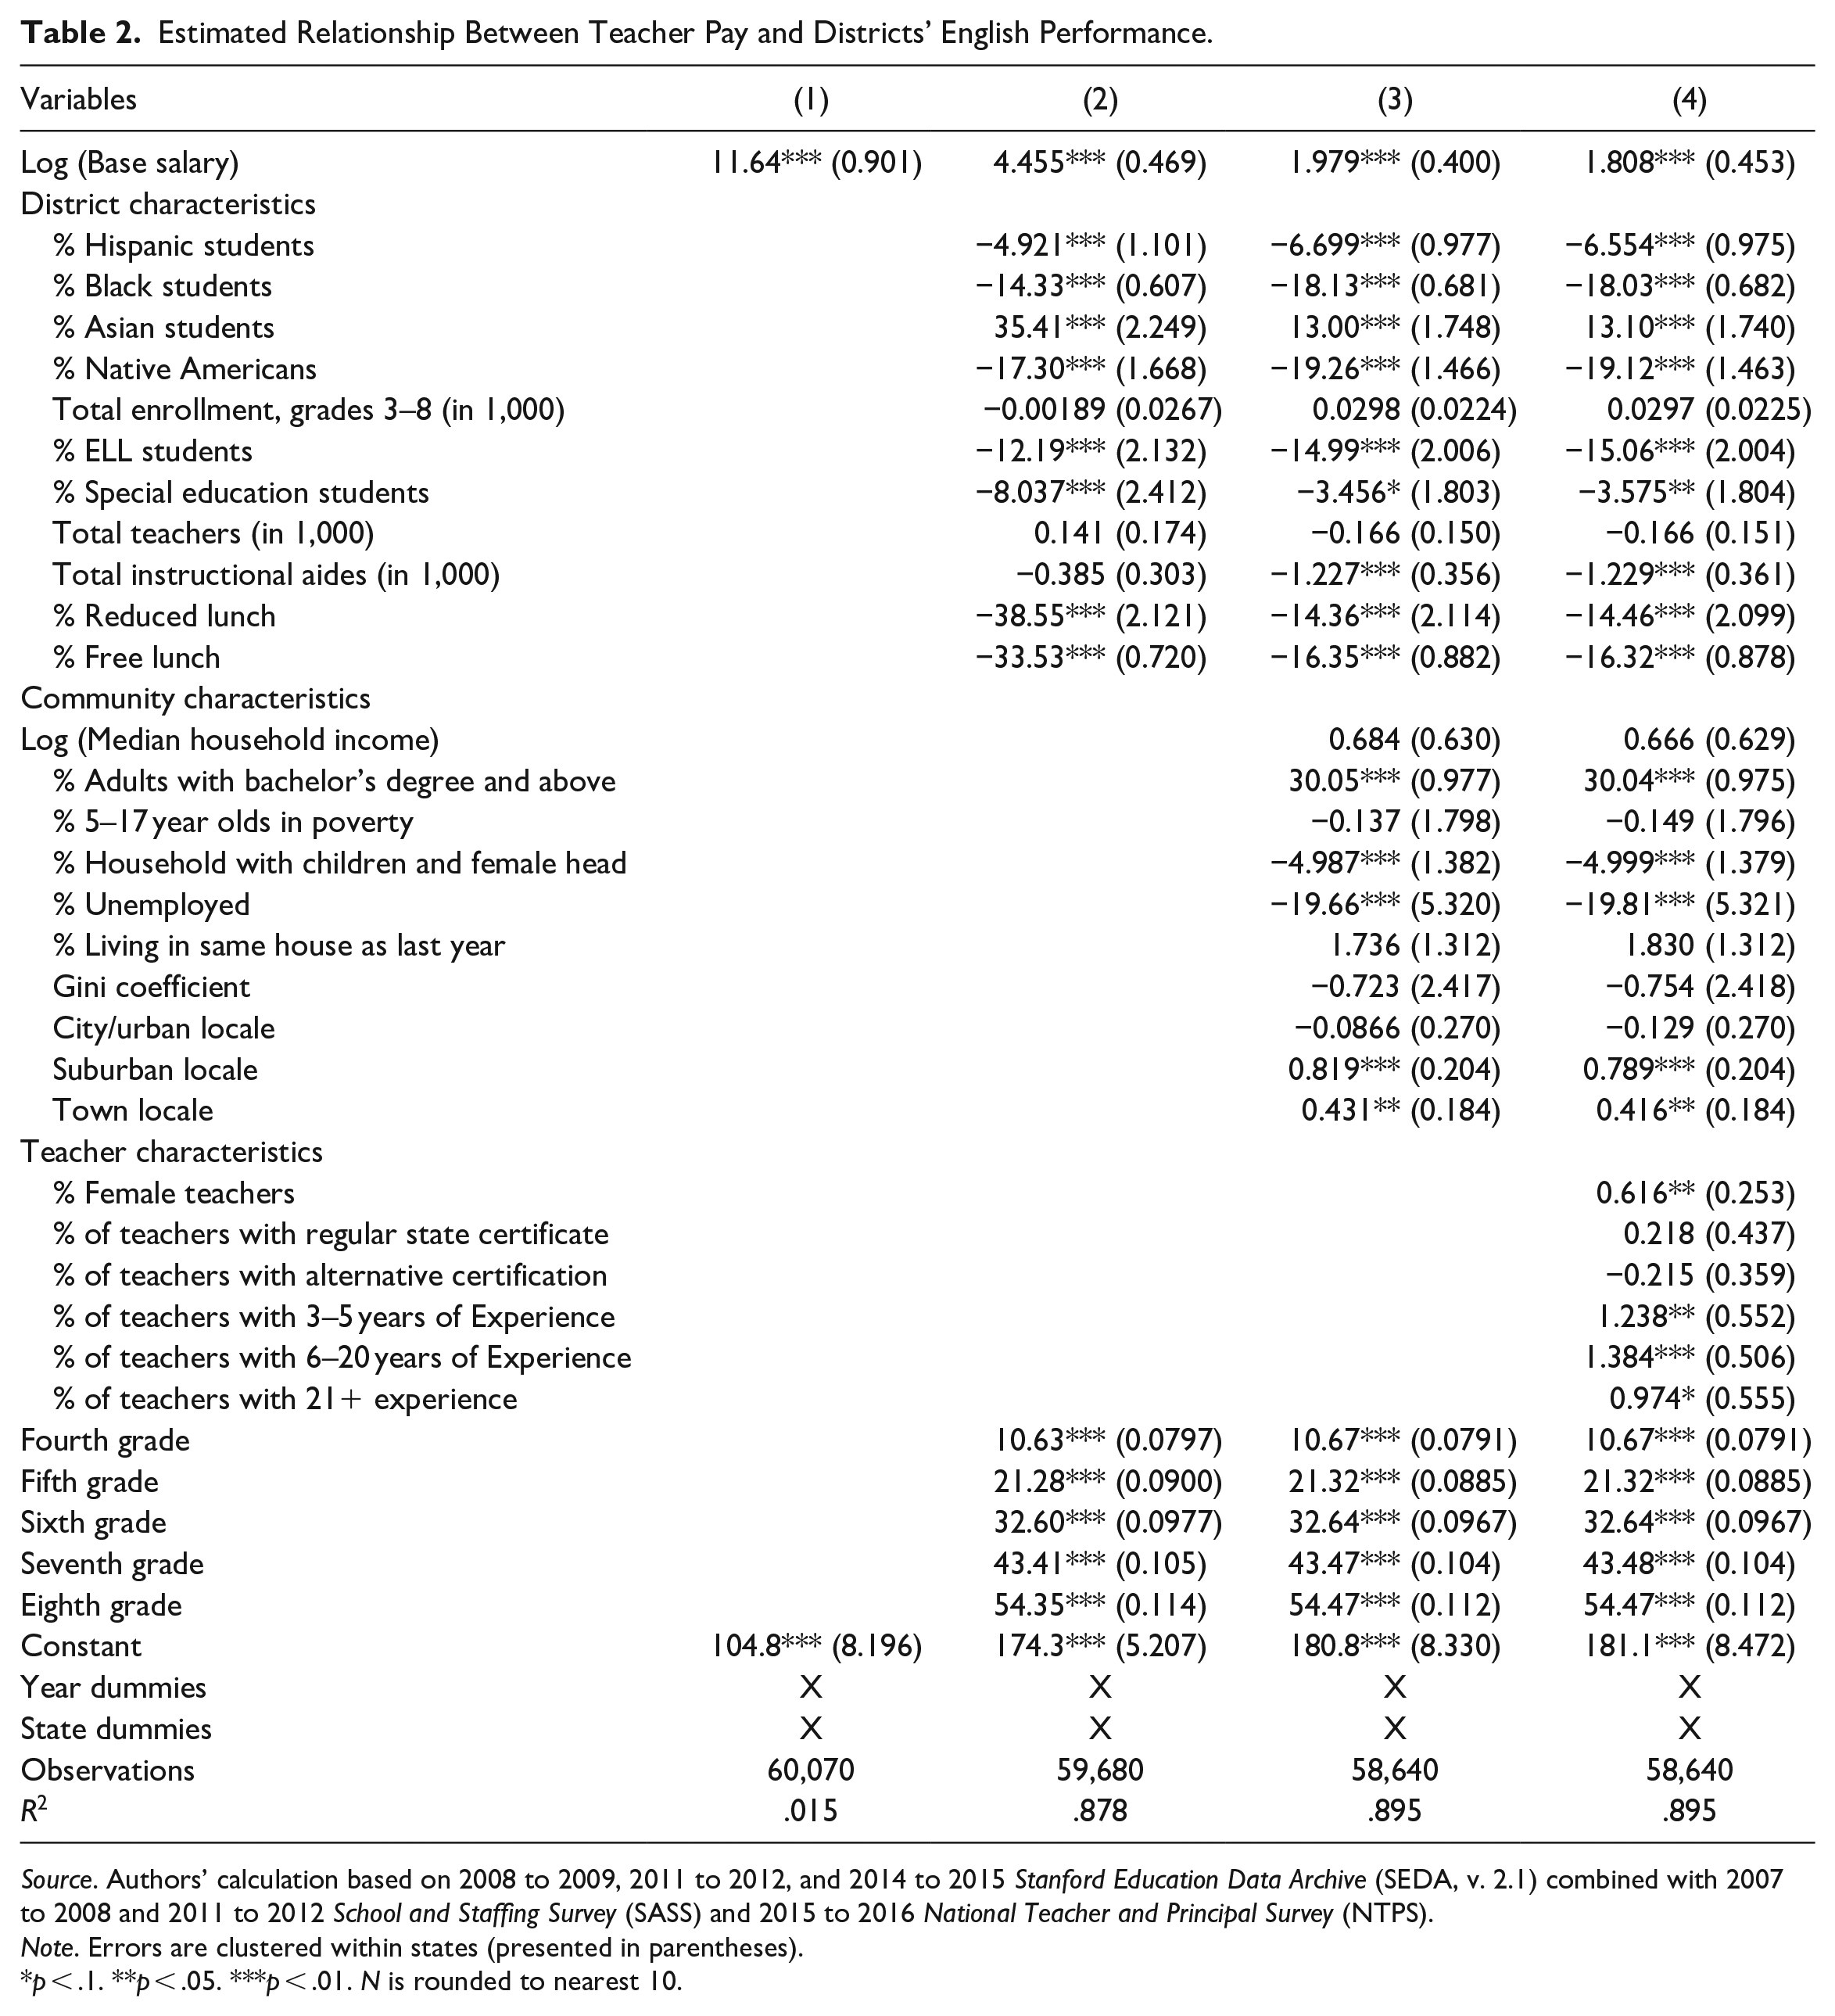
Table 2 shows similar results for English test scores. We find a statistically positive relationship between teacher pay and English test scores. The correlation coefficient in model (1) is 12, which is greater than that for math scores. However, model (4) with full sets of covariates shows almost identical results with math: a 10% increase in teacher salary is linked with a higher average English test score of about 0.2 points.
Estimated Relationship Between Teacher Pay and Districts’ English Performance.
Source. Authors’ calculation based on 2008 to 2009, 2011 to 2012, and 2014 to 2015 Stanford Education Data Archive (SEDA, v. 2.1) combined with 2007 to 2008 and 2011 to 2012 School and Staffing Survey (SASS) and 2015 to 2016 National Teacher and Principal Survey (NTPS).
Note. Errors are clustered within states (presented in parentheses).
p < .1. **p < .05. ***p < .01. N is rounded to nearest 10.
Tables 1 and 2 display that, compared to white students, Hispanic, Black, and Native American students score significantly worse on both math and ELA tests, whereas Asian students perform better. Districts with a higher proportion of English Language Learners (ELL), special education students, and students under free and reduced-price lunch programs tend to score poorly on standardized tests.
Because there may be a trade-off between hiring teachers and hiring instructional aides (paying teachers more while hiring fewer aides or hiring fewer teachers but more aides, etc.), we control for both the number of teachers and aides. The results show that hiring more instructional aides is associated with lower test scores, and this may be partly because some districts are required to hire fewer teachers or pay lower salaries to teachers to maintain their budgets.
Districts with a larger fraction of adults with a higher level of education tend to score higher on these tests, whereas districts with a greater fraction of female-headed households and higher unemployment perform worse.
For math test scores, compared to districts with more novice teachers (with 1–2 years of experience), districts with a greater fraction of early-career teachers (with 3–5 years of experience) perform better. For English, districts with a larger proportion of female teachers and experienced teachers (5 years and above) score significantly higher.
The test scores used in this study are estimated values (with known error variance) of the parameters from different sites, where the true values of those parameters are assumed to vary among those sites. Thus, as a sensitivity test, we also use a meta-analytic regression model to account for known precision in test score estimates (see Reardon et al., 2019 for detailed explanation on this approach). Overall, the alternative results are similar to the previous results. 16
The estimates reported in Tables 1 and 2 solely rely on within-state variation, which is smaller than between-state variation. To capture the full breadth of the variation of teacher salary while still controlling for unobservable commonalities that are shared by districts within each state, we consider multilevel models.
First, to examine if the commonality among districts in the same state is large or small, we estimate intraclass correlation (ρ), which is a summary of the proportion of the outcome variability that is attributable to differences across states. 17 Larger values of ρ (close to 1) imply that districts in the same state behave almost identically. On the other hand, smaller values of ρ (close to 0) signal that the districts in the same state are almost independent from each other, and simple OLS regression could suffice for the analysis.
In our models, we estimate the between-district variance component (
We then conduct the likelihood ratio test, which demonstrates that adding the state-specific intercept into the model improves the fit of the model but the random slope is not necessary. Thus, we treat the effect of teacher salaries similarly for all districts in our teacher-level analysis, and the model estimates a single regression line representing the population average. The district-specific intercept of the model shifts this regression line up or down, maintaining its slope. In our district-level analysis, we consider that all states have similar salary effects, and the model estimates a single regression line representing the population average with state-specific intercepts.
In Table 3, we present the results for mathematics test scores in panel A and English test scores in panel B, estimated with multilevel models. The math results in columns (1) through (3) in Table 3 are comparable to columns (2) through (4) in Table 1. These coefficients for teacher base salary are almost the same, but the standard errors estimated from the multilevel models are about half of those from the state fixed effects models. If we focus on our preferred model specification, which includes all the control variables, the coefficient for teacher base salary is 1.847 in column (3) of Table 3, which is almost the same as the coefficient of 1.827 from column (4) of Table 1.
Estimated Relationship Between Teacher Pay and Districts’ Performance, By Subject Multilevel Mixed Effects Model.

Source. Authors’ calculation based on 2008 to 2009, 2011 to 2012, and 2014 to 2015 Stanford Education Data Archive (SEDA, v. 2.1) combined with 2007 to 2008 and 2011 to 2012 School and Staffing Survey (SASS) and 2015 to 2016 National Teacher and Principal Survey (NTPS).
Note. Errors are clustered within states (presented in parentheses).
p < .1. **p < .05. ***p < .01. N is rounded to nearest 10.
The English results in columns (4) to (6) in Table 3 are comparable to columns (2) to (4) in Table 2. The coefficients for teacher base salary are slightly higher in the multilevel models than those in the state fixed effects model, but they are very similar to each other. Again, the standard errors from the multilevel models are much smaller in the multilevel models.
Both approaches rely on different sources of variation, but they produce surprisingly similar results. This suggests that, once we control for key district and community characteristics, the within-state variation is mostly from the unobservable factors that are common among districts within the same state.
The coefficients for higher grades are larger, partly due to the fact that the means of test scores are greater for upper grades. For example, the mean score of the math scores is 229.8 for the 3rd grades and 283 for the eighth grades. To examine if teacher salary is more or less influential for lower or upper grades of students, Table 4 presents the results broken down by student grade for both math in Panel A and English in Panel B. Section 1 reports the results from the state fixed effects model, and section 2 reports the results from the multilevel models. Again, the two methods produce very similar results. Both approaches show that the positive association between teacher salary and test scores is present across different grades, instead of focused on a certain grade, suggesting that better-paid teachers can raise student performance beyond the early childhood education.
Estimated Relationship Between Teacher Pay and Districts’ Performance, By Grade.

Source. Authors’ calculation based on 2008 to 2009, 2011 to 2012, and 2014 to 2015 Stanford Education Data Archive (SEDA, v. 2.1) combined with 2007 to 2008 and 2011 to 2012 School and Staffing Survey (SASS) and 2015 to 2016 National Teacher and Principal Survey (NTPS).
Note. Errors are clustered within states (presented in parentheses).
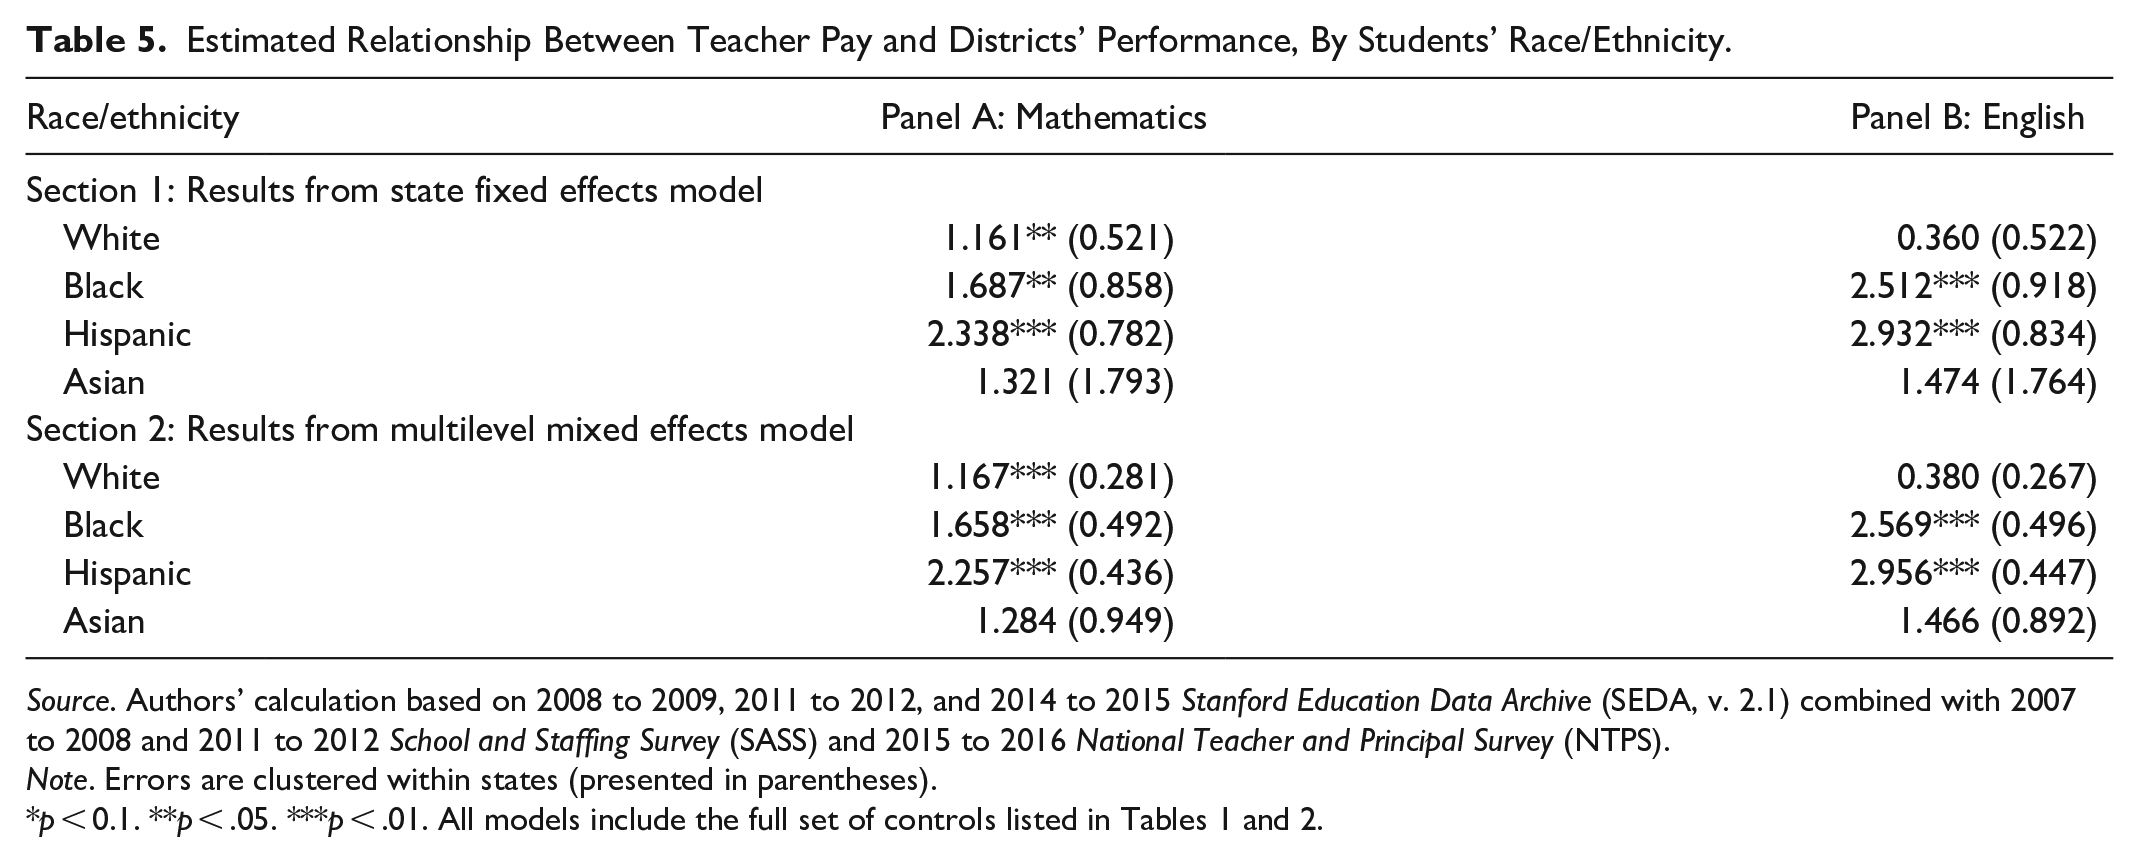
To see if a certain race/ethnicity drives this relationship, we estimate the model separately by race/ethnicity of students. Table 5 presents the results for both Math and English. Both models show that White, Black, and Hispanic students perform better in math when teachers earn a higher salary, whereas only Black and Hispanic students’ English scores rise with higher pay. Overall, Hispanic students are the biggest beneficiaries from higher teacher pay. The findings in Table 5 imply that a higher teacher salary is able to reduce the performance gap between both white and black and white and Hispanic students.
Estimated Relationship Between Teacher Pay and Districts’ Performance, By Students’ Race/Ethnicity.
Source. Authors’ calculation based on 2008 to 2009, 2011 to 2012, and 2014 to 2015 Stanford Education Data Archive (SEDA, v. 2.1) combined with 2007 to 2008 and 2011 to 2012 School and Staffing Survey (SASS) and 2015 to 2016 National Teacher and Principal Survey (NTPS).
Note. Errors are clustered within states (presented in parentheses).
We also conduct the separate analyses across different SES of districts to investigate whether the relationship between teacher pay and district performance is generic or distinctive for different SES status. We use a SES index variable, constructed as the first principal component factor score of the measures such as median household income, percent of adults with a bachelor’s degree or higher, single mother-headed household rate, food-stamp receipt rate, poverty rate, and unemployment rate (Fahle et al., 2018). Based on the SES index, we define High-SES group as districts in the top 25% of the SES distribution, Mid-SES group as districts in the middle 50% (25% to 75% of the distribution), and Low-SES group as the bottom 25%.
Table 6 demonstrates the significantly positive relationship between teacher salary and student performance for both High-SES and Mid-SES districts, with a greater magnitude in the High-SES group. A 10% increase in teacher salary is associated, on average, with about a 0.25 points higher math score and a 0.3 points higher English score in the High-SES districts. In the Mid-SES districts, a 10% increase in teacher salary is associated with about 0.15 points higher Math and English scores. For both Math and English, the association between teacher pay and test scores is positive but statistically insignificant in the Low-SES districts. The heterogenous effects by SES are consistent with Han and Maloney (2022) who find significantly positive union effects on test scores in the Mid-SES districts but insignificant union effects in the Low-SES districts.
Estimated Relationship Between Teacher Pay and Districts’ Performance, By Districts SES Status.

Source. Authors’ calculation based on 2008 to 2009, 2011 to 2012, and 2014 to 2015 Stanford Education Data Archive (SEDA, v. 2.1) combined with 2007 to 2008 and 2011 to 2012 School and Staffing Survey (SASS) and 2015 to 2016 National Teacher and Principal Survey (NTPS).
Note. Errors are clustered within states (presented in parentheses).
Our finding that teacher salary has no statistically significant association with test scores in the Low-SES districts suggests that there may exist some threshold of educational environment for teachers to be able to influence student outcome. If so, it may be necessary to equip those disadvantaged districts with sufficient resources and community settings and to combine these efforts with other education initiatives that are complementary to teacher salaries, enabling teacher pay to advance student learning and to address equity concerns.
Districts with strong teachers’ unions tend to pay more to their teachers and increase the usage of other school inputs. For a robustness check, we control for districts’ union density. The alternative results are very similar to those present in Tables 1 through 6, suggesting that higher salary genuinely influences educational outcome, regardless of the strength of teachers’ unions.
To the extent that teacher pay is correlated with teaching experience, our estimates of teacher base salary may be biased. When we drop the district-level variables for teaching experience (i.e. percent of novice teachers and early-career teachers) as a robustness check, however, the alternative results are almost the same as before.
If a district faces greater competition with charter schools and loses its best students to them, the OLS regression will produce biased estimation. Moreover, some charter schools do not follow the pay schedules of their districts; rather, they establish their own pay scheme for individual teachers, which tends to be lower than what the traditional public schools offer. To address these issues, we add the percent of students in charter schools as an additional control variable. The alterative results remain almost the same.
Our multilevel models do not include state dummies, so one may be concerned with the potential bias due to between-state variation. Because our analysis includes numerous covariates at the district level, most of the between-state variation is likely to be captured by those variables. Nonetheless, as a final robustness check, we also control for two state-level variables that we bring from the data provided by the U.S. Bureau of Economic Analysis (BEA): state population from years 2009, 2012, and 2015 and the GDP growth rate from years 2008 to 2009, 2011 to 2012, and 2014 to 2015. The alternative results after controlling for these two variables are almost identical to those presented in Table 3, and the coefficients for these variables are not statistically significant.
Discussion
One of the key findings of our study is that a higher teacher salary is associated with a reduction in educational inequality between white and black, as well as white and Hispanic students, because the estimated relationships are stronger for minority students, except for Asian students. Considering the close link between educational inequality and income inequality (Chetty et al., 2014), our study suggests that raising teacher salary is linked to a decreased performance gap across different racial groups of students and higher intergenerational mobility for minority families in the long run.
Districts that provide higher teacher compensation are better able to attract high-quality teachers and retain them in schools. Moreover, teachers’ morale and enthusiasm are more likely to be higher when they are paid more. Echoing the benefits of higher teacher pay, advocates for the pay-for-performance system urge an increase in the compensation of teachers based on their productivity, measured by educational outcomes of their students. However, our study finds that universal and unconditional increase in teacher base salary (i.e., across-the-board base salary increases), regardless of student performance or any supplementary compensation tied with educational outcomes, is associated with improved districts’ academic performance. In particular, if districts are to adopt a merit pay system at the expense of reducing base salaries to balance the budget, we predict, based on our results, that their educational outcomes may suffer, rather than improve.
Our estimates on salary effects concern all students (nationally representative sample of all school districts). The gain is relatively small (between 1 and 3 test score points, depending on the racial/ethnic group and grade), but it applies to the general student population, potentially producing a large accumulated gain over the entire student body in the country. The coefficients are always positive and statistically significant for most subgroups, and no subgroup shows negative salary effects. Moreover, the results in this study may be a lower bound estimate for the influence of teacher salaries on performance because our samples are incumbent teachers (i.e., a static sample). If the new policy intervention is to raise teacher salary significantly, we are not taking into account any potential changes in the composition of teachers that may occur driven by new teachers coming into the profession and the relative credentials of the teaching workforce over time. With a significantly higher teacher salaries, according to the channels reviewed above, schools would be able to retain and attract highly qualified teachers, and help build a relatively stronger teaching workforce. Eventually, the long-run effect of higher base salaries on district performance may be larger than the short-run effects that we estimate in this study.
Our findings suggest that a substantial increase in teacher pay may be needed for a significant and sustained improvement in student performance. This is aligned with the argument by Temin (2002) that a small increase in teacher pay may not result in a meaningful improvement. By presenting the multiple equilibria of the US teachers’ labor market based on Akerlof’s “Lemon” model, Temin argues that the US cannot escape from an inferior equilibrium, where lower teacher pay is matched with teachers with low productivity, unless districts pay substantially more to teachers.
It is noteworthy that there exists a large variance in teacher base salary within each state, and the within-state variance greatly differs by state. Overall, the variance in teacher base salary tends to be larger in pro-union states than in anti-union states. For instance, the variance is about $12,000 in California, which is approximately 25% of its average teacher base salary. On the other hand, the variance is about $5,000 in South Carolina, and it is around 10% of its average teacher base salary. Thus, a 10% increase in the teacher base salary may be considered as substantial in South Carolina but not in California.
Most analyses of student performance and school effectiveness in elementary schools find that household and neighborhood conditions outweigh the effects of specific school characteristics. Indeed, the positive association between teacher salary and district performance we have identified in this study is modest in magnitude. Nevertheless, our study finds that teacher salary significantly correlates with increased English test scores, which is harder to raise than math test scores, demonstrating that changing the educational inputs in a proper way can improve student outcomes, and educators and policy makers should continue to search for the most effective intervention for that goal.
Conclusion
This research draws on evidence from a rich data set linking district performance on achievement test scores to average teacher base salary nationwide. We employ two identification strategies: state fixed effects and multilevel mixed effects linear models.
Our findings consistently show a significantly positive association between teacher base salary and districts’ performance. We find that both mathematics and English test scores are significantly higher in districts that offer a higher base salary to teachers, compared to those in districts with a lower teacher base salary. In both state fixed effects and multilevel models, we find that a 10% increase in teacher salary is associated with an increase of about 0.2 points in test scores in both subjects. The association between teacher salaries and performance is more intense in higher grade-levels than in lower grade-levels. Overall, these findings shed light both on how improving teacher pay directly correlates with student performance and on existing debates on policies seeking teacher compensation reforms.
We also find that higher teacher salaries are associated with the reduced achievement gap between white and black, and between white and Hispanic students, because the coefficient is greater for minority students (except for Asian students). There exists a significantly positive relationship between teacher salary and student performance for the districts with high- and medium-level socioeconomic status, but not in the districts with low socioeconomic status.
Even with the state fixed effects and multi-level models, we are not able to make a causal claim of our findings, because we cannot fully account for all of the confounding factors (both observable and unobservable) at the district level due to the limitation of cross-sectional data. One such factor is districts’ general political attitude toward public education. Districts that are more likely to adopt public policies will allocate more resources to public education, raising teacher pay while influencing student performance. Based on the similar results from two very different methods, however, our estimates appear to offer strong evidence on the positive relationship between teacher salaries and district performance.
Our study utilizes standardized test scores to assess student performance in districts. It is noteworthy that literature is not in consensus regarding whether the test score is the single most important measurement for educational outcomes, and there may be other metrics that can better capture educational success. Therefore, exploring different measures of student outcomes is an important task in examining the effect of teacher compensation on public education. This subject is left for future study.
Supplemental Material
sj-docx-1-sgo-10.1177_21582440221082138 – Supplemental material for Teachers’ Base Salary and Districts’ Academic Performance: Evidence From National Data
Supplemental material, sj-docx-1-sgo-10.1177_21582440221082138 for Teachers’ Base Salary and Districts’ Academic Performance: Evidence From National Data by Emma García and Eunice S. Han in SAGE Open
Footnotes
Acknowledgements
We thank the National Center for Educational Statistics (NCES) for kindly providing us with the data. We also thank the National Bureau of Economic Research (NBER) and the Economic Policy Institute (EPI) for providing us with the necessary facilities and assistance. We appreciate John Schmitt’s comments on an earlier version of this manuscript.
Declaration of Conflicting Interests
The author(s) declared no potential conflicts of interest with respect to the research, authorship, and/or publication of this article.
Funding
The author(s) received no financial support for the research, authorship, and/or publication of this article.
Supplemental Material
Supplemental material for this article is available online.
Notes
References
Supplementary Material
Please find the following supplemental material available below.
For Open Access articles published under a Creative Commons License, all supplemental material carries the same license as the article it is associated with.
For non-Open Access articles published, all supplemental material carries a non-exclusive license, and permission requests for re-use of supplemental material or any part of supplemental material shall be sent directly to the copyright owner as specified in the copyright notice associated with the article.