
Abstract
Campus spatial organization has potential impact on the multidisciplinary innovation (MDI). This research aims to establish an evaluation theory and a method for MDI adaptability of campus spatial organization. Based on the literature review, it first proposes theoretical assumptions regarding the correlation among MDI abilities, social networks, and spatiotemporal behaviors of individuals on campus. Then, data on the three aspects mentioned above was collected through online survey which was conducted from February 4th to March 15th, 2020. A total of 524 valid responses were obtained from 572 undergraduates and graduates of various majors in Zijingang Campus (East) of Zhejiang University. The correlation mechanism of these aspects was empirically analyzed by structural equation model (SEM). By integrating individual data, the research generated three overall networks whose nodes are linked according to spatial proximity, behavior routine, and disciplinary connection, respectively. Furthermore, an evaluation method is proposed for MDI adaptability of the campus spatial organization, which is based on the comparison of the structural similarity of the nodes in different networks. Accordingly, the evaluation results were validated by expert ratings and user satisfaction. Finally, design strategies for the renovation of an innovative campus are discussed.
Keywords
Introduction
Multidisciplinary innovation (MDI) indicates knowledge creation and dissemination activities involving two or more disciplines that go beyond a single subject boundary. which has become an important way to enhance the innovation ability of universities (Hero & Lindfors, 2019; Leahey & Barringer, 2020; Turner et al., 2015). Nevertheless the corresponding campus design theory is obviously lagging behind, and scientific basis is insufficient for the design strategies for the innovative campus (Magdaniel et al., 2018; Qiu, 2014; Taylor, 2010). One of the key issues that need to be scientifically recognized is whether or how the organization of functional blocks on the campus could affect MDI—that is, the spatial organization design of the innovative campus.
The difficulty in understanding this issue is that innovation activities cannot be directly related to space design. It needs to be observed through the perspective of space users and should also include social and behavioral aspects. Innovative social networks are not only a measure of a group’s ability to innovate (Desmarchelier et al., 2020; Gewehr et al., 2017), but are also the basis of social relationships among individuals for information sharing, R&D cooperation, and technological complementarity (Jokisaari & Vuori, 2014; Lombardi et al., 2020; Yu et al., 2020). Innovation networks are formed through communicative activities (Iturrioz et al., 2015); Besides, individual behavior has certain spatiotemporal characteristics. In different spatial layout patterns, there are differences in the frequency and degrees of group communicative activities, which then leads to changes in the composition of social networks of individuals or their groups (Doreian & Conti, 2012; Mousavinia et al., 2019). Therefore, the society, the behavior, and the space on campus are interconnected. The analysis of the relationship among the three elements is a prerequisite for exploring the space layout of an innovative campus.
Concerning the innovative campus design, previous studies have mainly focused on four aspects. Some researchers (Coulson et al., 2018; Hoeger, 2007; Qiu, 2014; Taylor, 2010) have analyzed and summarized design strategies based on case studies. Other researchers have discussed the use of “diagnosis” and “coordination” to create an “organic order” for campus planning based on built environment evaluation (e.g., Alexander, 1975; ASSHE, 2019; Eckert, 2014). From the perspective of the social network, Sailer et al. showed that spatial layout is an important factor in forming interpersonal relationships (Sailer, 2011; Sailer & McCulloh, 2012), whereas Wineman et al. (2009) analyzed the influence mechanism of spatial layout on social network structure and innovation performance in innovative organizations. Furthermore, studies on environmental behaviors have summarized the environmental requirements compatible with the behavioral characteristics of collaborative innovation (e.g., Kamruzzaman et al., 2011; Li, 2016). Given the advantages of these studies, the following deficiencies were identified and could hardly be ignored. Firstly, there is a lack of in-depth and focused research on the association mechanism of innovative space and social community at mesoscale. Secondly, the social network is ignored as the basis for MDI activities. Thirdly, more quantitative analysis should be carried out in balance with much qualitative analysis which has been conducted in previous studies. Fourthly, the conclusions of empirical research are not well translated into design methods, tools, or strategies.
Thus, the aims of this research are as follows:
(1) To analyze the relationship between MDI and the campus spatial organization.
(2) To propose a method to evaluate the MDI adaptability of university campuses.
The innovation and contributions of this research are as follows:
(1) Establish a theoretical framework which links MDI and campus spatial organization by integrating the individual and overall networks perspectives.
(2) On the basis of network structure similarity, propose and verify an MDI adaptability evaluation method for campus spatial organization.
Through the literature review, the study established the theoretical framework of linking MDI performance and campus space layouts, and it proposed the hypotheses of the correlation among MDI ability, social networks, and behavioral characteristics of individuals on campus. Next, with an online questionnaire survey, relevant data of respondents in the Zijingang campus were collected. Subsequently, the hypotheses were verified and analyzed by the structural equation model (SEM). Based on the superposition of individual data, three overall campus networks of space organization, behaviors, and disciplinary connections were established and analyzed. Furthermore, based on the structural similarities of nodes among different networks, we proposed an evaluation method for the MDI adaptability of campus spatial organization. Finally, the evaluation results of the Zijingang campus were verified by expert scoring and user satisfaction.
Literature
Theoretical Framework
Research on campus MDI adaptability requires two intermediary factors to form a complete logical chain—namely, social networks and behavioral features. Their interaction is reflected in two interrelated levels (Figure 1). For individuals, interpersonal relationships need to be developed in various types of communication activities. Furthermore, MDI behavior is affected by established social relationships. These two aspects are mutually causal. In addition, the quality and the scale of an innovative social network can determine individuals’ innovation ability. From a global perspective, the overall social networks and behaviors on campus are composed of individual social relationships and behavioral features. The general spatial organization of a campus may restrict or promote the overall social network development and innovation capability by affecting the behavioral features of different disciplinary groups on the campus.

Interaction of innovative society, behavior, and space on campus from the network perspective.
Individuals’ MDI Ability, MDI Network, and Spatiotemporal Behavior
MDI ability
MDI ability refers to the comprehensive quality of a person to engage in interdisciplinary research activities (Lattuca et al., 2013; Zhang et al., 2020;). This ability is mainly reflected via two aspects—as achievements and potential (Hero et al., 2021). For individuals (students and researchers) on campus, MDI achievements include published papers, and participation in scientific research projects, and involvements in activities of different disciplines. The potential of MDI can be examined in terms of innovation desire, enthusiasm, or motivation (Hunter et al., 2011). According to Claus and Wiese (2019), interdisciplinary work offers both innovative potential and challenges in collaboration. Thus, the performance of interdisciplinary innovation is considered to have a positive effect on one’s potential for MDI.
MDI network
MDI network refers to a person’s interpersonal relationship basis for interdisciplinary research, which is mainly manifested in two aspects: the scale and quality of the network (Rafols & Meyer, 2010; Zhang et al., 2020). A study by Zhang et al. (2020) indicated that researchers with more co-authors in different fields tend to have a higher centrality in multidisciplinary collaborative network. For individuals, the scale of their MDI network, that is, the number of network nodes, includes the number of existing and potential research collaborators, whereas the quality of the network can be measured by the ratio of high-level and long-term collaborators as well as the overall benefits derived from the network (Assimakopoulos, 2007). When one has more interdisciplinary relations, his or her network is more likely to evolve into a high quality one (Rafols & Meyer, 2010). Numerous studies (e.g., Castilla et al., 2020; Slotte–Kock & Coviello, 2010;) have shown that the quantity and the quality of MDI network nodes are highly correlated.
Relationship between MDI ability and the network
Persons with more interdisciplinary collaborators have a higher potential for innovation than those with fewer interdisciplinary collaborators (Assimakopoulos, 2007). Through interdisciplinary collaborators, people gain more information, beliefs, and support (Castilla et al., 2020), have a better research atmosphere, and consequently are more enthusiastic about innovation. Accordingly, they will consider MDI to be of more value and feasibility (Cho et al., 2007). In particular, when the quality of MDI network nodes is higher, this tendency is more distinctive (Rafols & Meyer, 2010). Xie et al. (2016) found that the presence of network size, network tie-strength, and network centrality determined the level of knowledge transfer performance. Bai et al. (2021) indicated that establishing a long-term fixed relationship with someone more competitive was the basis for interdisciplinary innovation activities.
Similarly, people with more interdisciplinary collaborators, owing to better support, generally have better innovations and higher quality of innovations than people with fewer interdisciplinary collaborators (Assimakopoulos, 2007; Stark et al., 2020). If people carry on long-term scientific research cooperation with many collaborators at a level higher than themselves, their level of achievements is improved further (Bai et al., 2021; Rafols & Meyer, 2010 ). Through an empirical study, Cho et al. (2007) demonstrated that the social network considerably influences the learners’ performance in collaborative learning. The studies of Stark et al. (2020), Yan et al. (2018), and Shu et al. (2012) showed that good social relationships can be conducive to efficient output both in terms of interdisciplinary innovative individuals and collaborative innovative enterprises. Hero and Lindfors (2019) believed that innovation was promoted by teamwork, multidisciplinary collaboration and external partnerships. Zhang et al. (2020) argued that a scientific entity’s status of co-author network could reflect its significance, capacity of knowledge integration, and knowledge diffusion.
Spatial and temporal behavior
The temporal and spatial characteristics of human behavior are correlated, which may also be involved in innovative activities. For example, the studies of Farber et al. (2014) and Jiron and Carrasco (2020) argued that the longer an individuals’ social activity time was, the more spatial points that they could reach, and the more diverse spatial types that these activities could reach. In most universities, the division of space is based on disciplines, and different faculties are set up in relatively independent spaces. Thus, MDI activities take place in different time and space. Different discipline spaces provide different equipment and information to stimulate innovative activities and people’s network connections (Qiu, 2014). Within a certain time and space, the temporal characteristics of behavior can be expressed by total time length, frequency, and uniformity, whereas the spatial characteristics of behavior can be expressed by the total amount of space reached, number of types, and uniformity of spatial distribution (Jiron & Carrasco, 2020; Zhang & Thill, 2017).
Relationship between MDI network and spatiotemporal behavior
Li and Lin (2018) confirmed the relationship between human social network and spatiotemporal behavior patterns through simulation research. Previous studies (e.g., Doreian & Conti, 2012; Jiron & Carrasco, 2020; Wineman et al., 2009; Zhang & Thill, 2017) have also confirmed a corresponding relationship between the spatial distribution of people’s activities and their social network. On a university campus, interdisciplinary partnerships usually need to be generated and developed through face-to-face interactions (Farber et al., 2014; Qiu, 2014). Winks et al. (2020) stated that spaces on campus were made social through their various uses, and many spaces required activating through the promotion of activities conducive to peer support and networking. Magdaniel et al. (2018) argued that the development of physical infrastructure connecting the different functions on campus allows opportunities to have more and diverse people with chances for interaction and sharing knowledge. Hence, the more interpersonal activities a person participates in, the more friends they are likely to make (Chang & Zhu, 2011). People with different subject backgrounds on campus tend to study and socialize in certain areas. To exchange information and establish contact with people from distinct disciplines, one needs to a frequent visitor to these places to have opportunities to increase the number of potential collaborators in the exchange. Therefore, the characteristics of individual MDI networks on campus will also be reflected in the time and space distribution patterns of participating in MDI activities. Conversely, when a person has more networked friends, to maintain these cooperative relationships, the time and space intensity of participating in interdisciplinary activities will be more and higher.
Similarly, when a person spends more time and effort to participate in various activities, one is more likely to establish long-term and stable cooperative relationships, and gradually establish contact with the elites in the industry through network expansion (Kim et al., 2018). Hagiladi and Plaut (2021) found that five variables were related to predicting the tie strength of social network, including meeting duration, distance of meeting place from residence, transport means, and travel duration to the meeting. By investigating the campus space users, Yun et al. (2018) argued that the possibility of open innovation creativity based on tacit knowledge arose when meeting and communicating with others. He held the opinion that it was possible to activate open innovation on campus with good use of space design. On a campus, MDI activity allows for the formation of quality ties with senior students or professors. If it is a case of spontaneously seeking to form an interdisciplinary cooperation network, instead of activities organized by the administration (e.g., an interdisciplinary course program), these high-level collaborators will often not appear due to their own initiative, but they can only be encountered on varied occasions at different places. In contrast, having more important figures in the network motivates an individual to spend time and energy to keep in touch with them or to develop relationships with new high-quality collaborators (Moore et al., 2013).
Relationship Between the Overall Networks of Social, Route, and Space
Previous studies on space layouts (e.g., Burger et al., 2014; He, 2014; Suckley & Dobson, 2014) have demonstrated that spatial nodes, such as cities, urban blocks, and rooms, can be connected in different ways, such as proximity, transportation, and social relations to form different network structures. The network analysis method allows for the comparison of the characteristics of the overall structure of different networks and the structural characteristics of the same node in different networks (Everett, 2002). Since the behavioral activities and social relations as node connections are typically based on the statistics of the group sum, the overall network obtained based on the above method can reflect certain characteristics of the group in the spatial dimension (Liu & Derudder, 2013; Sevtsuk & Kalvo, 2018). Thus, networks analysis can bring a new paradigm to research on innovative campuses from the perspective of linking “macro society” with “micro individuals.”
Existing studies have shown that the spatial network, its social relationship network, and its behavioral network influence each other. Sailer and McCulloh (2012) believed that spatial layout is a critical factor in forming interpersonal relationships. Wineman et al. (2009) analyzed the influence mechanism of spatial layout on the social network structure and innovation performance in innovative organizations. Doreian and Conti (2012) used five empirical networks to posit that both social and spatial contextual features can impact the network formed within them. Suckley and Dobson (2014) identified key changes in the social connections that can be defined by spatiality in a university research department.
The similarity of the network structure can be used to illustrate the adaptability of the spatial structure to certain group characteristics. In previous studies, the comparison method of overall network similarity has been used more often at the macro scale, such as the matching degree of a trade level and regional centrality of different cities (Burger et al., 2014; Pflieger & Rozenblat, 2010). Some urban designers also argue that the matching between networks of social connections, public spaces, and public activity is an aspect that cannot be ignored in space design (He, 2014; Sevtsuk & Kalvo, 2018). Therefore, the similarity comparison of network structures may also be used to measure the innovative adaptability of land use patterns.
Methodology
Case Description
After the university enrollment expansion policy at the beginning of this century (MOE of PRC, 2020), China experienced a short-term and large-scale construction boom. Extensive development has brought about many problems in terms of resource utilization, function configuration, and spatial scale (Chen & Ren, 2015). At present, many university campuses lack vitality due to their rigid and scattered functional zoning. It is difficult to meet the needs of multidisciplinary communication and innovation.
Located in the northwest of Hangzhou, the Zijingang Campus (east) of Zhejiang University (Figures 2 and 3) is one of the most important milestones of the initial development of China’s new campus construction. Zhejiang University is one of the top research universities in China. So, the Zijingang campus was set as an example and has great influence on campus design in China. The campus is about 2.2 km long from north to south and 1 km wide from east to west. Currently, more than 25,000 students are living at this location (Zhu, 2011). Nevertheless, it is continually criticized from the experts and space users because its large size and strict functional zoning created long traveling distances (Yu & Wang, 2008). In fact, due to the long distances and strict zoning, an obvious phenomenon of traffic “waves” appeared (Zhu et al., 2004). This research takes the Zijingang campus as an example because it is typical of current Chinese university campuses.

Location of Zijingang campus.
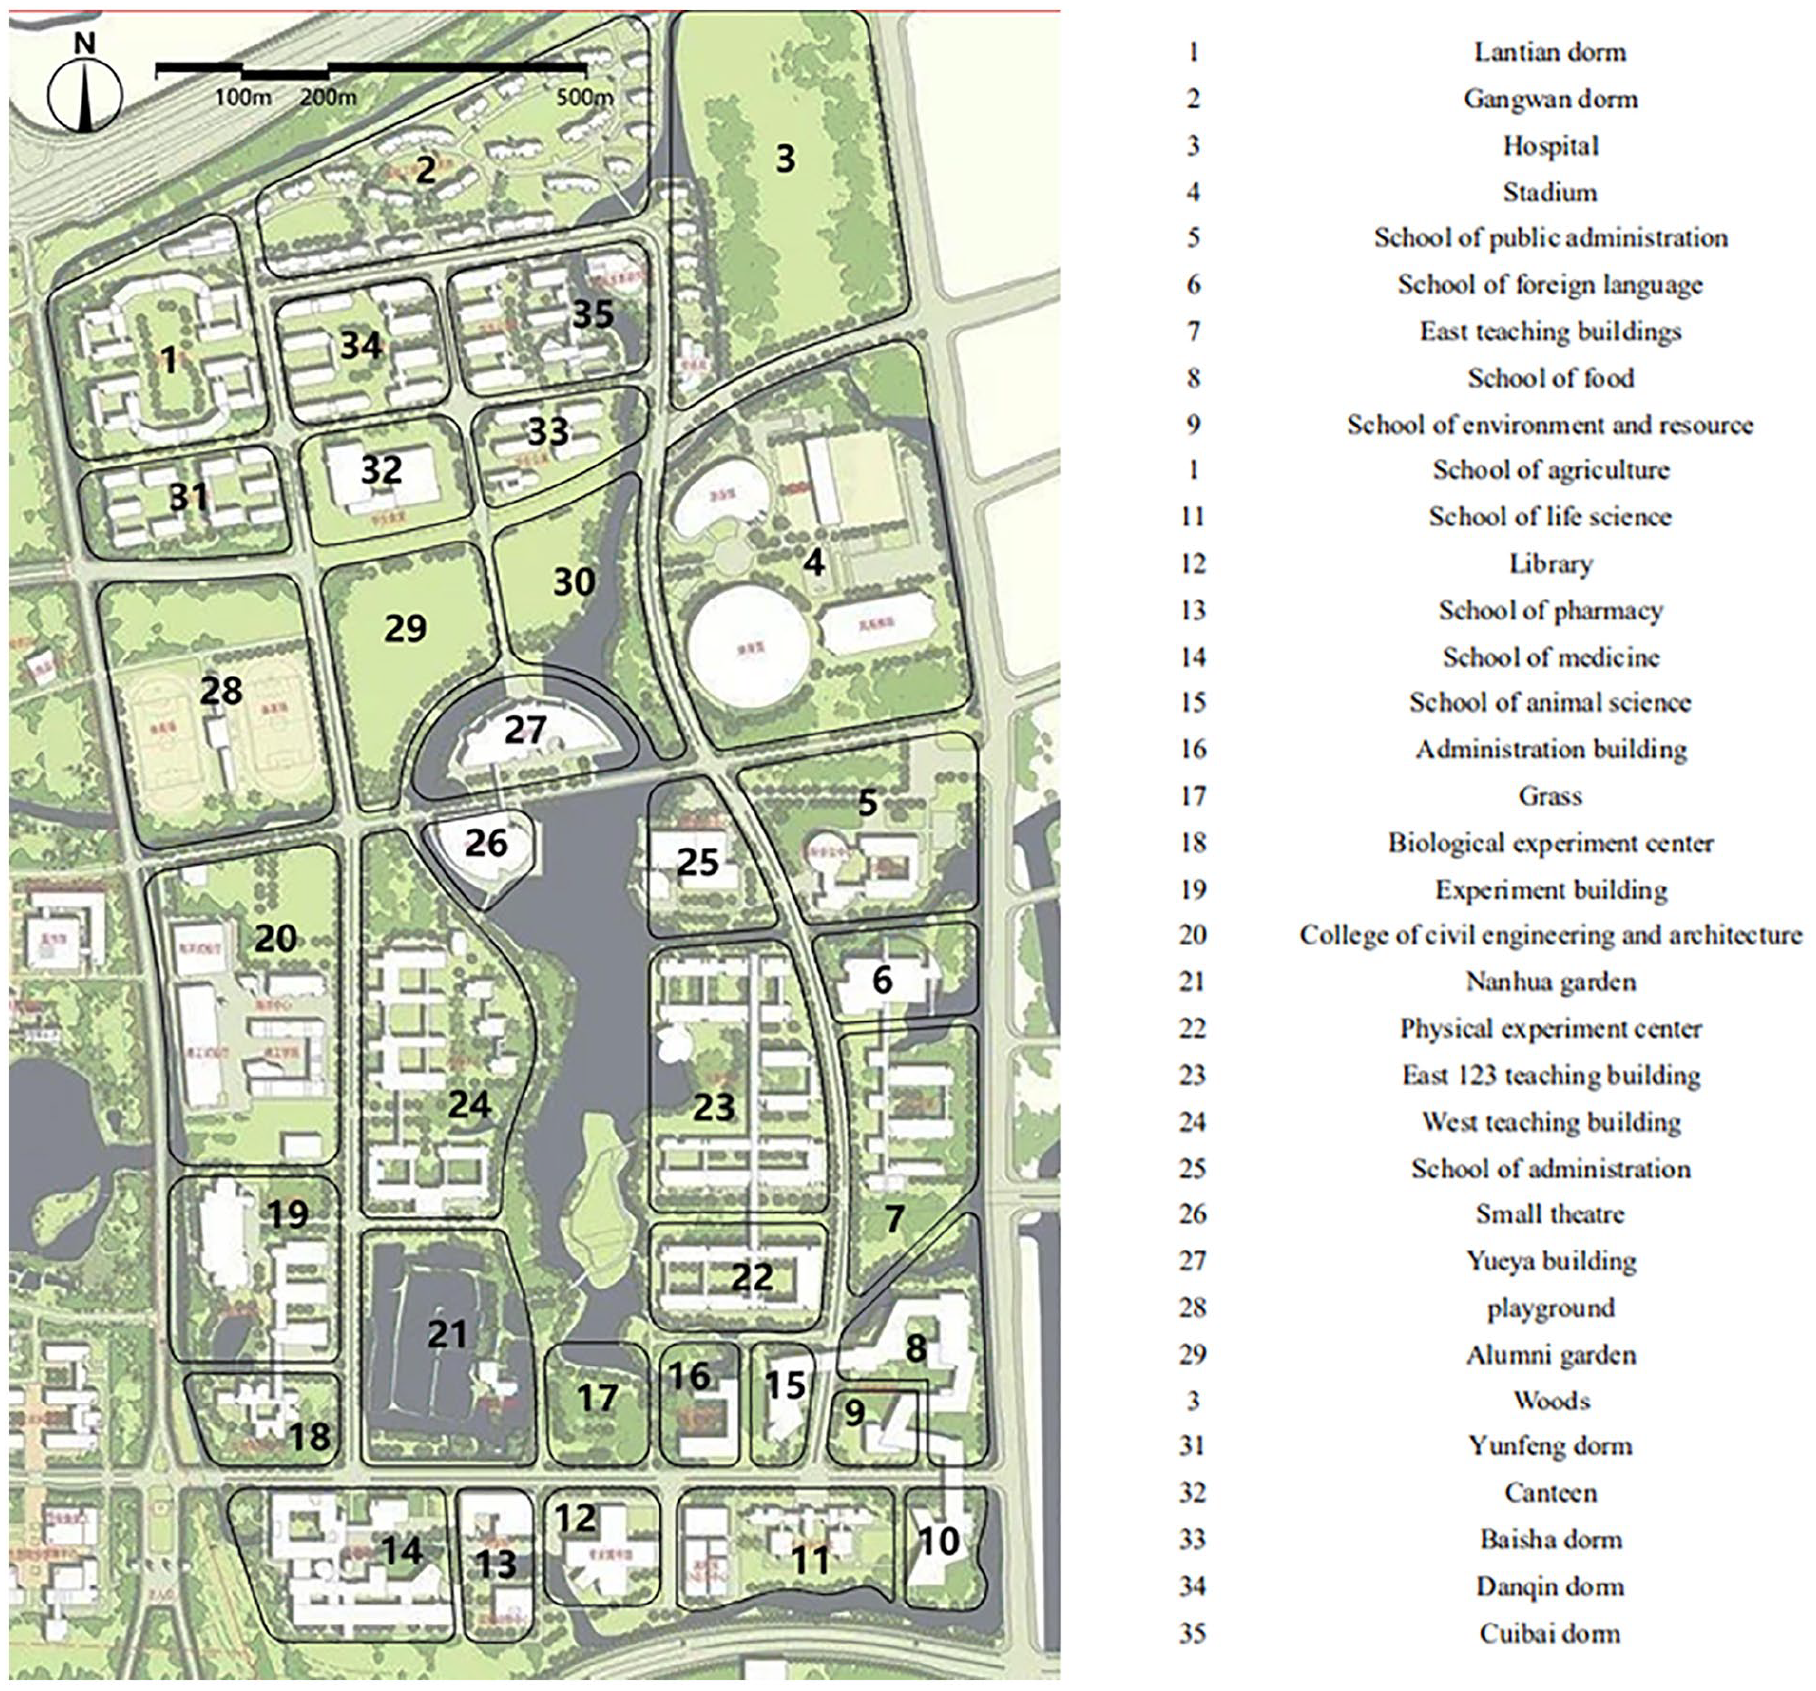
The spatial layout of Zijingang campus, adpated from the design scheme of Architecture Design & Research Institute of Zhejiang University Co. Ltd.
Survey Method
Questionnaire
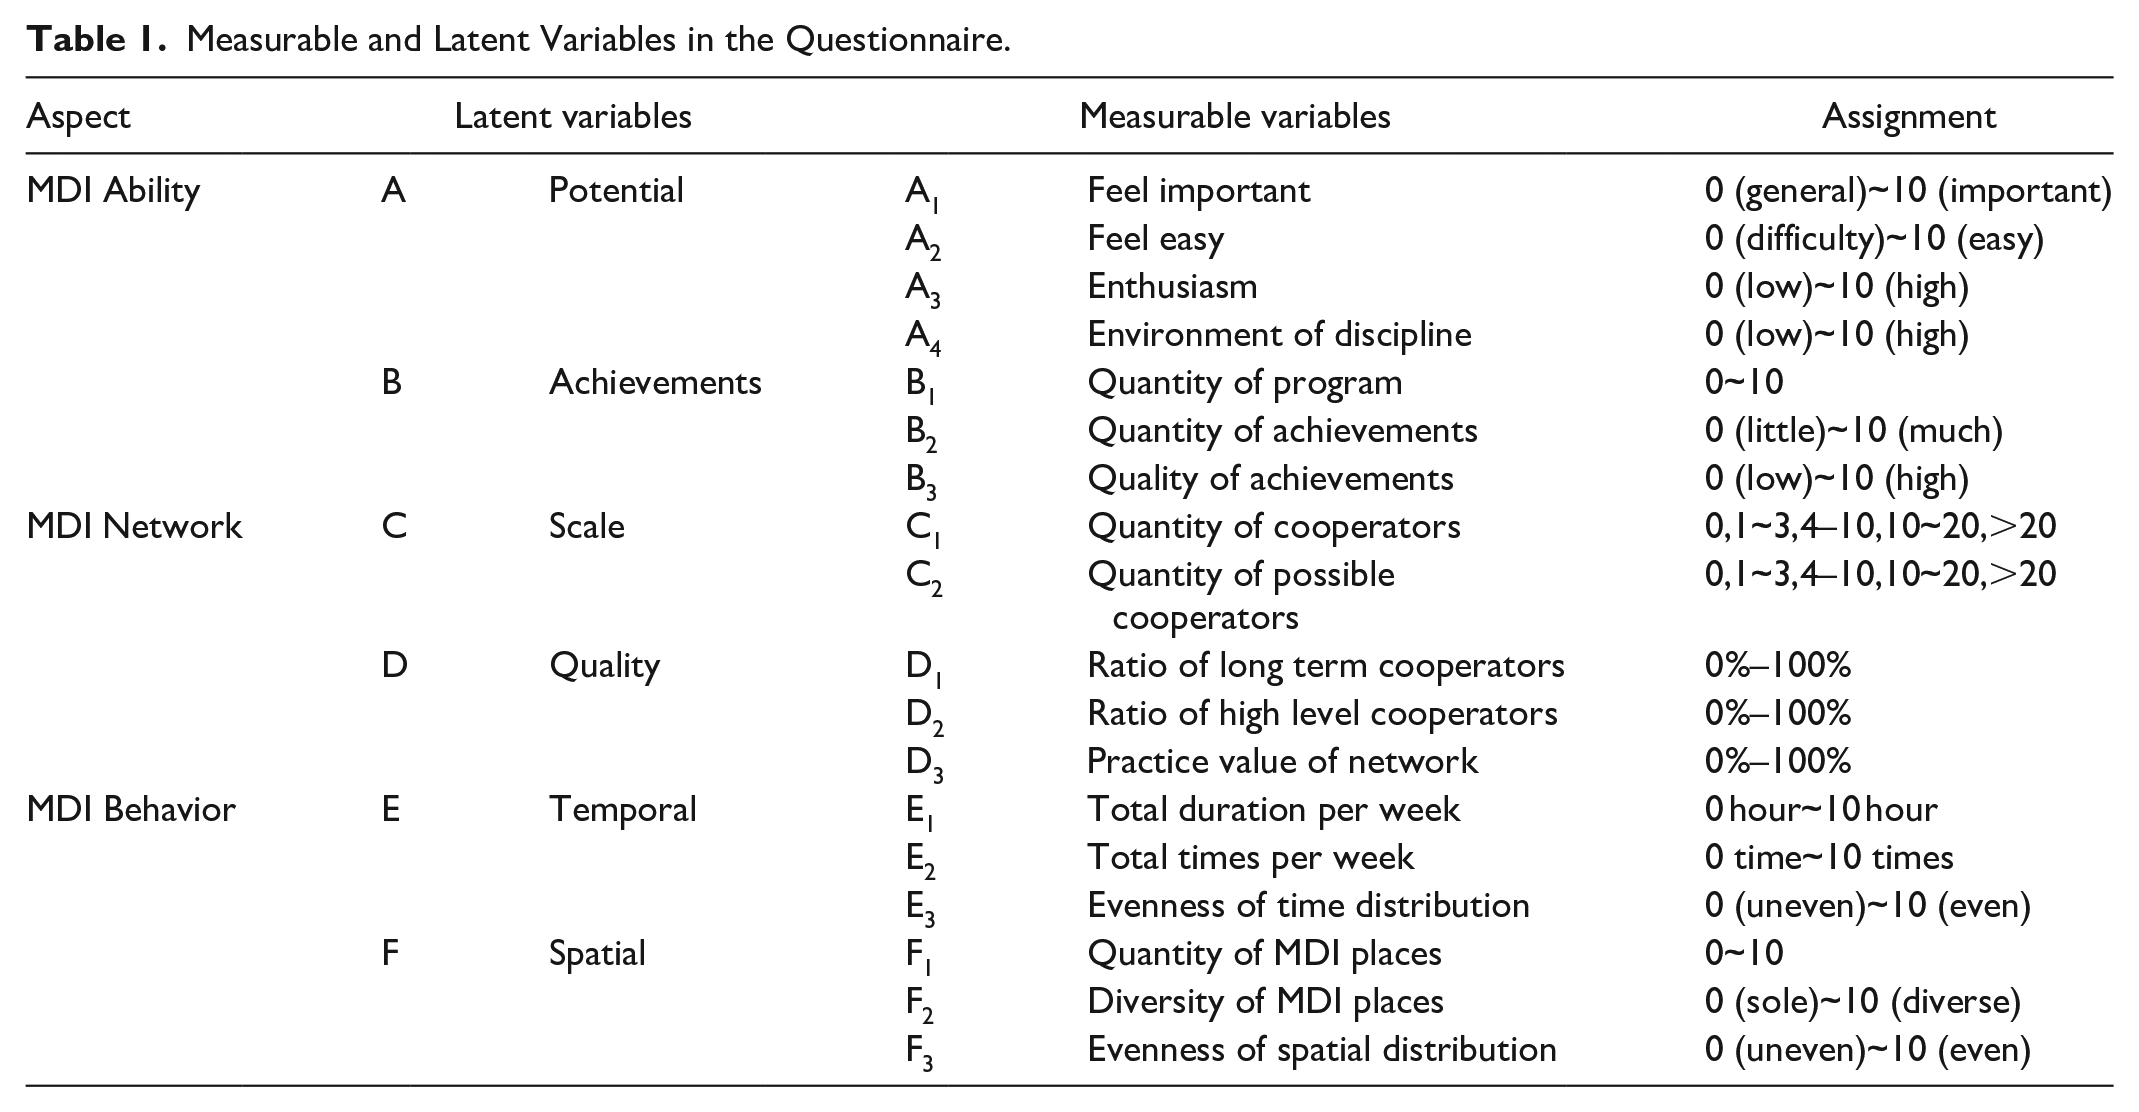
According to the literatures and hypotheses mentioned in Section 2.2, measurable variables for each latent variable and the measurement method of each measurable variable were set. The MDI potential includes four items: the degree of importance, easiness, enthusiasm as well as the innovative atmosphere. The MDI capabilities include three items: the quantity of research projects along with the quantity and quality of achievements. The scale of the MDI social network includes two items: the quantity of existing and potential collaborators. The quality of the MDI social network includes three items: the proportion of long-term and high-level collaborators along with the value of networks. The temporal characteristics of MDI behavior include three items: the total duration and times of MDI activities each week and the evenness of time distribution. The spatial characteristics of MDI behavior include three items: the quantity and types of MDI spots frequently reached, and the evenness of spatial distribution of these places on campus. The measurement methods for each measurable variable are shown in Table 1; accordingly, the data were normalized before the SEM analysis.
Measurable and Latent Variables in the Questionnaire.
The questionnaire survey consists of two parts: question answer and map drawing. The question answer part is divided into five sections, with a total of 26 multiple-choice questions and fill-in-the-blanks questions. The first section concerns the backgrounds of respondents, including gender, grade, major, and living duration on campus. The second, third, and fourth questions all correspond to the measurable variables. The fifth part is the satisfaction evaluation of campus space for respondents, and a fill-in-the-blank question to explain their evaluation. In the second part, on the campus map where each block is coded in advance, the respondents are asked to draw the location and path of their daily activities and the frequent MDI spots, which are represented by circles, lines, and crosses, respectively (Figure 4).

Examples of answer on behavior mapping.
Sampling Technique
The questionnaire survey was divided into two phases with the pre-investigation being carried out from November 15th to November 30th, 2019. A total of 111 questionnaires were distributed, and 75 valid questionnaires were recovered. The questionnaire settings were adjusted according to the feedback. Then, from February 4th to March 15th, 2020, a formal survey was conducted and a total of 572 questionnaires were recovered, 524 of which were valid. The investigators were three senior architecture students who had received relevant questionnaire survey training in advance. The questionnaire distributing method was to firstly contact the counselors of each college who had helped assemble the students in the WeChat group. WeChat is a free messaging and calling app for mobiles. The counselors selected students randomly, while they kept the number of graduate students and undergraduates from every college equal. For each college, the sampling number was based on the proportion of students in the college to the total number of students on campus. Then in the WeChat group the investigators instructed the students on how to complete the online survey. Questionnaires and map drawings were completed online utilizing platforms including the Wenjuanxin (https://www.wjx.cn) and Mugeda (https://www.mugeda.com/) platforms.
Finally, students from 11 colleges participated in the survey and contributed to a total of 524 valid questionnaires, with an average of 47.6 respondents per college. Among them, 263 students were graduates (50.79%); 261 were undergraduates (49.21%); 211 were male (39.62%) and 313 were female (60.38%); 120 (20.94%) were within 1 year of living in the Zijingang campus; 279 (48.69%) had 1 to 3 years living there; 135 (23.56%) had 3 to 5 years; and 39 (6.81%) had more than 5 years.
SEM
SEM is a tool for multivariate complex relationships. Compared with other statistic methods, it is particularly good at analyzing the relationship between multiple causes and effects as well as the relationship between latent variables. In this research there are a number of variables, and their relationships are relatively complex. So, we use SEM—examined by fitness estimation—to analyze and explain the proposed theoretical assumptions. According to the definition of SEM, the research model with latent variables is composed of a measurement model and a structural model. And it integrates the analysis of variance, regression analysis, path analysis, and factor analysis. The SEM analysis in this research is conducted by AMOS 26.0 for IBM SPSS 15.0 which is commonly used among the similar researches (Blunch, 2013)
Network Analysis
Data integration
Three types of overall networks were generated. They all that use campus blocks as nodes but adopt different connection methods. The space layout network is connected according to proximity of blocks (edge-to-edge) (Figure 5); the behavioral network is connected by the individual daily path routines; and the discipline collaboration network is connected according to the statistics of Question No. 14 (Which disciplines are your cooperator from?) in the questionnaire. The connections of nodes of behavioral and discipline collaboration network are calculated by integrating individual data collected from the survey. That is to say, when the total amount of individual links between two nodes is over a certain threshold, a kind of connection will be generated in these two overall networks (Figure 6).
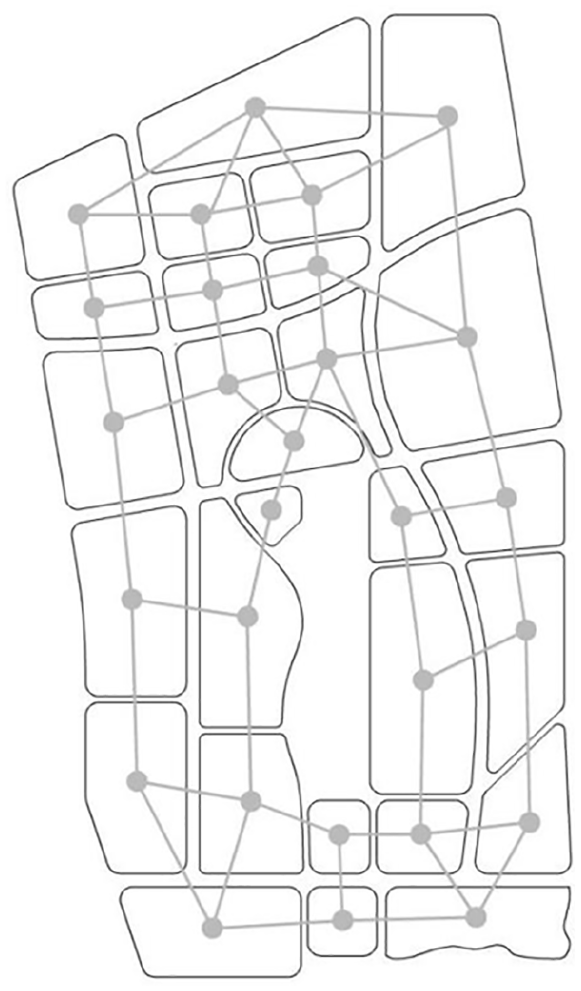
Network generation method of campus land.

Generation method of behavior and disciplinary network.
Indexes of network analysis
Network analysis is a well-developed and commonly used method for the relationship analysis in the fields as social science and geography (Everett, 2002). In this research, the following indexes were used to compare different overall networks: Density (D) which reflects the closeness of network nodes and indicates the ratio of the number of edges which are present in the network to the upper limit of the edges. The betweenness centrality (
Evaluation method of MDI adaptability
Generally, the evaluation method compares the structural attributes of each node (according to campus land blocks) in a spatial layout network with those in behavioral and interdisciplinary networks and the proportion of distribution of MDI locations to obtain MDI adaptability value. The average value of all nodes represents the degree of MDI adaptability of the spatial organization of the campus.
Since the space layout network, behavior network, and interdisciplinary network have the same nodes, we use the distances from one node to all other nodes to indicate its structural property. The distance between two nodes on the network is the length of the shortest path between the two nodes, which shows the closeness of them. The comparisons of the average difference of the distance of one node to all other nodes in the two networks can reflect the structural similarity (
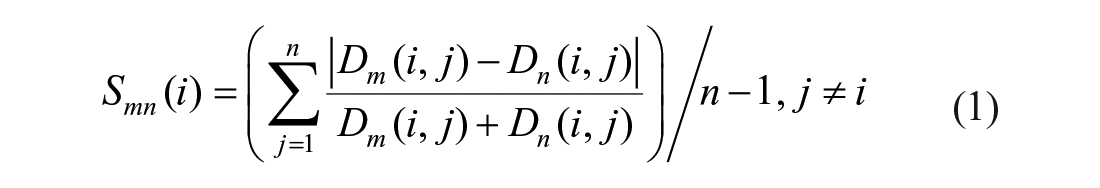
where,
As for network structure attributes and MDI site distribution, we compared the difference of the normalized betweenness centrality of a node in the space layout network and the normalized MDI site distribution value at that node (block). The difference (

In the formula,
The study divided all campus blocks into disciplinary and non-disciplinary types. For MDI adaptability of non-disciplinary blocks (

For MDI adaptability of disciplinary blocks (

where,
Validation of the evaluation method
The verification of the evaluation results was divided into two parts. The first one involved inviting five architecture and urban planning experts with living experience in the Zijingang Campus to score each block of the campus. The scores were 5 points (very good), 4 points (good), 3 points (normal), 2 points (poor), and 1 point (very poor). The correlation analysis is conducted on the results of expert scoring and the established evaluation method. The second part was about the comparison of the satisfactory degree value of students in each discipline and the evaluation result of each disciplinary block. The proposed evaluation method would be recognized as reliable when the correlation analysis shows a certain degree of significance.
Results and Analysis
Descriptive Statistics
For all respondents, their average scores of MDI potential were 8.2 ± 1.7 (feel important), 4.2 ± 2.2 (feel easy), 5.3 ± 2.3 (enthusiasm), and 5.8 ± 2.3 (environment of discipline); the average scores of MDI achievements were 3.8 ± 2.6 (quantity of program), 3.6 ± 2.3 (quantity of achievements), and 4.5 ± 2.4 (quality of achievements); the average scores for network scale were 2.4 ± 1.1 (quantity of cooperators) and 2.7 ± 1.1 (quantity of possible cooperators); the average scores for network quality were 28.8 ± 24.3 (ratio of long term cooperators), 30.2 ± 25.9 (ratio of high level cooperators), and 46.2 ± 27.4 (practice value of network); the average scores for temporal behavior were 2.6 ± 2.3 (total duration per week), 2.1 ± 1.9 (total times per week), and 4.1 ± 3.6 (evenness of time distribution); the average scores for spatial behavior were 3.4 ± 2.1 (quantity of MDI places), 4.0 ± 3.0 (diversity of MDI places), and 4.5 ± 3.0 (evenness of spatial distribution).
For the respondents who lived at the Zijingang Campus for different durations (Figure 7), the innovative ability is different. For respondents who lived for a relatively short period (<1 year), their MDI enthusiasm was slightly higher than that of the other respondents—but their quantity of MDI activities as well as the quantity and quality of results were significantly inferior. Those who had the most MDI participation and achievements were the ones living for 3 to 5 years on the campus; those with the highest quality of achievement had lived more than 5 years. For respondents in different disciplines, the highest enthusiasm belong to individuals from the School of Management (6.11), and the lowest was generated from the School of Medicine (4.91). The best achievements were from the Agriculture School (4.43), and the worst from the College of Civil Engineering and Architecture (3.54).

MDI Ability and potential of respondents of different duration in campus.
The average score of respondents’ satisfaction with the current campus was 3.56. The ratings which were most common picked were “general” and “acceptable.” At the same time, 9.6% of respondents thought it was “good,” and 2.96% indicated “bad” or “not good.” There was a difference in the degree of satisfaction between graduates and undergraduates; accordingly, the overall satisfaction of undergraduates was lower than that of graduates. Subsequently, it could be seen that 52.13% of undergraduate students and 41.92% of graduate students thought that the satisfaction degree of the Zijingang Campus was general, while 37.94% of undergraduates and 42.96% of graduates considered it as acceptable (Figure 8). For different disciplines, students in the School of Pharmacy have the highest satisfaction degree (3.73), while students of the School of Public Administration and Environment have the lowest (3.41).
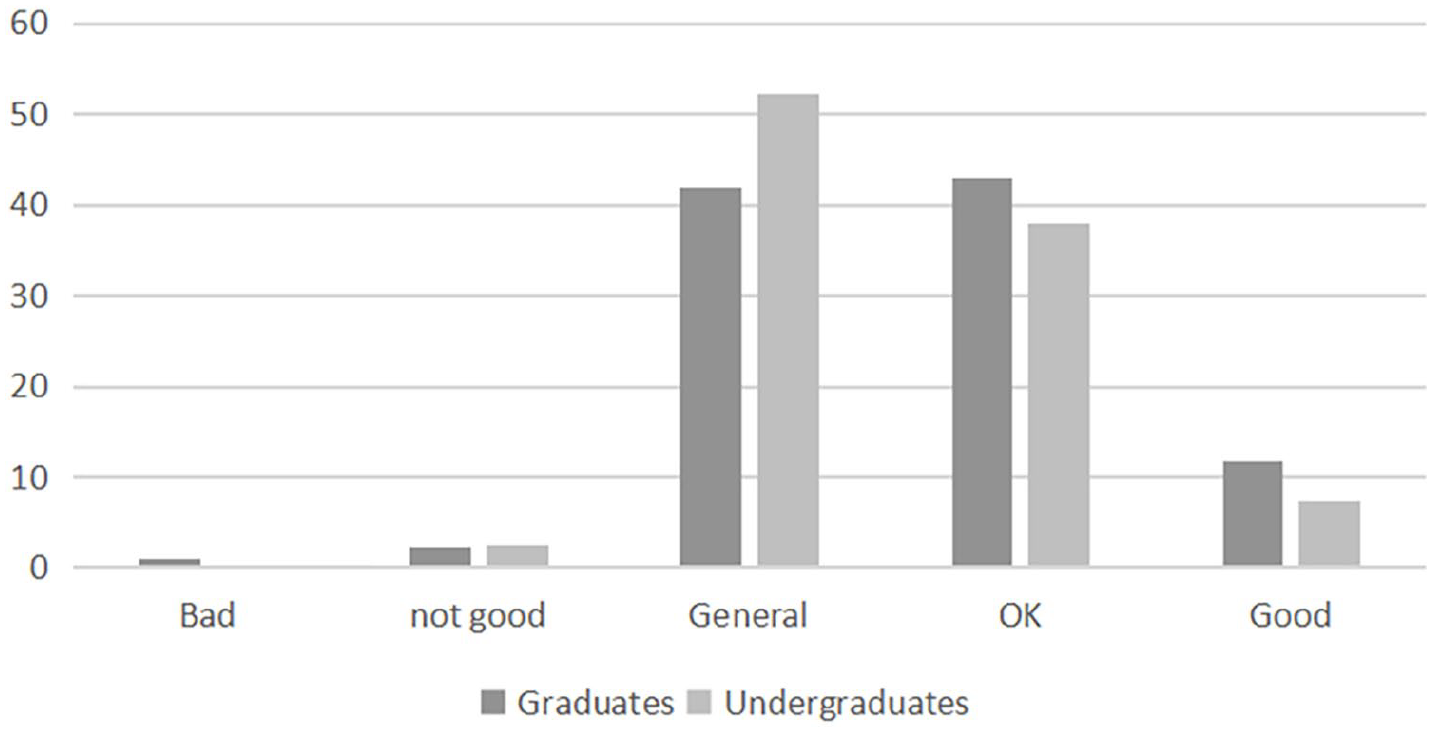
Satisfaction on the campus of graduates and undergraduates.
Reliability and Validity of the Questionnaires
The study first conducted a composite reliability analysis of all variables, and then calculated the Cronbach’s alpha reliability coefficient. The criteria for variable selection were as follows: (1) the skewness and kurtosis of the variables are within a reasonable range; (2) the correlation between the individual variables and the whole is greater than .3; and (3) the composite reliability coefficient is greater than .5. The variables of MDI ability, MDI Network scale, and MDI temporal behavior feature all met the requirements. However, the skewness and kurtosis values of variable D4 in the questionnaire exceeded 10, and the reliability coefficients of A1, D1, and E3 were all low. After checking for the data cleaning, no problem was found in the data collection procedure, and the timing did not affect the accuracy of responses in this research. For A1, it is because most of the respondents realized MDI was highly important, so it cannot measure the differentiation between individuals. For D1 and E3, the respondents might have difficulties in evaluating what was a long-term cooperation and how their time was distributed, which caused the low reliability coefficients. So, these four variables were excluded from the analysis.
It can be seen from Table 2 that the Cronbach’s alpha of each level of scale is between .543 and .836, and the reliability of the total scale reaches .853, indicating that the data generated from the questionnaire is consistent and stable. The Bartlett’s test of sphericity shows the Kaiser-Meyer-Olkin (KMO) value of the total scale is .831 (greater than .70), and the Sig value is .000 < .05, indicating that the validity of the scale is better. After factor analysis, the factor load of each measurable variable to the latent variable is greater than .5, which has a good convergence validity as a whole.
Reliability and Validity of the Questionnaires.

SEM Analysis of Individual Networks
Model fitting and modification
The maximum likelihood estimation method (MLE) is used to estimate the specifications of the parameters of the “MDI capability-network-space-time behavior” correlation model. The results show that the χ2/df value of the model is 2.48, and the fitting indexes of the root mean square residual (RMR), goodness of fit index (GFI), and adjusted goodness of fit index (AGFI) are all greater than .90; the Root Mean Square Error of Approximation (RMSEA) value is .053. The overall fitting index of the original model mostly meets the basic requirements, but the RMSEA value is slightly higher. This shows that the model fit is acceptable. It indicates that the settings of the measurement model and the structural model are reasonable. In the terms of measurement model, the standardized estimate values of the observed variable of each latent variable are .401 to .880, which are significant in statistics. Overall, the measurement model is ideal, showing that the observation indicators in the model have a considerable impact on specific structural variables, which can be very effective in explaining the corresponding latent variables. Consequently, there is no need to eliminate any observed variables. In the structural model, the causal path coefficients partially support the research hypothesis. Except for one path, all of the others reach a significant level, and the standardized path coefficients range from .407 to .491. All the correlations of latent variables reach significant levels, with correlation coefficients ranging from .364 to .505.
In the original model, although both the standardized regression path coefficient and the fitness are acceptable—and the overall model fits well—a further revision is required to obtain the standard model. The revision of the model is mainly based on the value of the modification index (MI). Through analysis, it was found that among the six latent variables in the original model, the MI value between the MDI capability and the MDI temporal behavior was 17.535 (>4), so a path could be added. Finally, the fitting indexes of the modified model are listed in Table 3. While the degree of fitness was somehow affected due to some reasons, including the large number of samples, various hypotheses and complex model structure in this study. Nevertheless, all indexes met the recommended values for successful fitting (Wu, 2017).
Fitness of SEM.

Hypothesis validation and interpretation of SEM
The study uses the significance of the path coefficient to determine whether a hypothesis is true. Among the 11 hypotheses, 10 of them were proved to be reasonable by SEM, and only one failed verification (Table 4). That is, the potential of the MDI was not determined by the scale of the network, but mainly by the quality of the network and existing MDI abilities. The quantity and quality of the network together determine the MDI abilities. For the correlation analysis, four latent variables of network quality, network quantity, behavior time, and behavior space all have pairwise significant positive correlations. This means that for an individual on campus, the more time and frequency of one’s MDI activities, the more MDI locations one could use. Correspondingly, the quantity and the quality of the MDI network will increase, resulting in stronger MDI capabilities and potential. In the modified model, the added path between MDI participation time and MDI capability indicates that there is a direct correlation between the them.
Hypothesis Validation.
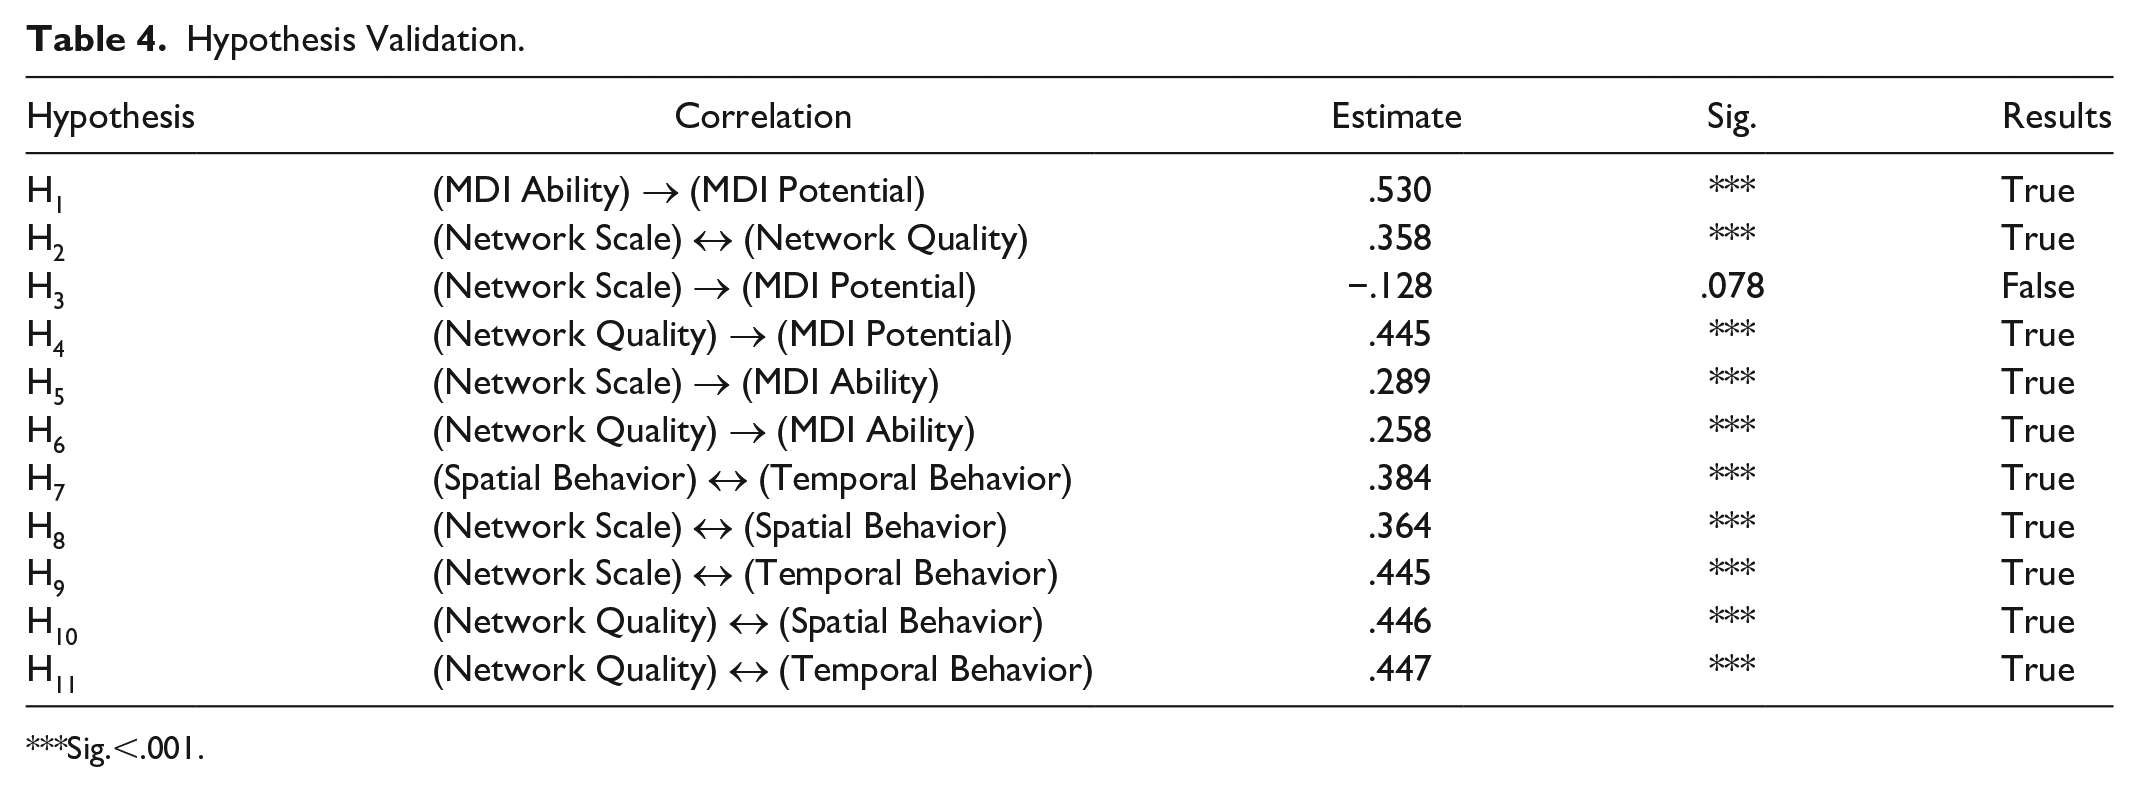
Sig.<.001.
Reflection on the results of the individual network
The SEM analysis confirmed the relationship between individual innovation on campus and their spatiotemporal behavior. Nevertheless, individuals’ MDI innovation capabilities or needs are different. So are their temporal and spatial behaviors. Individuals or groups with strong innovation capabilities and high innovation demands tended to devote a long period of time and extensive space for MDI activities in a frequent way. Hence, the MDI adaptability of campus space layout is the degree to which it satisfies the users’ overall spatiotemporal behavior characteristics and makes the spatial and temporal distribution of MDI activities more reasonable as a whole. This can be mainly reflected in three aspects, which are presented in the following paragraphs.
First, the spatial layout should improve the behavior efficiency of space users. The improvement of behavior efficiency means improving the time and space distribution of MDI innovation activities. This can be evaluated by the structural similarity between the space layout network and the behavioral network.
Second, the spatial layout should meet the requirement of convenience of the disciplinary connection. Disciplines which connected more tightly with each other should be spatially closer, allowing the MDI to be more convenient. This can be evaluated by structural similarity between the space layout and the discipline connection networks.
Third, the space layout should make the MDI sites convenient to be reached. These places should be located as reasonably as possible to maximize their efficiency and convenience in usage. This can be evaluated by comparing the structural characteristics of the space layout network with the distribution of the MDI sites.
Comparison of Whole Networks
Network features
Figure 9 shows the space layout network for the Zijingang Campus. The number of each node is coded according to Figure 2; their shapes represent different functions. Diamonds represent disciplinary blocks, while squares mean non-disciplinary blocks. The size of a node represents the betweenness centrality of the node in the network. The higher the centrality, the larger the nodes in the graph. Then, base on a “faction” algorithm the nodes were analyzed by cohesive subgroup analysis. A faction is a part of a graph in which the nodes are more tightly connected to one another than they are to members of other factions. Hence, the algorithm forms the number of groups where connections are maximized within, and minimized connections are between the groups. When the graph was divided into two groups, the fit value was the highest (fitness = 466.00). Compared with the campus map, the red group almost corresponds to the north blocks. While the blue corresponds to the south blocks. This indicates that the north-south division of the Zijingang Campus is very remarkable. The average centrality of all the nodes was 47.057 ± 43.745. The most central nodes were No. 29 (Alumni Forest, centrality = 159.886); No. 21 (Nanhua Garden, centrality = 152.696); and No. 30 (grass, centrality = 139.092). Blocks with the least centrality are No. 14 (Medicine College, centrality = 1.533); No. 18 (Biological Experiment Center, centrality = 1.450); and No. 10 (Agriculture College, centrality = 0.000). The centrality of the nodes corresponding to the disciplinary blocks is not high.

Network of spatial layout.
Figure 10 shows the behavioral network on the campus. In order to facilitate the comparison with the space layout network, we set the threshold at five for connections. This will be done when there are more than five path connections between two nodes. In this case, they are considered to be connected—otherwise, they are not. In this way, the densities of the two networks are relatively close and are consequently suitable for analysis and comparison. In general, the space layout network is indeed different from the behavior network. First, all the nodes in the space layout network are connected, but there are 12 nodes isolated in the behavioral network. The cohesive subgroup analysis divides the network into two groups (fitness = 314), with all connected nodes in a group and unconnected nodes in the other one. The blocks that are not connected in the network are totally not isolated in the real sense, but they are very weakly related. Second, among the remaining nodes in the behavioral network, the average distance between the nodes is smaller; moreover, they have a closer relationship than those in a space layout network. Third, the degree (number of connections) of the nodes greatly varies as some nodes are connected to many other nodes. For example, No. 24 is connected to 17 nodes, but the highest degree in the space layout network is only 6. In the behavioral network, the average value of betweenness centrality is 5.971 ± 12.783. The three blocks with the highest betweenness centrality are No. 32 (cafeteria, centrality = 50.453); No. 24 (west teaching buildings, centrality = 49.481); and No. 23 (east teaching buildings, centrality = 31.584). Similar to simulation in the space layout network, the betweenness centrality of the disciplinary blocks is also low in the behavioral network. Among them, No. 5 (Public Administration College) has no connection with others.

Network of behaviors.
The data of the disciplinary network connection is obtained from the question, “Which colleges do your MDI collaborators come from?,” which has been displayed in the questionnaire. The number of connections between two colleges is the sum of the connections of one college to the other. According to the statistical results, the college having the largest number of connections with the other colleges is the School of Foreign Languages; the one with the least connections is the School of Construction Engineering; the number of connections between Schools of Public Administration and Management is the largest; and the number of connections between schools of pharmacy and public management is the least. Similarly, we set the threshold at 28 so that the density of the disciplinary network can be close to that of the space layout and behavior network. As shown in Figure 11, there are 11 nodes in the disciplinary network, which are divided into four groups (fitness = 4.00). Node 10 (Agricultural College) and Node 20 (College of Civil Engineering and Architecture) are not connected with other nodes. This shows that there are two groups of tight linked nodes. One group includes Node 5 (Public Administration), Node 6 (Foreign Languages), and Node 25 (Management). The other group includes Node 8 (Food), Node 9 (Environment), Node 11 (Life Science), Node 13 (Pharmacy), and Node 14 (Medicine). Among all of them, Node 9 has the highest network control power (betweenness centrality = 7).

Network of disciplines.
Network comparisons
As shown in Table 5, the densities of the three networks are relatively close after the thresholds are set, but obvious differences can be found in betweenness centrality and correlativity. For the average value of betweenness centrality, the space layout network is the highest (47.057 ± 43.745) and the disciplinary network is the minimum (1.636 ± 2.568). The centralities of the three networks are 20.70%, 8.16%, and 13.11%, respectively. As for the correlativity of the network, the nodes of the space layout network are all connected, and the average distances between them is 3.768. There are many isolated nodes in the behavioral network. But the remaining nodes are more closely connected, and the average distance between them is 1.826. The disciplinary network has the most subgroups in the three networks—or the node with the weakest degree of association—with an average distance between nodes to be 2.000. In short, there are obvious differences in the structures of the three networks.
Comparison of Three Networks.

Note. NS = network of spatial layout; NB = network of behavior; ND = network of disciplines.
Adaptability of spatial layouts
Based on the method established in Section 4.4, we conducted an MDI adaptability evaluation on the blocks within the Zijingang Campus (Table 6). The campus’s blocks are divided into two categories: disciplinary and non-disciplinary. For the disciplinary blocks, the structural similarity of nodes (Ssb and Ssd) and the consistency of the betweenness centrality of the nodes in the space layout network were considered together with the distribution of MDI sites (Q) on them. According to experts’ opinions, the weights are 0.4, 0.4, and 0.2 for Ssb, Ssd, and Q, respectively. For non-disciplinary blocks, Ssb and Q were considered and their weights were 0.6 to 0.4.
Evaluation Results of Each Network Nodes (Campus Blocks).

Note. (1) or non-discipline the weighs β1 and β3 are .6 to .4. (2) For discipline the weights β1, β1, and β1 are .4, .4, and .2. (3) The figures in gray are for the disciplinary blocks. (4) The no. of blocks are corresponding to Figure 2.
It can be seen from Table 6 that the MDI adaptability of blocks is not good in general. As for Ssb, the most MDI adaptable block is No. 26, and the score of which is 0.46. The rest are all above 0.5. There are 12 blocks with a score of 1.00 which means that these nodes cannot be compared in the two networks. The average Ssb of 35 blocks is 0.73; as for Ssd, No. 9 has the best adaptability, with a score of 0.53. The rest are mainly from 0.50 to 0.80, except for two blocks with a score of 1.00. The average Ssd value was 0.72. As for Q, the blocks with better adaptability (the evaluation value is less than 0.20) include blocks 5, 8, 11, 12, 14, 15, and 28. Among the non-disciplinary blocks, No. 26 has the best overall MDI adaptability, and a total of three blocks are less than 0.5. Among the disciplinary blocks, No. 8 and No. 14 are of the best adaptability. The average scores of the final MDI adaptability evaluation values of non-disciplinary and disciplinary blocks are 0.74 to 0.60, respectively.
Validation of Evaluation
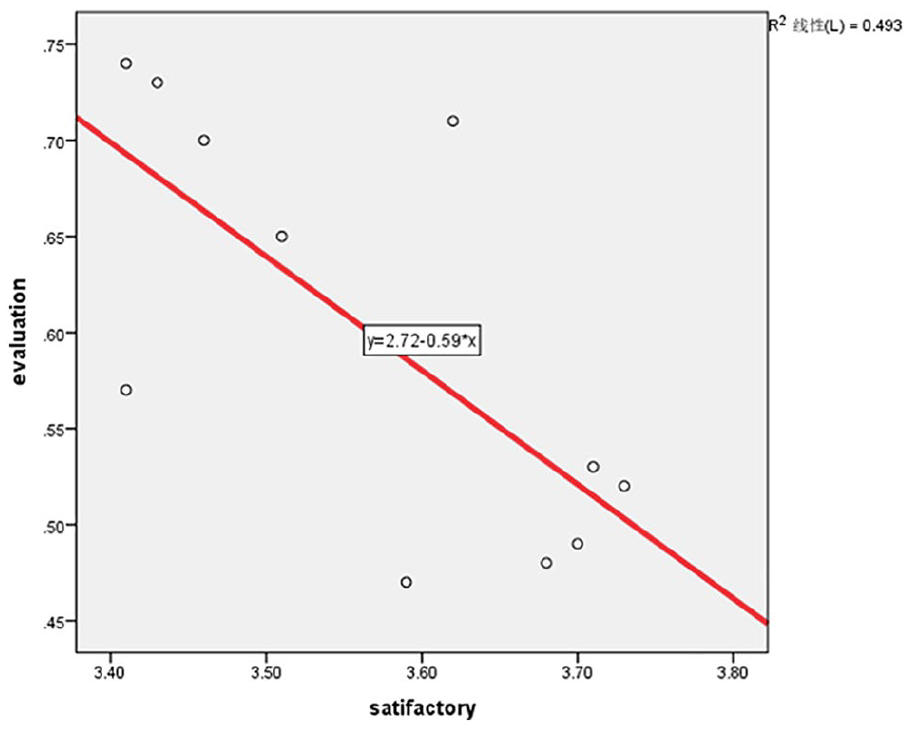
The study examines the proposed evaluation method based on two aspects. First, we conducted a correlation analysis between the calculated values and the average scores of six experts for the 35 blocks. The average value of the experts’ evaluations on all blocks was 2.7. The results in Figure 12 showed that the two sets of data had a strong correlation (correlation coefficient = −.623, significance = .000). Second, we compared the satisfaction degrees of students from 11 colleges with calculated values (Figure 13). The average satisfaction degree of students from 11 colleges was 3.57. The results of the correlation analysis showed that the two sets of data have a certain correlation (correlation coefficient = −.702, significance = .016). Above all, it implies that the proposed method is reliable in evaluating the MDI adaptability of the campus space.

Evaluations of expert and method proposed.
Satisfactory degree of students and evaluations of method proposed.
Discussion
Reflections on the Research of Innovative Campus Design
In the past 10 years, campus construction and renewal in Europe and the United States have provided many excellent cases. Scholars have analyzed and summarized practical cases based on the perspective of improving innovation ability and multidisciplinarity (Coulson et al., 2018; Hoeger, 2007; Taylor, 2010). The aim of these researches is to reveal the spatial prototype of the innovative campus. They provide outlines, frameworks, and strategies for decision-making with good practical application value (e.g., Qiu, 2014). However, these normative case studies used to interpret theory are different from the empirical case studies used to test theory (e.g., Coulson et al., 2018; Taylor, 2010). The qualitative induction method they use is not statistical but analytical, lack standardized data analysis, and are selective in the presentation of evidence and the interpretation of phenomena (e.g., Qiu, 2014).
Half a century ago, in “The Oregon Experiment,” Alexander (1975) discussed the use of “diagnosis” and “coordination” to create an “organic order” for campus planning. In recent years, built environmental evaluation on campus has gradually evolved from an index evaluation on objective physical environment—such as landscape green coverage and land classification structure (Dober, 2000)—to a social environmental psychological evaluation, which includes students’ satisfaction and concern with the outdoor environment of the campus (Eckert, 2014). However, most of these studies use post-occupancy evaluations, which rely more on people’s subjective feelings, resulting in less objective and predictable conclusions. Moreover, research on the correlation between subjective feelings and spatial environmental factors often stops at data description and analysis.
In this sense, the innovations and contributions of this research are significant. It explains how the spatial layout affects MDI by social activities and relationship, which is ignored in the existing research. It links the MDI and campus design by integrating the individual and overall network perspectives. Through quantitative analysis, it forms a new scientific theoretical basis for innovative campus design, and provides references for design practice.
Spatial Design Strategies for MDI Campus
From the overall network perspective, while most of the behavioral network nodes on the Zijingang Campus are closely connected, the current space layout is relatively loose. Besides, the nodes in the disciplinary network are divided into multiple subgroups, indicating that the disciplinary network reflects a lack of disciplinary connections and an unreasonable disciplinary setting. Although the space layout network and disciplinary network have significant correlation, the MDI adaptability of all the blocks is still low due to large-scale zoning. To improve travel efficiency, one approach is to increase the public transportation service (e.g., shared bicycle and mini-bus). The other is to increase the quantity and distribution of public facilities such as cafeterias, study areas, and discussion spaces, to reduce the routine and time of necessary behaviors and thus solve the traffic problems (Zhu et al., 2004).
Figure 14 shows the MDI adaptability values of the blocks in Zijingang. The color saturation indicates the score, with eight levels from 0 to 1. Disciplinary and non-disciplinary blocks are represented by green and yellow, respectively. Compared with Figure 3, it can be seen that the blocks of grasslands, open spaces, administrative buildings, and staff accommodation areas are of less adaptability. This is because these function blocks have no MDI sites within them and are not part of daily life for students either. Second, the center of the campus has a large area of water that cannot be traversed, resulting in a decrease in its connection efficiency—especially between the east and west teaching blocks. In addition, although the campus with a lot of water and green spaces is good for ecology, its current land use or distribution patterns are not intensive and efficient, especially for MDI.

MDI adaptability of Zijingang campus.
Therefore, a dense and well-grouped spatial layout could be a better type for future campus renovation that takes disciplinary blocks with more interdisciplinary exchanges as the core of communication, close to student accommodations, and surrounded by service functions such as administrative offices and ecological green spaces in the periphery. In fact, some college-based universities are trying to adopt this mode at present (Coulson et al., 2018).
For individuals on campus, spatiotemporal behaviors can be divided into necessary behaviors and unnecessary behaviors, which corresponds to formal communi-cation and informal communication. Many studies (Assimakopoulos, 2007; He, 2014; Yun et al., 2018) have shown that the MDI is more inspired by informal communication of unnecessary behaviors. Since an individual’s the physical strength and the total time of the individual are certain, promoting informal communication means reducing the time for necessary behaviors and increasing efficiency. So considerable informal communication spots should be arranged while optimizing the space layouts (Magdaniel et al., 2018; Winks et al., 2020). For example, the Infinite Corridor at the Massachusetts Institute of Technology (Massachusetts Institute of Technology, 2020b) connects all of the faculties and departments, and interdisciplinary innovation studios like the iLAB at Harvard University (Harvard University, 2020).
Limitations and Prospects
Firstly, the ultimate aim of this study is to develop a spatial layout typology of MDI campus through quantitative research. The present results are preliminary and limited case studies, which may affect the universality of the conclusions. Therefore, it is necessary to select and compare more campuses to enhance the generality and credibility.
Secondly, this study does not consider whether MDI activities within the campus are affected by its location and surrounding environmental resources. This needs to be further verified through a comparative study of campuses in different zones and at different stages of urban development.
Thirdly, the evaluation method is based on the assumptions that social networks and spatial layout are related to. However, space design is supposed to be actively adjusted to social relations instead of passively adapting to the latter. Notably, different space layouts may make the same social networks evolve in different ways.
Despite these deficiencies, the established theories and methods are still of high value and significance for the collaborative innovation design of mesoscopic urban spatial form; for example, with regard to innovative towns, science, and technology parks.
Conclusions
From an individual perspective, the MDI network can determine the MDI ability. While the MDI spatiotemporal behavioral characteristics are largely related to the conditions of the social network. Therefore, improving the efficiency of an individual’s spatiotemporal behavior can enhance one’s MDI ability.
From a holistic perspective, the MDI adaptability of a campus’s space layout can be reflected in the consistency of the structural characteristics of the space layout network to that of the behavioral network, disciplinary network, and the MDI site spatial distribution.
The evaluation results are verified by the experts’ ratings and the space users’ satisfaction feedback. It is based on the method by carrying out structural similarity comparison of network nodes which can effectively evaluate the MDI adaptability of the campus space layout.
Footnotes
Acknowledgements
The authors are grateful to the students participated in this research. We would also like to appreciate all anonymous reviewers for their insightful comments and constructive suggestions to polish this paper in high quality.
Declaration of Conflicting Interests
The author(s) declared no potential conflicts of interest with respect to the research, authorship, and/or publication of this article.
Funding
The author(s) disclosed receipt of the following financial support for the research, authorship, and/or publication of this article: This research is funded by Open Project of State Key Laboratory of Subtropical Building Science, South China University of Technology, (Granted No. 2020ZB09) and National Nature and Science Foundation of China (Granted No. 51808486).