
Abstract
This research focuses on investigating the reasons why an overconfident chief executive officer (CEO) is forced to leave by examining CEO turnover observations from 463 Taiwan-listed companies over the period 2008 to 2016 and using the Cox semi-parametric proportional hazard model to test the reasons for CEOs being laid off. The empirical result shows that overconfidence increases a CEO’s forced turnover risk, but this risk is not significant for an overconfident CEO in a company with a high proportion of controlling shareholders on the board. In addition, an overconfident CEO’s forced turnover risk decreases when he/she has strong business and management ability. This paper contributes to the literature by demonstrating the relationship between a CEO’s forced turnover risk and control-affiliated directors as well as the CEO’s ability.
Introduction
The literature on the field of behavioral finance indicates that a manager sometimes reveals overconfident behavior (Daniel et al., 1998), and an overconfident manager also has a great influence on the company’s financial decision-making (Malmendier & Tate, 2005a, 2005b). A mistake in financial decision-making made by an overconfident manager that causes a financial loss or does not achieve a financial goal of the company may result in this manager being forced out due to his/her overconfident behavior (Campbell et al., 2011). This research is thus interested in the reason for why an overconfident manager undergoes forced turnover.
The board of directors is the core unit of corporate decision-making. Because most directors (except independent directors) hold more equity in their firm, they are motivated to supervise the top management team and have the right to appoint and dismiss managers. Hence, the extant literature on managers being employed or laid off always studies around the function of the board of directors such as board size (Coles et al., 2008; Yermack, 1996) and board structure (Boone et al., 2007; Linck et al., 2008). However, no consistent conclusion has been reached.
Control-affiliated directors on the board of directors easily exhibit the agency problem. Jensen and Meckling (1976) study the ownership structure of the firm by integrating the elements within the theories of finance, agency, and property rights. Control-affiliated directors make up the classical type of a family corporate, and the agency problem obviously appear in family corporates. Yeh and Woidtke (2005) indicate that a high ratio of family directors on the board of directors easily causes low-quality corporate governance when family directors’ benefit is inconsistent with the other board directors and shareholders. The agency problem also appears in the behavior of a chief executive officer (CEO). Iyer et al. (2017) examine the influence of the agency cost of debt to the behaviors of a rational CEO and an overconfident CEO and conclude that an overconfident CEO has more motivation than a rational CEO to overinvest under the presence of risky outstanding debt. Their study naturally develops into research about the linkage between a CEO’s character or behavior and CEO turnover. Our study extends the research of Campbell et al. (2011) to discuss the forced turnover risk of an overconfident CEO by considering the factors of a CEO’s business and management ability and the proportion of controlling shareholders on the board.
Chemmanur and Fedaseyeu (2017) argue that previous studies divided boards of directors into inside directors and external directors, noting that the inconsistent conclusions of previous studies may be that endogeneity interferes with the results. Because each director has different perceptions of a CEO’s competence, Chemmanur and Fedaseyeu (2017) establish a theoretical model to forecast a dynamic decision-making process on the board to lay off this top manager. They indicate that board size, board structure, and the probability and the cost to find another suitable manager are the potential factors to impact the decision-making of the board on whether to continue to employ or lay off a manager. In addition, Chemmanur and Fedaseyeu (2017) contend that each director has different perceptions of private signals about managers’ abilities. Some directors may question managers’ abilities, but their decisions on managers’ turnover are subject to different opinions of other directors—that is, although directors want to dismiss managers, they may not ever dismiss them. Chemmanur and Fedaseyeu (2017) indicate that this situation creates “dissent costs” for the company, and so the supervisory effect on managers is poor. Therefore, if the “dissent cost” is too high, then the ability of managers may not be the main factor for managers to be dismissed. Responding to the existence of dissent costs, we here find that a manager’s business and management ability is not the only factor to cause a manager to be let go.
The quality of corporate governance is also one of the potential factors that causes a manager to get laid off, because a company with better corporate governance will have a high probability to lay off a manager who is not performing well. The board of directors and ownership structure are the two core issues of corporate governance and are usually used as the proxy of corporate governance. The previous literature on corporate governance either focuses solely on the board structure or on the corporate governance index, which represents the overall performance of corporate governance. Following Yeh and Woidtke (2005), this study thus uses control-affiliated directors (cad), representing “the proportion of controlling shareholders on the board” as one proxy for corporate governance quality. The proxy “cad” not only involves the composition features and ownership structure of a board, but also is a manifestation of controlling shareholders since most Taiwanese companies exhibit more concentrated ownership (Claessens et al., 2000; Yeh et al., 2001). Yeh and Woidtke (2005) indicate that controlling shareholders with less (high) board affiliation indicate high (low) corporate governance quality, and high (low) corporate governance quality makes for a better (worse) monitoring effect on a manager, because of a high (low) probability for a (confident) manager to be laid off.
Our paper contributes to the literature by demonstrating the relationship between a CEO’s forced turnover risk and control-affiliated directors as well as a CEO’s ability. We find that an overconfident CEO may obtain protection to reduce his/her forced turnover risk in a company with a high proportion of controlling shareholders on the board. An overconfident CEO also has low forced turnover risk when he/she has strong capability. We compare with recent studies and find that they seldom focus on the topic of overconfident CEO such as Aghamolla and Hashimoto (2021), who mention that CEO’s turnover risk is low when a CEO has various talents. Other literature talks about CEO’s forced turnover, shareholders, and control contests (Zhong et al., 2021), the Securities and Exchange Commission’s enforcement actions and the probability of a CEO’s turnover, (Chang et al., 2021); institutional trading, information production, and forced CEO turnover (Chemmanur et al., 2021), the turnover probability for a CEO in a heavily polluting industry (Gu et al., 2021), and a corporation’s return and information signal of a CEO’s turnover to the market (Farah & Li, 2021). From this recent literature, our paper presents a different investigation point from them.
All in all, our work contributes to the literature in two ways. (1) It explains the probability of managers being forced to leave from the simultaneous perspective of managers’ overconfidence and overestimated operating abilities. By exploring managers’ competence, this paper empirically analyzes the “dissent costs” in the theoretical model of Chemmanur and Fedaseyeu (2017). (2) Considering the characteristics of Taiwanese ownership concentration, this paper uses control-affiliated directors to represent the quality of corporate governance, which mainly considers the role of control-affiliated directors in the decision-making of manager turnover. In the extant literature, few studies have explored the relationship among managers’ overconfidence, CEO turnover, and controlling shareholders at the same time, which is another contribution of this paper to the relevant literature. Empirical results from the main effect show that overconfidence by managers causes a high probability of these managers being forced to leave, and a high ratio of control-affiliated directors decreases the probability of managers (but not overconfident managers) being forced to leave. In addition, based on an empirical result the moderation effect of CEOs’ abilities shows that an overconfident CEO with strong competence will decrease the risk of a forced turnover. In sum, our study highlights that an overconfident manager must have professional management ability to reduce the risk of dismissal and also emphasizes that controlling shareholders have a significant influence on the dismissal of managers, but again not for overconfident mangers. This finding has more management implications for Taiwanese companies with the characteristics of controlling shares and increases our understanding of the role of controlling shareholders. Our findings generally support the traditional finance theory that overconfident CEOs tend to undergo forced turnover, because of their inefficient investments (Malmendier & Tate, 2008; Malmendier et al., 2011). However, an overconfident CEO with outstanding ability or one in a firm with a high proportion of controlling shareholders on the board has a low probability of encountering forced turnover. Our finding contradicts the traditional finance theory by considering the power of controlling shareholders and CEOs’ ability. As a result, part of our finding is incompatible with this theory, in which an overconfident CEO leads to a high risk of forced turnover. Reviewing the existing literature, our study fills the gap of the CEO forced turnover literature by simultaneously considering their overconfidence, their ability, and controlling shareholders.
The remaining structure of the paper runs as follows. Section 2 is the literature review. Section 3 presents the methodology in our study. Section 4 offers an empirical result. The final section concludes.
Literature Review
The traditional financial theory proposed by Modigliani and Miller (1958) emphasizes rational managers and rational investors based on the assumptions of perfect capital markets and rationality. However, following their paper, a large body of research has verified that the capital market is not perfect, especially in recent years in which behavioral finance has put forward that most people are irrational (bounded rationality). As a result, from the viewpoint of finance theory, a large amount of literature has already been devoted to study the relationship between CEO irrationality (e.g., overconfidence) and corporate finance and investment decision-making (Ben-David et al., 2007; Graham et al., 2013; Heaton, 2002; Malmendier & Tate, 2005a, 2005b, 2008; Malmendier et al., 2011, among others). Most studies find that an overconfident CEO usually executes inefficient investment, including overinvestment or underinvestment. Moreover, in terms of financing decisions, overconfident CEOs prefer to give priority to the use of internal funds, and so they will keep more cash (Chen et al., 2020). If the internal cash is slack, then they will first issue corporate bonds or raise funds from banks rather than raise funds in the capital market, because overconfident CEOs believe that investors underestimate the company’s stock price. Therefore, overconfident CEOs basically follow the pecking order theory.
Psychologists have found that most people are overconfident, especially about the accuracy of their knowledge. Gervais et al. (2002) express overconfidence as a belief that one’s knowledge is more accurate than one’s reality—that is, people give more weight to the information that they believe they have than in fact they do. Managers are important persons who decide the investment decision of their company, and so the characteristics of managers have a crucial influence on the investment decisions in a company. Daniel et al. (1998) point out that successful people regard their own success as the accuracy of their personal abilities and knowledge, and most people tend to be overconfident, especially managers.
Alloy and Tabachnik (1984) put forward the theory of control illusion bias, and because of the hallucination of their own ability, they are overconfident. The control illusion bias might come from managers’ cognitive dissonance, and thus they overestimate their own ability. For example, overconfident CEOs show a high degree of confidence and stick to their own views on an investment with a low evaluation (Malmendier & Taylor, 2015). Malaquias and Albertin (2019) also show that the behavioral biases of managers relate to the illusion bias, especially for small firms in emerging markets. Senior managers especially tend to overestimate their own business ability. Gervais and Odean (2001) indicate that manager ability comes from experience, and CEOs update their beliefs when they obtain successful experiences. When they overweight the probability of their beliefs, they will exhibit superior behaviors and treat events with overconfidence. Weinstein (1980) finds that when policymakers decide over whether to invest in large-scale plants or mergers and acquisitions, CEOs underestimate risks, because they believe in their abilities (overconfidence), which lead to over-investment problems (Ben-Davidet al., 2007; Heaton, 2002; Malmendier & Tate, 2005a).
Malmendier and Tate (2005a) and Graham et al. (2013) argue that managerial overconfidence may cause corporate investment distortions, including investment decisions, financing policies, cash dividends, and mergers and acquisitions. They conclude that an overconfident CEO, particularly in an equity-dependent corporate, is significantly more sensitive to cash flow. Malmendier and Tate (2005b) prove the robustness of results in Malmendier and Tate (2005a) by an alternative approach that relies on the perception of outsiders rather than the CEO’s own actions. Graham et al. (2013) find that CEOs are optimistic and risk-tolerant to corporate financial policies, and their traits such as risk-aversion and time preference relate to their own compensation. Phua et al. (2018) offer evidence that an overconfident CEO easily involves stakeholders to undertake policies that contribute to the leader’s vision. Lee et al. (2019) study the operations and management of a bank and show during the financial crisis of 2008 to 2009 that there is a significant impact on a bank’s systemic risk when a CEO is overconfident. Aabo et al. (2020) look at corporate risk through a CEO’s overconfidence and incentive compensation and conclude that a CEO’s overconfidence and high CEO incentive compensation will cause corporate risk to increase. Banerjee et al. (2020) analyze the relationships among governance, board inattention, and the appointment of overconfident CEOs and suggest that governance and board play a role to avoid a CEO’s confident tendency from becoming greater risk-taking.
The extant literature on the financial theory always assumes that a manager will perform with rational investment behavior, but this is not always what happens, because many studies indicate that a manager will initiate a project with overestimated financial payoff and underestimated investment risk. This scenario will deteriorate when the corporate owns a lot of free cash flow (Ben-David et al., 2007; Heaton, 2002). In this case, psychological errors caused by overconfidence may lead to managers making wrong decisions, reducing company value, and incurring additional costs (Jensen & Meckling, 1976). In addition, overconfident managers prefer to take risks, and so they engage in many strategic changes (Chatterjee & Hambrick, 2007).
Chatterjee and Hambrick (2007) investigate CEOs in the computer hardware and software industries and find that narcissistic CEOs positively relate to strategic dynamism and grandiosity, which result in big wins or big losses of organizational performance; however, the performance of firms with narcissistic CEOs is generally no better or worse than that of firms with non-narcissistic CEOs. Goel and Thakor (2008) note that a board always fires excessively overconfident CEOs since an overconfident manager has a higher probability of making value-destroying investments than a rational manager in a value-maximizing oriented firm. As a result, overconfident managers generally engage in unprofitable investments, resulting in a decline in business performance and a higher probability of being fired (Campbell et al., 2011; Goel & Thakor, 2008; Malmendier & Tate, 2005a, b).
To summarize, an overconfident manager tends to overestimate his/her ability due to managers’ cognitive dissonance or managerial biases. From the psychological viewpoint, Heaton (2002) indicates that the optimistic attitude or opinion of overconfident CEOs may come from a high degree of commitment to thinking that everything is under control. As such, they believe that their investments should succeed, even for negative net present value investments. In line with the argument of Heaton (2002), Chen et al. (2020) indicate that an overconfident manager tends to engage in risky investment and to overestimate investment payoffs, leading to overinvestment problems (investment inefficiency) accordingly.
As a result, managerial bias bringing value-decreasing investments often damages a firm’s value and damages shareholders’ rights and interests. This equity agency problem also increases the possibility of overconfident managers being dismissed by their firms. However, the layoff effect may differ depending on the ownership structure. In Taiwan the ownership structure is more concentrated versus that in the U.S., where ownership is more dispersed. The different ownership structures lead to two different agency problems: (1) dispersed ownership leads to Agency problem I, where the conflict of interest comes from shareholders and managers; and (2) Agency problem II, in which there is concentrated ownership, and the conflict of interest comes from controlling shareholders and minority shareholders instead. In Taiwan, as mentioned above, most firms are characterized by a concentrated ownership and thus have a controlling shareholder.
This study thus investigates the role of controlling shareholders. We use control-affiliated directors (the proportion of controlling shareholders on the company board) as a proxy for the controlling shareholder power and infer that overconfident CEOs may abuse internal finds for their own private benefits (or family benefits for family firms) at the expense of minority interests. However, overconfident managers may not be fired since they usually belong to a group of controlling shareholders. Our empirical results verify this part of the deduction. A manager is less likely to be fired when the ratio of controlling shareholders sitting on the company board is high, but the effect is not prevalent for overconfident CEO. In other words, the chance of CEOs being fired correlates to control-affiliated directors, but not for overconfident CEOs.
As discussed above, overconfident CEOs prefer to use debt rather than equity when their firm’s internal funds are in deficit. Although borrowing from the outside can restrain the equity agency problem, too high debt may also increase the risk of bankruptcy, worsen the company’s value, and increase the probability of managers being fired accordingly.
Based on these arguments, this study proposes Hypothesis 1 as follows.
H1: Overconfident behavior increases a CEO’s turnover risk.
The early research by Jauch et al. (1981) indicate that CEO dismissals may be a strategic decision by the board, yet recently, CEO dismissals that refer to control-affiliated directors have become a hot researched topic. The phenomenon of controlling shareholders on the board is rather common in many countries. For example, as the percentage of corporates with controlling shareholders to all corporates in Eastern Asia is 57%, while this percentage in Taiwan is 64% (Claessens et al., 2000; La Porta et al., 1999). Hence, Taiwan is denoted as a high controlling shareholder percentage country. A manager of a value-maximizing corporate should maximize stakeholder wealth; but in fact, a corporate with controlling shareholders may be concerned about the controlling shareholders’ interests instead of other shareholders’ interests.
Claessens et al. (2000) show that the concentration of corporate ownership is prevalent in East Asian countries, and due to the separation of ownership and control caused by pyramid structures and cross-shareholdings, the larger the separation is between ownership and control, the lower is the corporation’s value. When large shareholders acquire additional control over ownership through cross-shareholdings or pyramid structures, agency problems between them and minority shareholders arise (Claessens et al., 2002; Conyon & He, 2012; Fan & Wong, 2002; La Porta et al., 2002). Claessens et al. (2000) investigate 2,980 corporations in nine East Asian countries on separate examinations of ownership and control. They find that more than two-thirds of firms are controlled by a single shareholder, and that corporate wealth is significantly concentrated among a few families. Claessens et al. (2002) also look at 1,301 corporations in eight East Asian economies and find control rights of the largest shareholder that exceed (no more than) its cash-flow ownership will increase the corporation’s value.
Fan and Wong (2002) take 977 companies in seven East Asian economies as an example to examine the relationship between firms’ earnings and their ownership structure. The research result indicates that concentrated ownership may make the reported earnings lose credibility to outside investors, caused by hidden information about the firms’ rent-seeking activities. La Porta et al. (2002) examine the impact of controlling shareholders to the legal protection of minority shareholders and to cash-flow ownership based on the firm’s valuation. They conclude that a firm’s valuation comes from the proper protection of minority shareholders and high cash flow rights by the controlling shareholder.
Controlling shareholders of course do not necessarily have a negative impact on the company’s value. Yeh and Woidtke (2005) point out that if family control is deeply linked to the board of directors (in other words, the ratio of family members to the board is high), then it represents poor governance, and so it is easy to generate negative entrenchment effects. On the contrary, positive incentive effects arise when the controlling shareholders’ ownership is higher or cash flow rights exceed control rights. Jauch et al. (1981) show that the decision-making of senior managers’ turnover is made by the board of directors. Yeh and Woidtke (2005) use positive incentives and negative expropriation effects to explain board affiliations. Their results show that the more (less) control-affiliated directors there are, the more significant the negative expropriation effects (positive incentive effects) are for controlling shareholders.
When the relationship between controlling shareholders and the board of directors is high (low), it means that the company’s governance is poor (good), and the supervisory effect on managers is poor (good), and so the probability of the CEO being forced to leave is low (high). Because the controlling shareholder is usually a large shareholder, chairman of the board, CEO, or family members, if the number of control-affiliated directors is higher, then the possibility of the CEO being forced to leave the company is low. Based on the argument above, we have Hypothesis 2 as follows.
H2: The more control-affiliated directors there are, the lower the probability is for an overconfident CEO to be forced out.
A CEO’s mission achievement relates to support from the board of directors, proactive marketing-oriented strategies, and formal and sophisticated organization structures. In small firms and dynamic environments, a CEO’s personality and organizational characteristics significantly affect corporate performance (Miller & Toulouse, 1986). CEO’s ability on a corporation’s business and management directly relates to the corporation’s value. Shah et al. (2018, 2019) present a CEO’s behavior and corporate value, noting close relationships among a CEO’s behavior, corporate value, and CEO turnover. This study assumes that an outstanding CEO with strong ability for corporate performance is not easily laid off, and so we test the next hypothesis.
H3: An overconfident CEO with excellent performance has a low probability of being forced out.
In order to test Hypotheses 1, 2, and 3, this study collects data for 463 listed corporations undergoing CEO turnover in Taiwan from 2008 to 2016, which exclude the case of potential overconfident CEOs of companies that did not experience CEO turnover since this study is interested in the reasons why those companies laid off their CEOs. The data sources are Taiwan’s Market Observation Post System (MOPS) and Taiwan Economic Journal (TEJ), which are the databases for all variables used in this study. The data exclude regulated industries such as financial, securities, and public utilities. Our study innovatively involves control-affiliated directors in the model to investigate how an overconfident CEO affects CEO forced turnover and also considers the CEO’s business and management ability at the same time. In our model, the type of CEO overconfidence, CEO’s business and management ability, and control-affiliated directors are independent variables, while the turnover risk of a CEO being forced to leave is a dependent variable.
Since many business studies employ multiperiod data, Cox (1972) offers a discussion on regression models and life tables, while Andersen (1982) applies Cox’s regression model to test goodness of fit. Lin and Wei (1989) test robustness for the Cox proportional hazard model, which has been applied in business research of employee turnover in fashion such as by Trevor et al. (1997). As multiperiod data exhibit structural differences, the Cox semi-parametric proportional hazard (CSPPH) model is more appropriate than the Cox proportional hazard model. Tveteras and Eide (2000) apply the CSPPH model to accommodate for structural differences between new entrants and incumbent firms in terms of their differences among plant size, capital intensity, and productivity. Campbell et al. (2011) also employ the CSPPH model to estimate the relation between the likelihood of forced turnover and CEO optimism. They indicate the CSPPH model’s advantages in studying CEO turnover include the following: (i) since a CEO’s forced turnover risk may potentially exist over many years, the CSPPH model provides a CEO’s forced turnover probability conditional on the CEO surviving up to the forced turnover year; (ii) the CSPPH model does not make any assumption on the nature of the survival distribution; (iii) the CSPPH model uses the time series of information of a CEO to estimate a CEO’s forced turnover hazard. Shumway (2001) provides a discussion of the advantage of the hazard model over the static model.
Western corporations, generally speaking, are widely-held by shareholders, whereas eastern corporations’ predominant form of ownership is being controlled by a family (Faccio et al., 2001). China’s number of family enterprises has grown by 28.9%, and the total number is about three million from 1993 to 2004. Forbes “China’s Richest” list in 2007 notes that the percentage of family enterprises among the top 100 enterprises is as high as 84% (Shu et al., 2018). Since Taiwan is not only in East Asia but also in the neighborhood of China, the percentage of control-affiliated directors of some listed companies in Taiwan is also so high that they seem to be family enterprises. Hence, a CEO’s forced turnover is not only relative to a CEO’s ability, but also relative to company’s ownership constructure. In this study we apply the CSPPH model to find the reason for a CEO’s forced turnover and estimate the possibility of a CEO being forced to leave.
The reasons/motivations for why this study focuses on family firms in Taiwan are as follows. (i) This study targets the behavior of a family CEO’s forced turnover. Yeh et al. (2001) show that 76% of Taiwanese companies are family firms, thus allowing us to examine the research issue more concretely. These family firms are commonly characterized with a concentrated ownership, and so it is easier to have controlling shareholders. (ii) Yeh et al. (2001) and Claessens et al. (2000) point out that the proportion of controlling shareholders on the board affects the forced turnover of a CEO. (iii) The managers of family firms are usually family members, and their business behavior and objectives may be different from those of professional managers of non-family firms. In particular, family firms pay great attention to corporate transmission from generation to generation and sustainable operations, and so managers of family firms are less likely to be forced to leave. Based on the above, our empirical results provide different evidence of managers’ turnover behavior from that in western countries where firms exhibit dispersed ownership.
Methodology
The setting of the CSPPH model in this study is:
where the independent variable shows a main effect upon the dependent variable, and the variable of cross-interaction exhibits a moderation effect on the dependent variable. Table A1 presents the main independent variables’ detailed definitions. All independent variables and all variables of cross-interaction listed in in Table 1 will be used to construct models for a study on a CEO’s turnover risk.
Description of Variables and Their Effects.

In Table 1 the term TURNOVER is a dependent variable used to measure the risk of an overconfident CEO being forced out. Based on Parrino et al. (2003), there are two types of CEO turnover: forced and voluntary. The former means that the CEO cannot achieve the corporation’s goal(s) and is forced out by the board of directors, while the latter means a CEO’s voluntary retirement. TURNOVER is a dummy variable and is 0 when the corporation does not fire the CEO and 1 when the CEO is laid off. In this study we focus on forced turnover and use this factor to represent TURNOVER.
The term OC in Table 1 is an independent variable to represent a CEO being overconfident or not. Malmendier and Tate (2005a, 2005b) mention that a CEO’s overconfidence relates to his/her overinvestment behavior. Schrand and Zechman (2012) use the growth rate of total assets as a dependent variable to do a regression for the sales income growth rate as the independent variable, and the error term in the regression is a measurement of CEO overconfidence. An error term larger (smaller) than zero presents that there is (not) overconfident behavior by the CEO (OC_Invest in our study). Ben-David et al. (2013) mention that an overconfident CEO decides on his/her excess capital expenditure (OC_Capex in our study). Our study measures CEO overconfidence by adopting the treatments of Ben-David et al. (2013), Schrand and Zechman (2012), and Malmendier and Tate (2005a, 2005b) in which the variables OC_Capex and OC_Invest present a CEO’s overconfidence performances on excess capital expenditure and overinvestment, respectively. The term Cseat in Table 1 means the proportion of controlling shareholders on the board. Brunello et al. (2003) indicate when a CEO is (not) one of the controlling shareholders on the board that this may make CEO turnover have a high (low) cost. Yeh et al. (2001) and Claessens et al. (2000) also agree that the proportion of controlling shareholders on the board has an impact on a CEO’s forced turnover. Hence, the effect of control-affiliated directors on a CEO’s forced turnover is a valuable issue for discussion.
The term CEOably in Table 1 means a CEO’s business and management ability. Since a CEO’s business and management ability is sensitive to the corporation’s operation efficiency score, Demerjian et al. (2012) suggest to consider factors that affect its operating efficiency so as to remove their influences on such efficiency, and then the noise is defined as a CEO’s business and management ability. Following this idea, we set the regression model as follows:

where the dependent variable in equation 2 is a corporation’s operation efficiency score (θ), and the independent variables are firm size (SIZE), market share (MARKET), free cash flow (FREE), and firm age (AGE). In our study, the error term (e) in equation 2 measures a CEO’s business and management ability. An error term larger (smaller) than zero represents that the CEO has stronger (weaker) business and management ability. Demerjian et al. (2012) apply the data envelopment analysis (DEA) approach to compute a corporation’s operation efficiency score (θ). Based on this line of approach, this study takes sales income (SAELS) as the output and sales cost (COGS), marketing and management expense (SA), net fixed assets (PPE), research and development expense (RD), goodwill (GOODWILL), and other intangible assets (OTHERINTAN) as inputs to compute a corporation’s operation efficiency score. The estimation model of a corporation’s operation efficiency score is:
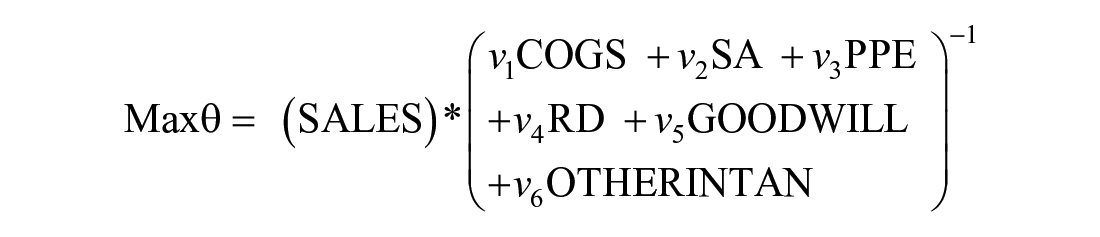
Subject to


Model (3) is the DEA model proposed by Charnes et al. (1978) and is named as the DEA-CCR model.
In order to control the other variables that affect the result in the CSPPH model, this study refers to Campbell et al. (2011) to include the CEO shareholding ratio (CEO_HD), adjusted return of stock (ADJ_Return), CEO salary (Salary), CEO bonus (Bonus), manager’s term of office (Tenure), adjusted return of assets (ADJ_ROA), and directors’ and supervisors’ shareholding ratios (ED_HD) as the control variables in our CSPPH model.
Regarding adjusted return of stock (ADJ_Return) and adjusted return of assets (ADJ_ROA), these two variables relate to corporate performance. We expect that corporate performance is negatively associated with CEOs’ turnover risk. The variable with the CEO shareholding ratio (CEO_HD) is also expected to have a negative correlation with CEOs’ turnover risk since the higher the shareholdings of managers are, the stronger is the correlation between managers’ income and corporate performance. Therefore, managers will have incentives to work hard, and so they are less likely to be fired. The variable for a manager’s term of office (Tenure) is expected to negatively relate to CEOs’ turnover risk since the longer CEOs work, the greater is their loyalty to their firms. Next, the ratio of directors’ and supervisors’ shareholdings (ED_HD) represents the board supervision function. Lastly, CEO salary (Salary) and CEO bonus (Bonus) represent CEOs’ reward, which is expected to have a negative correlation with CEOs’ turnover risk since the incentive to work hard is strong.
Empirical Results
In this section we first examine the preliminary information of data and then apply statistic and econometric models to abstract further information from collected data.
Data Descriptive Statistics
This study collects data of 463 listed companies with cases of CEO turnover in Taiwan from 2008 to 2016. The data description result in Table 2 shows we find that the main reason for CEO turnover in Taiwan’s listed companies is voluntary turnover, while cases of forced turnover are less. Here, OC_Capex and OC_Invest have similar mean values of 0.4752 and 0.4147, respectively, meaning that a CEO’s overconfidence performance not only relies on excess capital expenditure, but also on overinvestment. The mean value of the proportion of controlling shareholders on the board for Taiwan’s listed company is 4.4%. Unfortunately, a CEO’s business and management ability in Taiwan’s listed companies is weak since the mean value of CEOably is lower than zero. Collectively, CEOs in Taiwan have a low probability of being forced to leave, but their abilities are weak. This implies that managers’ abilities may not be the major factor leading to a CEO being forced to leave.
Data Descriptive Statistics.

In respect of the control variables, the mean value of a CEO percentage holdings of company stock is 1.7%, and the mean value of the adjusted return of stock is 8.6%. The main revenue for a CEO in a Taiwanese-listed company includes salary and bonus, which are about NT$14,204,000 and NT$9,139,000 per year on average. In addition, they also have the largest standard deviations of all control variables.
Bivariate Analysis
This subsection applies the T-test of two populations and then the Wilcoxon test to examine the difference in CEO forced turnover between two groups in which Panels A and B stand for a CEO’s overconfidence performance on excess capital expenditure (OC_Capex) and overinvestment (OC_Invest), respectively. The test results in Panels A and B of Table 3 show that an overconfident CEO in terms of excess capital expenditure is easily forced out; on the contrary, an overconfident CEO in terms of overinvestment is not easily forced out. This result may come about as an overconfident CEO finds it easier to execute overinvestment rather than excess capital expenditure, and so there is a small variance on overinvestment that makes an insignificant result in Panel B. An interesting result in Panel C is that the CEO’s business and management ability does not significantly impact the CEO’s forced turnover. Another interesting result in Panel D is that the proportion of controlling shareholders on the board has a significant influence on a CEO’s forced turnover.
Bivariate Statistics Test.

Note. OC_Capex = Y and OC_Invest = Y stand for the case of CEO overconfidence; OC_Capex = N and OC_Invest = N present the case that the CEO is not overconfident. CEOably = 1 (0) means that CEO does (not) have good business and management ability. Cseat = t(b)20 presents that the proportion of controlling shareholders on the board is listed in the top (bottom) 20%.
Stands for the 5% significant level; and *stands for the 10% significant level.
Choi et al. (2013) find that an overconfident CEO will face a great risk of forced turnover than a non-overconfident CEO. The past literature provides the reason for why a CEO’s overconfidence may force his/her turnover. Yilmaz and Mazzeo (2014) and Kim et al. (2016) indicate that an overconfident CEO has a significantly negative impact on the corporate’s stock price. Ho et al. (2016) find that an overconfident CEO in a bank is more likely to weaken lending standards and further make the bank more vulnerable to a global financial shock. He et al. (2020) show that managerial overconfidence causes high abnormal audit fees. A corporate with managerial overconfidence should target to improve supervision measures and quality. Huang et al. (2011) think that effective supervision of an overconfident CEO may be a solution to the agency cost problem. Some derived problems from CEO overconfidence mentioned above may cause force an overconfident CEO’s turnover.
Regression Analysis on the Hypothesis Test
This subsection applies the CSPPHM model to investigate the relationship between a CEO’s forced turnover and explains the control variables. The regression analysis result in Table 4 shows how we test the three hypotheses in this paper. From Models 1 to 4, all of them include the variable of CEO overconfidence, and all regression analysis results from Models 1 to 4 support Hypothesis 1 in our paper in that a CEO’s overconfidence performances on excess capital expenditure and overinvestment increase his/her forced turnover risk.
A Regression Analysis on CEO Forced Turnover.

Note Cseat = t(b)20 stands for the proportion of controlling shareholders on the board in the top (bottom) 20%. CEO_HD = t(b)20 stands for a CEO’s shareholding ratio in the top (bottom) 20%.
Stands for the 1% significant level; **stands for the 5% significant level; and *stands for the 10% significant level.
Models 1 and 2 examine a CEO’s forced turnover effect on control-affiliated directors. The regression results in Models 1 and 2 support Hypothesis 2 in our paper, whereby a high proportion of controlling shareholders on the board lead to a low probability of the CEO being forced out. It implies that a close correlation exists between controlling shareholders and CEOs in Taiwan’s listed companies in which ownership and management rights always overlap. Hence, a CEO in a company with powerful control-affiliated directors easily does something that the control-affiliated directors want. This result creates low risk for an overconfident CEO to be forced out, and the result also illustrates the effect of mutual back-scratching as proposed by Brick et al. (2006), whereby a CEO’s salary and the board’s salary have a positive relationship. Kolasinski and Li (2013) provide evidence that a strong board helps an overconfident CEO to avoid mistakes that may lower the risk of forced turnover. Their finding seems to support that an overconfident CEO’s forced turnover does not easily occur in a corporate with a strong board.
In order to understand the impact on an extreme ratio of control-affiliated directors, we examine the cases of ratios at the top 20% and bottom 20% in Models 3 and 4. The result in Model 3 shows that a CEO with overconfident behavior on excess capital expenditure in a company with an extremely high proportion of control-affiliated directors is not easily forced out. Our paper also explores the variables of board size, independent directors, and CEO duality, but most of them are not significant. However, no significant evidence supports this for a company with an extremely low ratio of control-affiliated directors. In addition, the result in Model 4 shows that no matter what the proportion of control-affiliated directors in a company is, it will not reflect upon a CEO’s forced turnover via a CEO’s overconfident behavior on overinvestment.
The test of Hypothesis 3 is not supported by the results in Table 4 since a CEO’s business and management ability (CEOably) is not significant in all models in the table. Although Model 5 in Table 4 is not directly relative to Hypothesis 3, we use it to confirm the relationship between a CEO’s forced turnover and a CEO’s business and management ability. Model 5 in Table 4 excludes the factor of a CEO’s overconfidence, and the test result shows that a CEO’s business and management ability has an insignificant impact on a CEO’s forced turnover. Chemmanur and Fedaseyeu (2017) provide a viewpoint that high dissent costs do not make it easy for a board to form a consistent resolution to lay off a poor CEO with weak business and management ability. The other finding in Model 5 is a significant test result on the high adjusted return of stock; that is, ADJ_Return. It implies that a CEO who helps achieve a high adjusted return on stock will incur low risk of forced turnover. This result fits the usual expectation that a board likes to see a CEO create excellent financial performance for the company. This study leaves the test of the interaction term between CEO overconfidence and CEO ability to CEO’s forced turnover, which directly relates to Hypothesis 3, to the next section.
Cross-Interaction Analysis (Moderation Effect)
This study investigates not only the main effect between the independent variable and the dependent variable such as Hypotheses 1 and 2, but also the moderation effect in which one dependent variable depends on the other dependent variable such as Hypothesis 3. By analysis of the moderation effect, we arrange the test results for Hypothesis 3 as follows.
Table 5 shows the results of cross-analysis on a CEO’s overconfidence as it relates to excess capital expenditure and his/her business and management ability. The test result in Model 6 shows that an overconfident CEO’s forced turnover risk is affected by his/her business and management ability since the coefficient of the term OC_Capex × CEOably is significant at the 5% level. In Model 7 we focus on a CEO’s business and management ranking in the top 20% of all observations to find the effect on an overconfident CEO’s forced turnover risk. The test result in Model 7 is significant as well, implying that an overconfident and quite competent manager is more likely to not be fired. Our result illustrates that a CEO’s forced turnover risk significantly correlates to CEO’s ability. An overconfident manager with better business ability will not be forced to leave. In general, when enterprises recruit senior executives, they mainly observe the two aspects of “professional competence” and “leadership.” As such, the professional competence of overconfident managers is particularly important in the labor market. Hu and Liu (2015) find that a CEO with more diverse career experiences has an ability to achieve low investment-cash flow sensitivity and exploit more outside funds. Huang et al. (2020) also indicate that if a CEO practices at a higher level of agreement with investors, then his/her forced turnover will be less sensitive to corporate performance. The literature above illustrates that a CEO’s ability is relative to his/her forced turnover.
A Cross-Analysis on a CEO’s Forced Turnover with Respect to Overconfidence and His/Her Business and Management Ability.

Note. The term OC_Capex × CEOably is a comprehensive effect on an overconfident CEO’s excess capital expenditure and his/her business and management ability, and the term OC_Capex × CEOably = t20 is also a comprehensive effect on an overconfident CEO’s excess capital expenditure and his/her business and management ability listed among the top 20% (CEOably = t20 denotes CEOs’ management ability listed among the top 20%).
Stands for the 1% significant level; **stands for the 5% significant level; and *stands for the 10% significant level.
Table 6 presents the cross-interaction effect for CEO overconfidence and the proportion of control-affiliated directors. In Models 8 and 9, the coefficients of OC_Capex × Cseat = t20 (−1.0022) and OC_Capex × Cseat = b20 (−0.5292) are both negative but insignificant, showing that an overconfident CEO’s forced turnover risk does not significantly relate to the ratio of control-affiliated directors. The empirical result illustrates that the relationship between corporate governance and manager dismissal does not seem to have a strong connection since a CEO with overconfidence does not increase forced turnover risk no matter the ratio of control-affiliated directors in his/her company.
Cross-Analysis on a CEO’s Forced Turnover With Respect to a CEO’s Overconfidence and the Ratio of Control-Affiliated Directors.
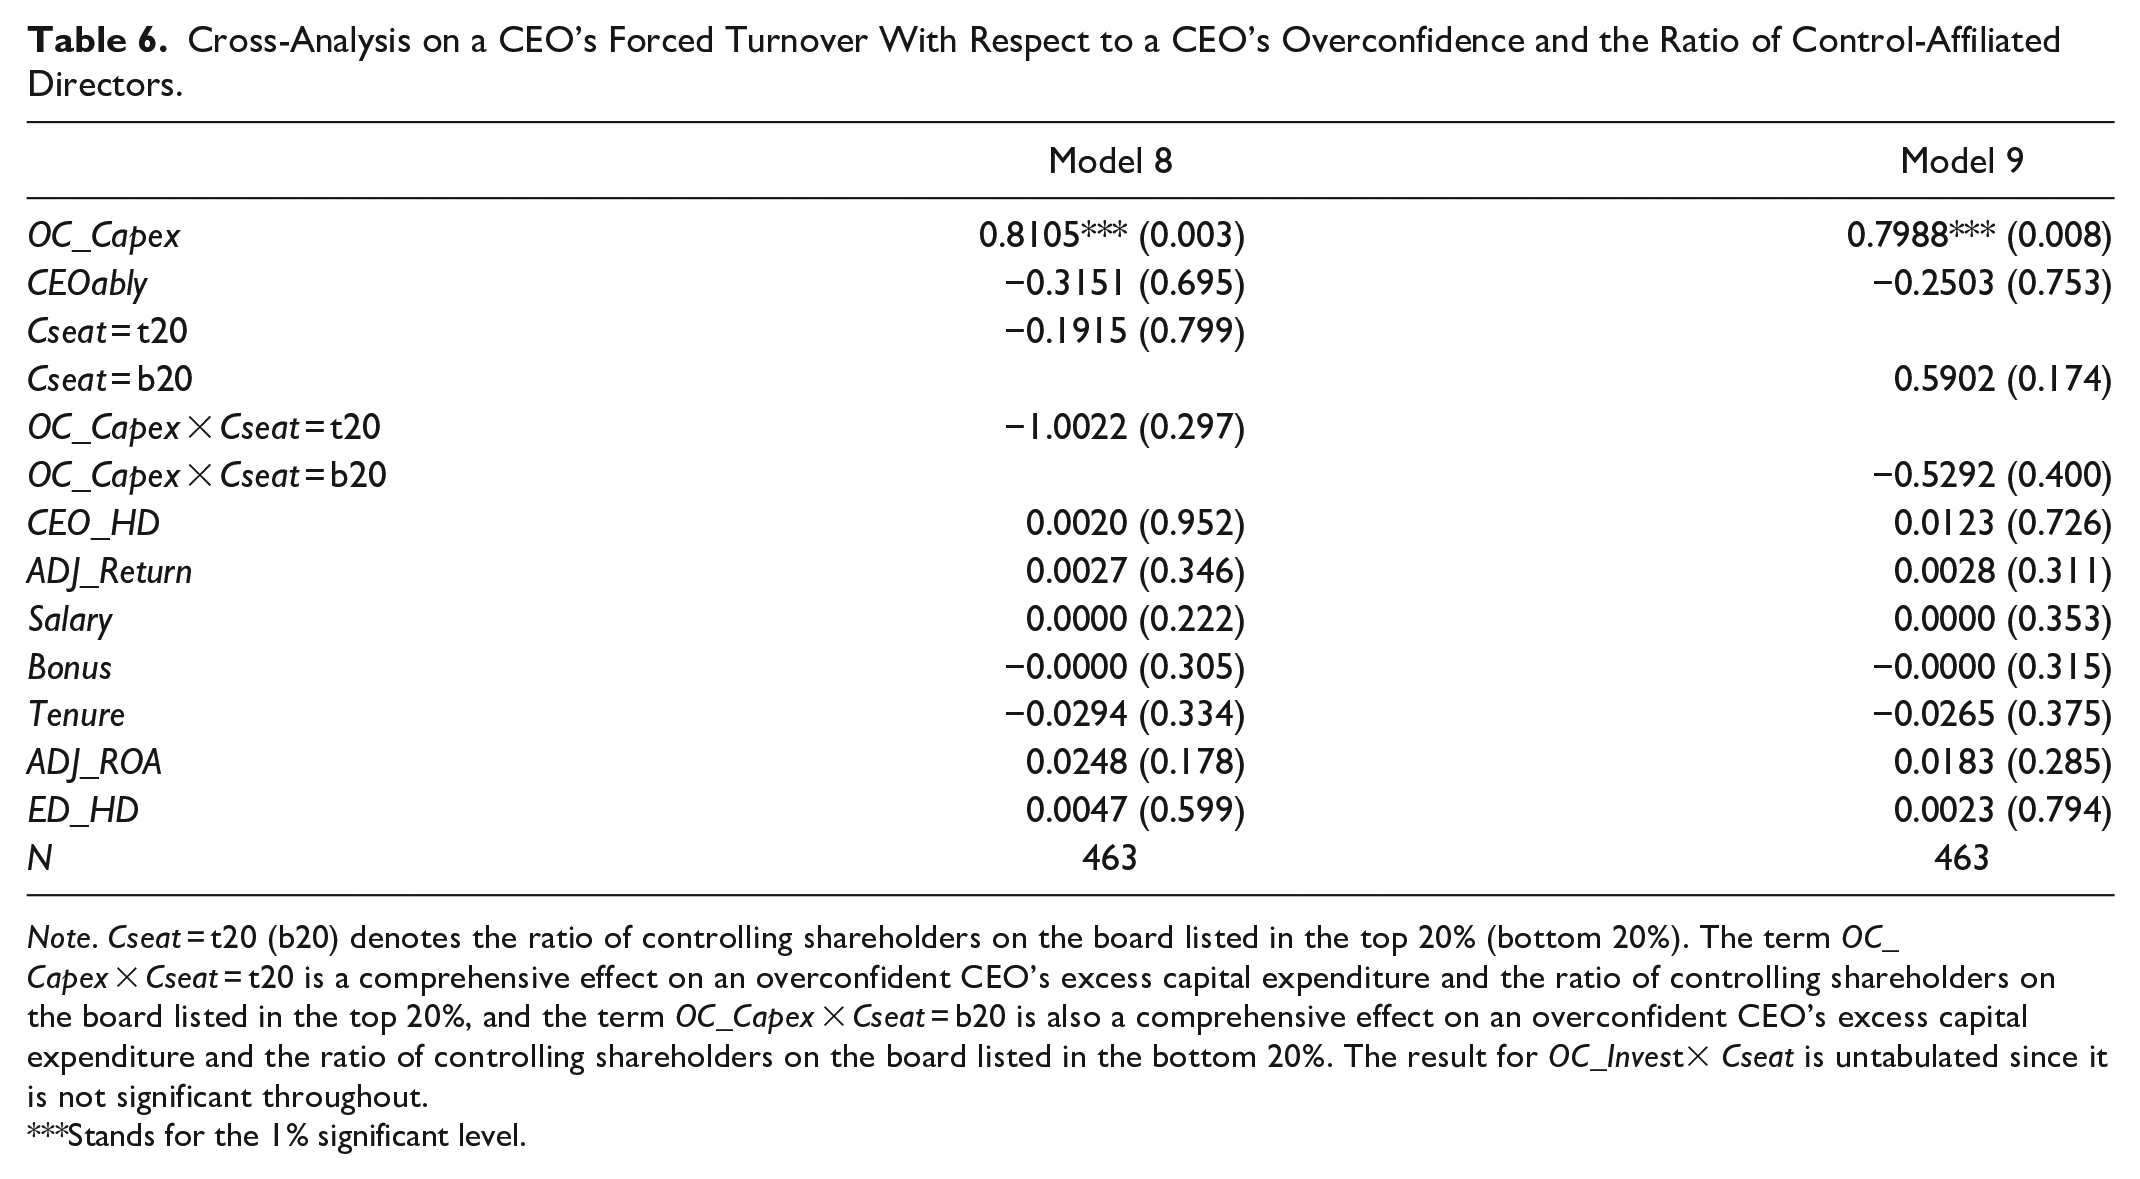
Note. Cseat = t20 (b20) denotes the ratio of controlling shareholders on the board listed in the top 20% (bottom 20%). The term OC_Capex × Cseat = t20 is a comprehensive effect on an overconfident CEO’s excess capital expenditure and the ratio of controlling shareholders on the board listed in the top 20%, and the term OC_Capex × Cseat = b20 is also a comprehensive effect on an overconfident CEO’s excess capital expenditure and the ratio of controlling shareholders on the board listed in the bottom 20%. The result for OC_Invest× Cseat is untabulated since it is not significant throughout.
Stands for the 1% significant level.
We here conduct two investigations: (i) the relationship between an overconfident CEO’s forced turnover risk and the company’s earnings by cross-analysis in Table 7 and (ii) the relationship between an overconfident CEO’s forced turnover risk and his/her salary, also by cross-analysis in Table 8. In Table 7, Models 10 and 11 separate the company’s earnings into the types of top 20% (ADJ_Return = t20) and bottom 20% (ADJ_Return = b20). The results in the two models provide that an overconfident CEO with the firm’s financial performance (i.e., adjusted return of stock) in the bottom 20% of all observations is more likely to be fired (in terms of the OC_Capex × ADJ_Return = b20). Similarly, an overconfident CEO with the firm’s financial performance in the top 20% of all observations is less likely to be fired (in terms of the OC_Asset × ADJ_Return = t20). In other words, an overconfident CEO with a low (high) firm value will face high (low) forced turnover risk. This finding is consistent with the results of Malmendier and Tate (2005a, 2005b, 2008), Campbell et al. (2011), and Graham et al. (2013).
A Cross-Analysis on a CEO’s Forced Turnover With Respect to Overconfidence and the Company’s Earnings.

Note. The term OC_Capex × ADJ_Return = t(b)20 stands for the cross-relationship whereby a CEO with overconfidence executes excess capital expenditure that creates an adjusted return of stock listed in the top (bottom) 20% of all observations. The term OC_Invest × ADJ_Return = t(b)20 stands for a cross-relationship whereby a CEO with overconfidence executes overinvestment that creates an adjusted return of stock listed in the top (bottom) 20% of all observations.
Stands for the 5% significant level; and *stands for the 10% significant level.
Cross-Analysis on a CEO’s Forced Turnover With Respect to Overconfidence and His/Her Rewards.

Note. The term OC_Capex × Salary (Bonus) = t20 stands for the cross-relationship that an overconfident CEO executes excess capital expenditure and his/her salary (bonus) is listed in the top 20% of all observations. The term OC_Capex × Salary (Bonus) = t10 stands for the cross-relationship that an overconfident CEO executes excess capital expenditure and his/her salary (bonus) is listed in the top 10% of all observations. The term OC_Invest × Salary (Bonus) = t20 stands for the cross-relationship that an overconfident CEO executes overinvestment and his/her salary (bonus) is listed in the top 20% of all observations. The term OC_Invest × Salary (Bonus) = t10 stands for the cross-relationship that an overconfident CEO executes overinvestment and his/her salary (bonus) is listed in the top 10% of all observations.
Stands for the 1% significant level; **stands for the 5% significant level; and *stands for the 10% significant level.
Table 8 conducts cross-analysis in which an overconfident CEO’s forced turnover risk relates to his/her performance rewards. We divide the overconfidence type into excess capital expenditure and overinvestment, divide the CEO’s rewards into salary and bonus, and divide the reward’s level into the top 20% and 10% to create four models (Models 12–15). All models’ results are consistent in that no matter for which CEO overconfidence type, no matter which CEO reward type, and no matter if CEO reward is listed in the top 20% or 10% of all observations, the test results are insignificant, meaning there is a comprehensive effect on the types of CEO overconfident performance, reward, and reward level that do not have any significant influence on CEO’s forced turnover risk. We conclude that the main reason causing a CEO’s forced turnover does not relate to the reward type and reward level, because the reward may be the one reason that causes a CEO’s voluntary turnover instead of forced turnover.
We summarize the implication results from the regression analysis as follows.
(1) The relationship between CEOs’ overconfidence in terms of OC_Capex and CEOs turnover is positively significant, implying that managerial bias brings about value-decreasing investments, affects firm performance, and increases the risk of CEOs being fired accordingly. Managers’ overconfidence raises their risk of dismissal, which is generally confirmed in this paper. As mentioned above, managers who inflate themselves due to cognitive disorders or miscalculations of their abilities will usually endanger their work. This implies that an incompetent and overconfident manager will often make wrong business decisions.
(2) Taiwan is characterized by a high percentage of controlling shareholders, especially for family firms (Claessens et al., 2000; La Porta et al., 1999). Yeh and Woidtke (2005) indicate that if the number of family members sitting on the board is high, then this represents poor governance.
The negative regression coefficient of Cseat implies that the more participants there are sitting on the board, the less the probability is of managers being dismissed. Our empirical result shows that the control rights formed by the pyramid and cross-shareholding structure are greater than the cash flow rights. Therefore, family enterprises usually enter the board of directors through more control rights. Moreover, the managers of family businesses are usually family members themselves, and so they are less likely to fire their own families, implying that the deeper the enterprise participates in the board of directors, the lower is the probability of managers being dismissed. However, the negative effect is not significant for an “overconfident” CEO since the interaction term of OC_Capex × Cseat is not significant.
(3) The negative regression coefficient of OC_Capex × CEOably implies that overconfident managers will reduce their chances of dismissal if they have strong management ability. As mentioned above, part of the self-confidence of overconfident managers comes from overestimating the return on investment, thus resulting in a loss to the company. Nevertheless, the empirical results imply that if overconfident managers have stronger professional management ability, then the situation of overestimating investment financial payoff will decrease significantly.
(4) The negative regression coefficient of OC_Capex × ADJ_Return = b20 indicates that if the market performance of enterprises is lower, then the probability of overconfident managers being fired becomes higher. This again shows that overconfidence endangers not only the operations of a company, but also managers’ own work.
Conclusions
This study investigates how the CEO forced turnover risk is associated with CEOs’ overconfidence. Specifically, we shed light on the impact of controlling shareholders of family firms on such forced turnover using a sample of Taiwanese companies over the period of 2008 to 2016. The contribution of this paper is to investigate an overconfident CEO’s forced turnover risk under the consideration of business and management ability and the ratio of control-affiliated directors, as the latter’s impact on a CEO’s forced turnover risk is seldom found in the literature. This research concludes that (i) an overconfident CEO faces high forced turnover risk; but (ii) an overconfident CEO’s forced turnover risk is not significantly associated with the ratio of control-affiliated directors; however, (iii) an overconfident CEO’s forced turnover is related to his/her business and management ability instead.
An overconfident CEO engages in action to deteriorate the corporate’s value and to increase his/her forced turnover risk. Based on our study result and the past literature knowledge, we provide a policy recommendation to avoid CEO’s overconfidence to deteriorate the corporate’s value and to decrease his/her forced turnover risk as follows. Increasing the number of independent directors and external monitoring may create a form of accounting conservatism that not only maintains the corporate’s value, but also decreases the risk of CEO forced turnover. Females are less associated with aggressive investment policies due to their natural character toward finance. Hence, female participation on the board of directors may attenuate a CEO’s views on overconfident investment policies. The high ratio of founder-controlled family corporates in Asian society is a common thing, but family-controlled corporates exhibit weak management for an overconfident CEO. One available way to inhibit overconfidence management in family-controlled firms is by increasing the number of independent directors and/or female participation in the board. Overall, the agency problem is a critical point among shareholders, directors, and CEO. Agency cost may decrease and create a win-win-win atmosphere among the three through elevated supervision on CEO performance.
The current study does not classify the samples of the 463 listed companies into various industrial categories, and hence our conclusion is an overall observation with respect to these listed companies in Taiwan. A future study can classify the samples into different industries and go one step further to search for conclusions with respect to different industrial characteristics. Finally, the issues of the forced turnover effect and an overconfident CEO can also individually correlate to different topics such as the “big baths” issue in accounting or could bring together the forced turnover effect and tax issue.
Footnotes
Appendix
Table A1 presents the main independent variables’ detailed definitions in this study.
Declaration of Conflicting Interests
The author(s) declared no potential conflicts of interest with respect to the research, authorship, and/or publication of this article.
Funding
The author(s) received no financial support for the research, authorship, and/or publication of this article.