
Abstract
In the present scenario, services have the largest domination in consumers’ lives and constitute a large part of the world economy. The researchers and practitioners have given limited research attention to transformative consumer research which affects consumer well-being. In this study, a causal relationship among the factors influencing the performance of an organization providing the transformative services has been analyzed using total interpretive structural modeling (TISM). The factors influencing the services have been identified through the literature review. After identifying the factors, TISM has been used to interpret the direct as well as significant transitive linkages among the factors. The empirical results suggest that top management plays a big role in consumer well-being along with the welfare of society. Devotion toward the well-being of the broader level of society depends on the top management’s commitment toward corporate social responsibility and respect for the rule of laws. These are the major factors influencing the performance of the organization other than employee satisfaction, excellent service quality, use of information technology and e-commerce, and so on.
Keywords
Introduction
The service industry constitutes a major part of the economy of most of the countries in the world (Buckley & Majumdar, 2018). The services have been integrated with the day-to-day requirements of the people and have great contributions to the gross domestic product (GDP). TSR is a relatively new area of research (Rosenbaum et al., 2011). The main emphasis of TSR is on the individual and collective well-being (Ostrom et al., 2015). TSR is concerned with the well-being of consumers, employees, and the broader society (Roy, 2017). The service sector is one of the dominant sectors in the Indian GDP (Ministry of Statistics and Programme Implementation, 2019). It has attracted significant foreign investment and contributed significantly to exports. It has also created a great employment opportunity. This sector covers a wide business of activities such as trade, health care, warehousing, transport, information and communication technology, insurance, hotel and restaurants, real estate, banking and finance, community, social and personal services, and other transformative services.
The performance excellence of a service organization and its continuation has become a great challenge for the management. The availability of research articles on performance measurement of a manufacturing organization is very large in comparison to the service organization. However, some research articles on the performance of service organizations have also been published such as Husgafvel et al. (2014) has given more stress on the social sustainability of the process industry. Similarly, Hussain et al. (2016) has focused their attention on supply chain sustainability in the service industry. Quality is one of the important parameters for the service organizations, but beyond the quality, some other parameters are to be addressed properly especially in the case of a transformative type of service organization. These parameters are trust and confidence-building with employees as well as customers, employee empowerment and participation (Bateman & Snell, 2007), responsiveness (Masrurul, 2019), lead-time reduction (Jaff & Ivanov, 2016) corporate social responsibility, use of information technology (IT) and e-commerce, respect for the rule of laws, brand image, and market reputation (Kotler & Keller, 2016; Suhartanto, 2011), and so on. The objectives of this study are as follows:
To identify the major factors influencing the performance of an organization providing transformative services,
To find the causal relationships among these factors,
To produce a hierarchy of a causal relationship with logical details.
This study helps in linking the factors influencing the performance of an organization, that is, how do they influence each other? The important factors were observed from the past literature and incorporated in the analysis. The relationships among these factors were developed based on the opinion of the personals working in the banking sector, health care organizations, education sector, financial sector, and telecommunication sector in India. Only those opinions are incorporated into this study, which is most common (having the highest frequency). Total Interpretative Structure Modeling (TISM) is used as a framework for the performance analysis of a service organization. This model transforms unclear and poorly articulated model into a clear and well-designed model. TISM approach establishes the causal relationship among these factors in a structured form. TISM has been used by many researchers in the analysis and linking of factors in different applications such as Supply Chain Management, analysis of flexible systems, e-governance, and so on. This study may help the manager in achieving high customer satisfaction, good revenue levels, and positive word-of-mouth reputation of the organization, increased market share, and so on.
The paper is structured as follows. In section 2, the previous works are summarized and research gaps are identified. In section 3, the research methodology with case applications is discussed. In section 4, results and discussions are presented. Finally, in section 5, the article is concluded by highlighting the limitations of the work.
Literature Review
The performance management of a service organization has been a challenging task due to the involvement of human psychology and the self-satisfaction of producers and consumers in service production and consumption. The term performance measurement can be defined as the quantification of the efficiency and effectiveness of action (Neely et al., 1995), where the effectiveness is the extent of satisfaction of the customer’s need and efficiency is the rate of economically using the corporation’s resources in service production. For better performance management, some approaches have been proposed in the literature. Kaplan and Norton’s (1993) proposed a balanced scorecard for performance measurement, considering all the perspectives such as internal customer, financial, customer and stakeholders, and learning and growth of the organization. Dixon et al. (1990) utilized their Performance Measurement Questionnaire (PMQ) to recognize the qualities and failings in the execution. Shieh et al. (2020) measured the efficiency of the life insurance companies using a four-stage Data Envelopment Analysis (DEA).
It has been observed that the design of performance measures is very poorly defined in many companies creating a lot of confusion and misunderstanding. According to Bourne et al. (1998), a performance measure record sheet is used to record the definition of the performance measure. Once the information is collected regarding each measure, four tasks are to be completed which are, data creation, data collection, and data analysis and information distribution.
Most of the performance measures used are quantitative which may fit in the manufacturing industry, but for the service industry, many performance measures are qualitative. The decision about the service quality is very subjective, it must include the wellness of customers, employees, and society. It depends on many factors such as top management vision and leadership (Arshida & Agil 2013), corporate social responsibility (Hopkins, 2012), respect for the rules of law (Zurn et al., 2012), and transparency in dealing (Rawlins, 2009). Very few researches have addressed these issues which lead to word of mouth for the appreciation of the services and the organization. The Top management commitment is considered an important success factor for the performance improvement of the organization. The main direction of the organization regarding the operations of various activities is based on the policy of the top management consisting of the vision and mission of the organization. Service quality is one of the parameters of the performance of the organization. Responsiveness, Tangibility, Assurance, Empathy, and Reliability are picked as free factors while consumer loyalty and customer satisfaction are considered as needy factors (Masrurul, 2019). However, in the present study, the responsiveness of the service provider toward customer complaints regarding services gives more importance than the other service parameters.
Customer satisfaction and customer loyalty are the important parameters to judge the service performance. However, considering financial success, customer loyalty, and customer satisfaction are not always related closely (Williams & Naumann, 2011). There are various reasons and factors such as product, market segment, and price that can influence customer behavior. Some of the important references for the various factors considered in the performance analysis in the paper are summarized in Table 1.
Factors Influencing the Performance of Service Organization.

Note. IT = information technology; CSR = corporate social responsibility.
It can be observed that the existing literature does not give the proper weightage to the employee satisfaction and welfare for performance measurement of the organization. In this study, customers’ and employees’ satisfaction with service cost and quality, e-commerce, transparency in dealing, corporate social responsibility, respect for the rule of laws are kept in the center to measure the performance of the organization. Following research gaps are identified based on the literature review:
Most of the measures identified for the performance measurement of service organizations are quantitative. The qualitative measures are also to be incorporated.
Very few research highlighted the factors having subjective, such as respect for the rule of law; corporate social responsibility, that is, well-being of broader society employee empowerment; employee participation; and satisfaction.
There is a lack of studies on the causal relationships among the factors influencing the performance of service organizations.
Research Methodology and Case Application
The relationship among the various factors is established with the help of the experts (employees and executives) and consumers from the service industry such as the banking, health-care, education, and telecom sector. Total interpretive structural modeling (TISM) empowers unpredictable and complex relations of interrelated factors in the system in a graphical form (Sushil & Chroust, 2015). TISM is an extension of the ISM for better understanding and analysis (Sushil, 2012). Some of the most cited articles on TISM are listed in Table 2.
Some of the Important Applications of TISM.

Note. TISM = total interpretive structural modeling; IT = information technology.
Total Interpretive Structural Modeling (TISM)
TISM is used to develop a hierarchical relationship structure of the concerned factors. It incorporates the interpretation of the influence of the embedded objects and produces a directed graph for a complex system in a simplified way. This qualitative modeling has been used by researchers in diverse fields of applications such as Green Supply Chain Management (Dubey et al., 2015), Telecom Service Providers (Yadav, 2014), Agile Manufacturing System (Sindhwani & Malhotra, 2016), Flexible Manufacturing System (P. Kumar et al., 2008), and so on.
ISM lacks in the interpretation of the interactive relationships represented by directed links for the identified factors/variables which may distort the process of decision making, whereas TISM interprets both nodes and links in the digraph and incorporates all the three key questions of theory building, that is, what, how, and why. Moreover, in ISM all transitive links are eliminated, whereas TISM can have some important transitive links giving a better explanatory framework.
In this study, TISM is used as a framework for the performance measurement of a service organization. This structural model enhances the understanding of the interaction between the leading and lagging factors concerning the performance of a service organization. The concerned factors for performance measurement of a service organization are collected from the literature review and semi-structured and open-ended questionnaires have been used to collect the practitioner’s opinion.
A semi-structured questionnaire was used to ask the opinion of the consumers and people working in the banking sector, health sector, education sector, financial sector, and telecommunication sector. These respondents were contacted personally, and their responses were noted during the interview. In this study, mainly, the banking sector, health sector, education sector, financial sector, and telecommunication sectors are considered for the analysis. The selective experts have been used from both the sectors as consumers and employees. Total 27 experts were interviewed and their opinion was noted. The most common opinions are incorporated into the TISM analysis. To validate the result of the TISM, a statistical analysis through mass opinion is required which is planned as an extension of the present study.
TISM methodology
The TISM methodology is discussed below step by step and its flowchart is shown in the Figure 1

Structure of TISM.
Step I: Factor identification
The factors influencing the performance of the service organization are identified through literature review.
Step II: Establishment of interaction among factors
To establish the interaction among the concerned factors four different types of symbols (V, A, X, and O) are used as explained in Table 3.
The Symbols Used in the Self –Interaction Matrix.
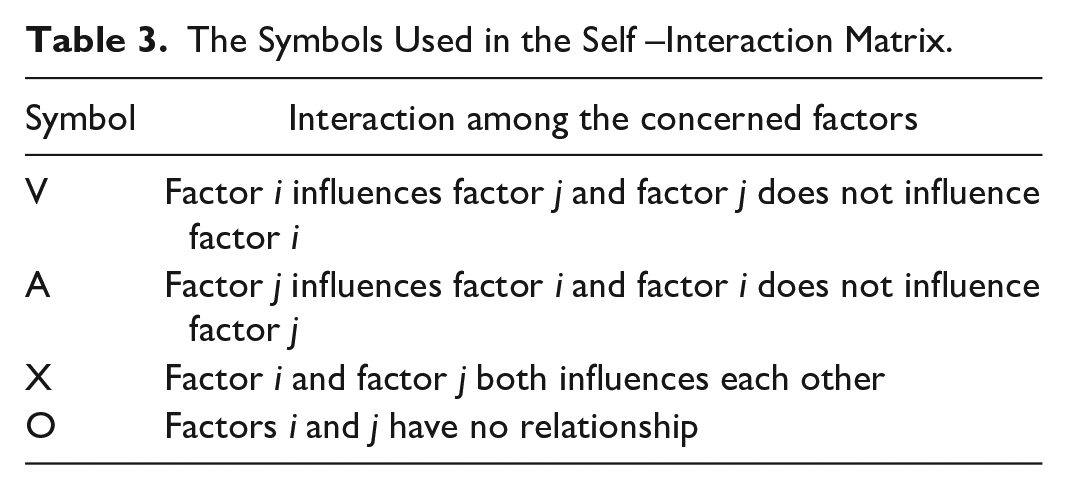
Based on these interactions, a self-interaction matrix has been developed as shown in Table 4.
Structural Self-Interaction Matrix (SSIM).

Note. SSIM = structural self-interaction matrix; IT = information technology.
Step III: Interpretation of relationship
The use of TISM is recommended due to the interpretation of the relationship of the influence of one factor over another. In this study, the experts are asked whether factor i influences factor j? If yes, in what way factor i influences factor j? It helps in achieving in-depth knowledge explicit. Overall, relationships and their interpretation based on the most common opinion of the experts are mentioned in Supplemental Appendix I (supplementary materials).
Step IV: Initial and final reachability matrices
A binary pairwise comparison matrix is developed based on the logic that the interaction yes is indicated by 1 and No is indicated by 0 in the reachability matrix as shown in Table 5. The matrix is also checked for the transitivity relationship (if factor A influences factor B and factor B influences factor C, then factor A will also influence the factor C). These transitive relationships among the factors are incorporated in the final reachability matrix by changing the value 0 to 1 as shown in Table 6. The transitive relationship is shown by the asterisk (*) symbol.
Initial Reachability Matrix.

Note. IT = information technology.
Final Reachability Matrix.

IT = information technology.
Italic letter with asterisk symbol symbol shows the transitive relationship.
Step V: Level partition of the factors
This is very similar to the ISM methodology. This provides levels to all the factors. The leveling is based on the similarity of reachability sets and intersection sets. After leveling of a particular factor, it is removed from all sets for the next iteration and again the next level of factors is found. The process of leveling is shown in Tables 7 and 8.
First Iteration for Leveling of the Factors.

Final Iterations and Leveling of Factors.

Step VI: Driving dependence diagram/ MICMAC analysis
The driving power and dependence of the factors are shown in Figure 2. Four quadrants are shown: autonomous, dependent, linkage, and driver. The first quadrant shows the autonomous factors as they are having low driving power and low dependence. The second quadrant shows the dependent factors as they are having low driving power and high dependence. The third quadrant shows the linkage factors as they are having high driving power and dependence. The fourth quadrant shows the drivers as the factors are having high driving power and low dependence.

Driving power and dependence diagram.
Step VII: Developing the digraph for TISM
The factors are arranged in the hierarchical form according to the levels iterated in Step V as mentioned in Table 8, and relationships are projected with a directed graph based on the relationship as shown in the reachability matrix. The transition links whose interpretation are crucial are also incorporated. The digraph is shown in Figure 3. The digraph incorporates the connective information and interpretations on the arrows.
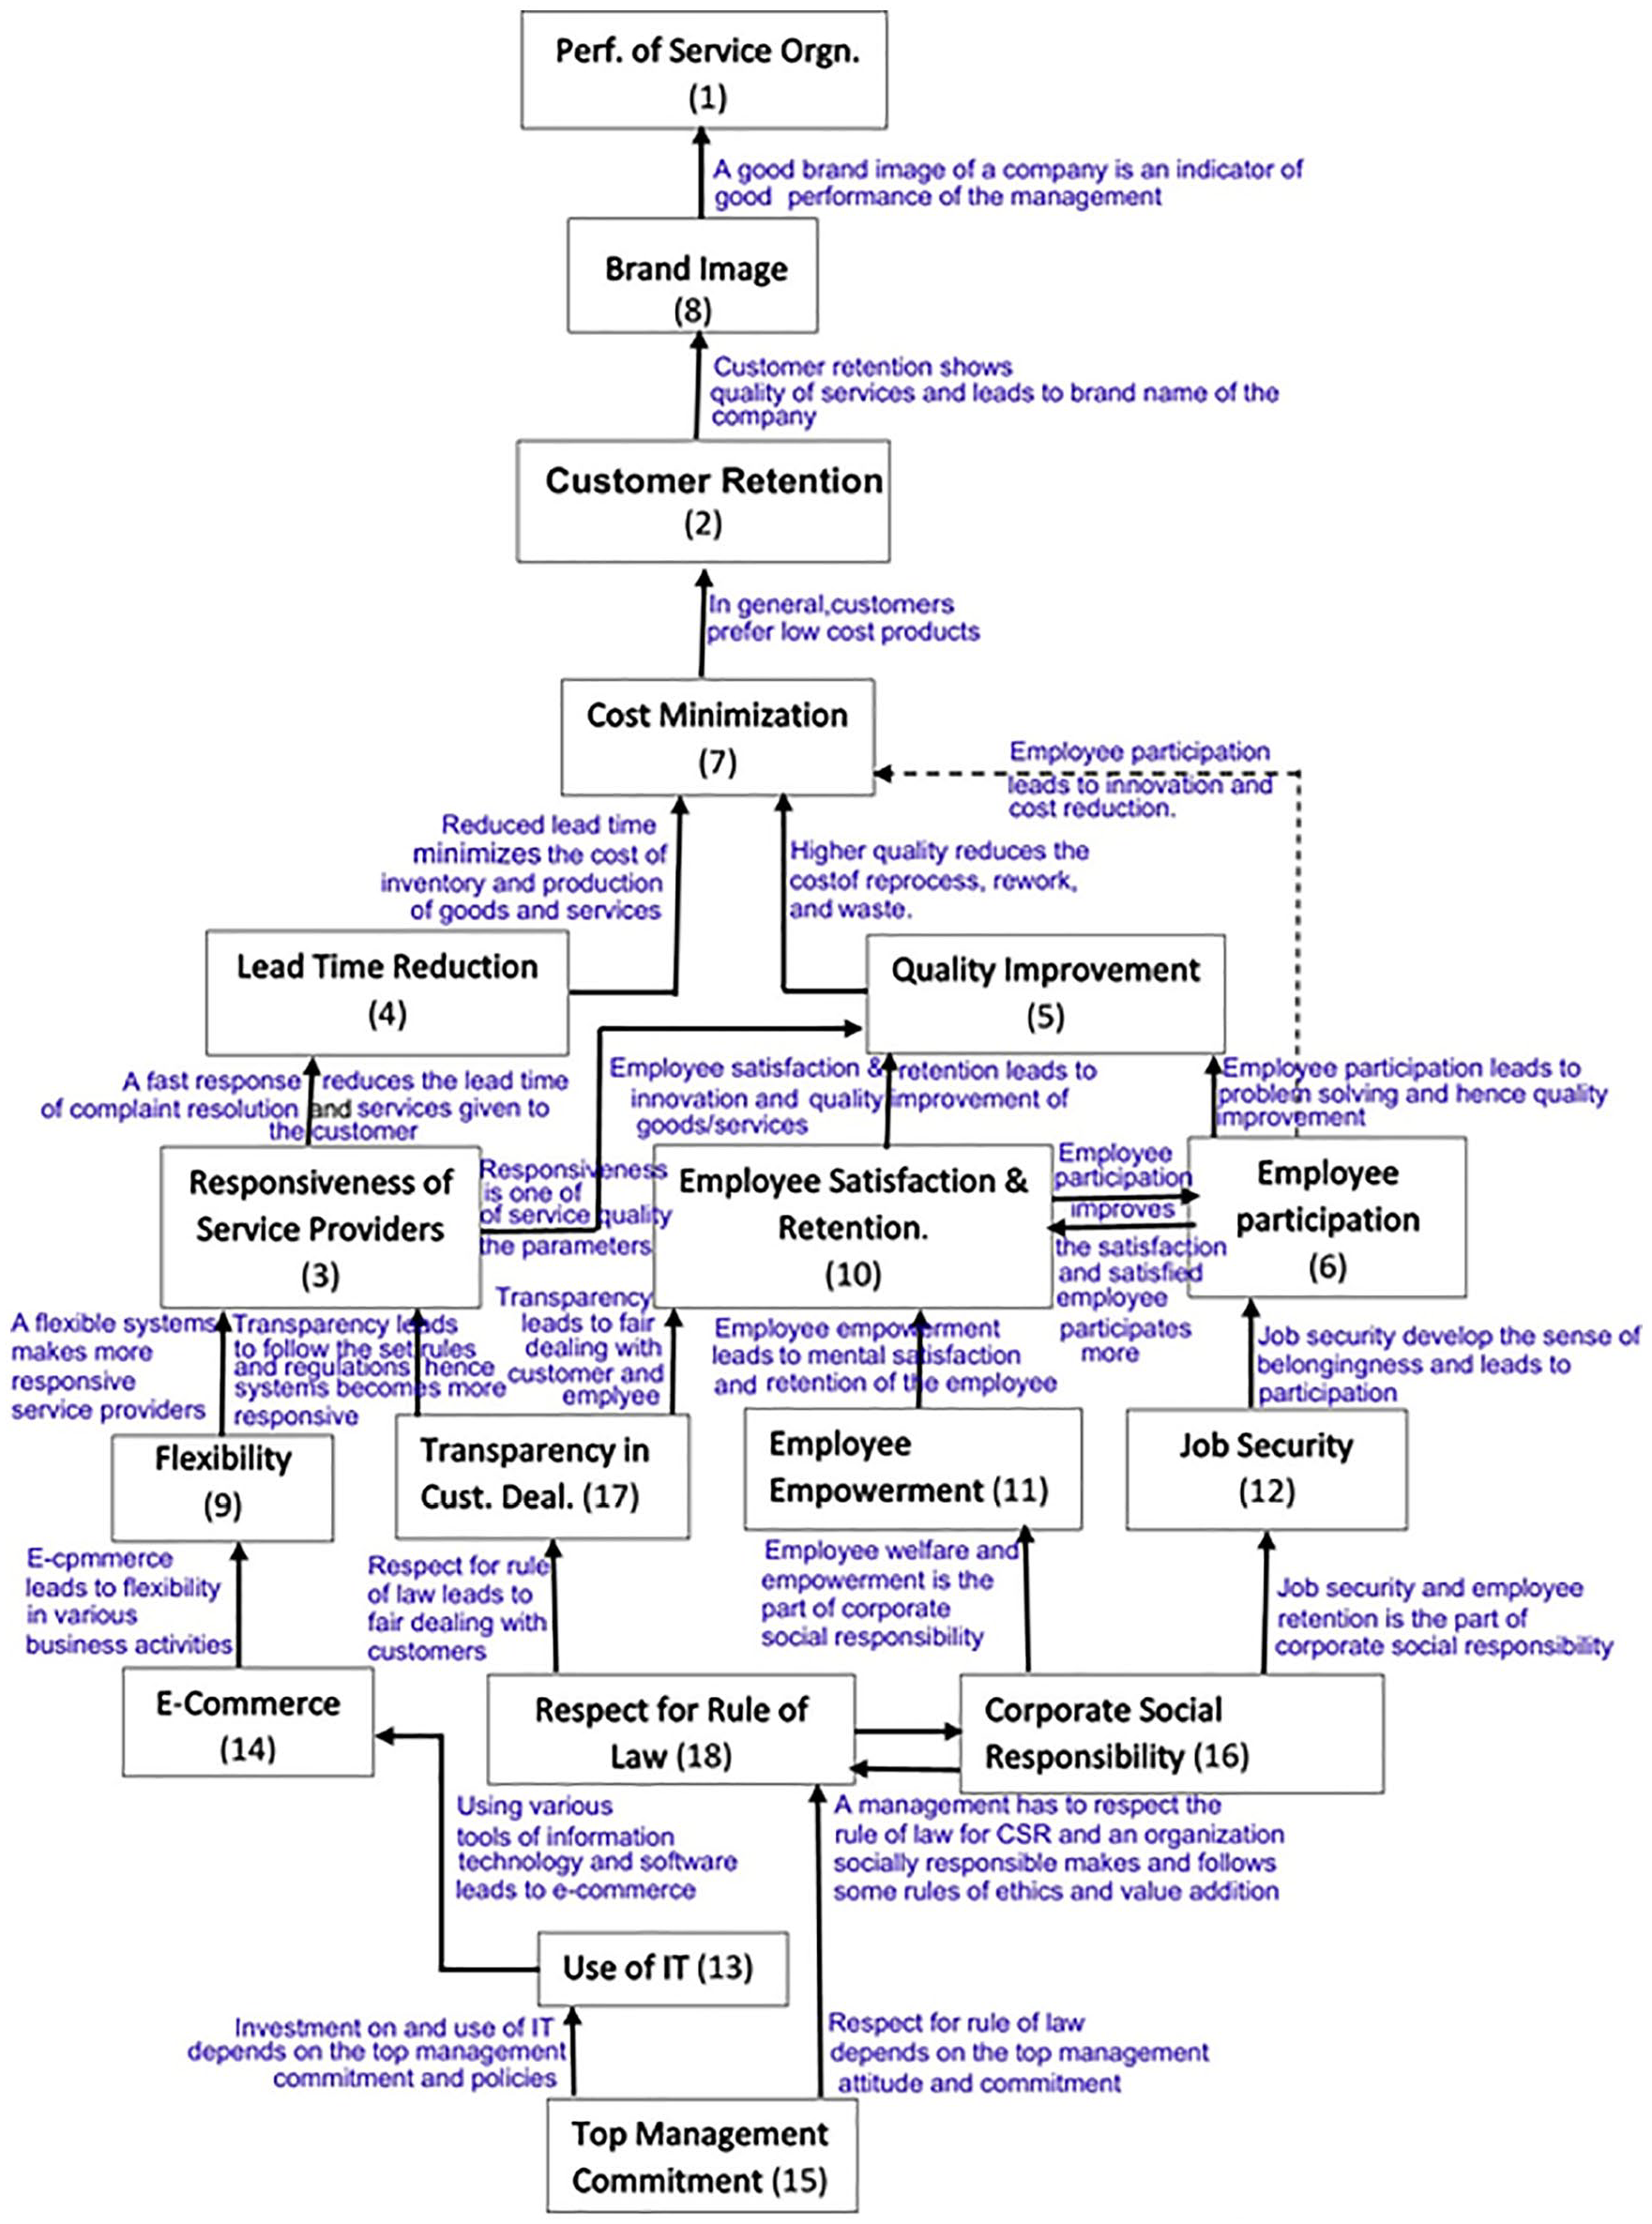
TISM hierarchy of the factors.
The transitivity concept is used to search and incorporate the indirect relationships in the final reachability matrix. The final reachability matrix is shown in Table 6. The reachability sets, antecedent sets, and intersection sets of each factor are shown in Table 7. Based on the commonality of the reachability set and intersection set, the final iteration is obtained as shown in Table 8. The reachability set of the factors comprises of itself and the other factors influenced by it, while the antecedent sets the factors comprises of itself and the factors influencing it. The intersection of these sets is derived for all the factors in the fourth column of Tables 7 and 8. The top-level is achieved by the factors for which the reachability and the intersection sets are the same. With the identification of the top-level factor, it is removed from consideration. Then, the same iteration is done to find out the factors in the second level. The iterations are continued to find the level of each factor. These levels are then arranged to get a digraph and the TISM model.
MICMAC analysis is concerned with the analysis of the driver power and the dependence of the factors. It is developed by clustering the factors into four clusters, namely Autonomous, Dependent, Linkage, and Drivers as shown in Figure 2. The dependence is shown on the x-axis and driving power on the y-axis in MICMAC analysis. The driving power of a factor is the summation of all “1s” in the rows and its dependence by the summation of all “1s” in the columns of the final reachability matrix.
Based on the, leveling of factors through the iterations and using the final reachability matrix hierarchy of the factors influencing the performance of service organizations has been produced in digraph as shown in Figure 3. In this digraph, only transitive relationships are represented whose interpretation is crucial. Direct links are shown by solid lines and dotted lines are used to represent significant transitive links in digraph.
Result and Discussion
Performance measurement of the service organization is relatively difficult in comparison to the manufacturing organization due to direct consultation of the consumer with the service providers. Customer satisfaction does not only depend on the quality of the services; it may also be concerned with some other factors that are given more emphasis in the present analysis. In this study, the hierarchy of the factors influencing the performance of service organizations was obtained after the analysis using total interpretive structural modeling as already discussed in the research methodology section. Some of the factors are directly related to the other factors (as shown by the solid lines), and few have transient relationships as shown by the dotted lines in the hierarchy. Here, the transient relationship is shown only for important and meaningful relations. All transient relationships are not much significant.
Top management commitment is the most important factor that influences all the factors responsible for the performance of an organization. It consists of the vision, trade policy, leadership, motivation to the employee, coordination, and so on. The top management leads the entire organization and provides the leadership to the organization to achieve the goals. It leads to the well-being of the employee, consumers, and society. It is directly related to social responsibility and some other major factors. In the literature related to performance measurement, many authors have already given the highest priority to the top management commitment (Arshida & Agil, 2013; P. Kumar et al., 2008, 2018; Zakuan et al., 2012) In this study, the top management commitment lies at the bottom of the hierarchy of the TISM which indicates the high driving power and negligible dependence. It also lies in the fourth cluster of the dependence-driving power diagram indicating high driving power and less dependence.
Nowadays, IT has become an integrated part of organizational activities. It is applicable to most of the functions of the organization. It may be applicable in the coordination and integration of supply chain, demand management, forecasting, inventory, e-commerce, business-to-business communication, business-to-customer communication, customer relationship management, supplier relationship management, automation, and so on. The importance of IT has also been highlighted by Chen and Hsiao (2012) and Bauer et al. (2008). In this study, it lies at the ninth level of the hierarchy, that is, just above the bottom which indicates the high driving power and less dependence. It also lies in the fourth cluster of the dependence-driving power diagram. It also lies in the fourth cluster of the dependence-driving power diagram indicating high driving power and less dependence. This study confirms the results from earlier studies that top management commitment has the highest priority, and also it will be worth mention, how parameters of this study (the settings, Geography, industry, sample, etc.) are different than earlier studies.
The performance cannot be measured only in terms of the profit earned by the organization. It also includes the efforts made by the organization for corporate social responsibility, environmental protection, and respect for the rule of law. Ethics, e-commerce, and so on. These factors lie in the eighth level of the hierarchy. The management of an organization always has some social linkage and should invest some of the profits in social welfare up to some extent. Social welfare may include education to poor people, sanitation and clean water, elimination of poverty, infrastructure development, and so on. Also, the management should respect the rule of law in terms of emission control and environmental protection. E-commerce is also useful in minimizing the lead-time and managing relationships with stakeholders. The importance of these factors has also been highlighted by Jiang et al. (2016); Li et al. (2013), and Zurn et al. (2012).
Flexibility is a tool to accommodate the change required in the systems as per the requirement of the market. The systems must be flexible to change themselves for changes in the design and demand of products and services. Flexibility is the tool to improve customer satisfaction as per their requirement. Another tool to make the customer satisfied is transparency in dealing with various business activities. The systems must be transparent for all and able to deal with the customers with ethics and responsibility. Employee-related factors are very important, especially in the service organization. The employee or the service providers are in direct contact with the customers; and the behavior, individual attention on the customer, fast response, and ability to provide the reliable and promised services to the customer are an integral part of the employee. An employee can provide all the above-mentioned services only when they are motivated and empowered sufficiently. Thus, employee empowerment and job security influence the performance of the employee. All these factors (flexibility, transparency in customer dealing, employee empowerment, and job security) are responsible for customer satisfaction and demand management and lie at the seventh level of the hierarchy of the TISM. The importance of these factors is also highlighted by Herzog et al. (2014), Wachsen and Blind (2011), Altuzarra and Serrano (2010), Backes-Gellner and Tour (2010), Rawlins (2009), Bateman and Snell (2007).
The factors at the sixth level of the hierarchy of the TISM are also the subsets of the employee-related behaviors such as responsiveness of service providers, employee participation in decision making, employee satisfaction, and retention. These factors are derived from employee empowerment and job security which affect the working performance of the employee. The importance of these factors is also highlighted by Masrurul (2019), Pakurár et al. (2019), Pradhan and Jena (2017), Ariani (2015). These factors lie in the first and second clusters of the dependence-driving power diagram and are more dependent on the other factors.
Lead-time reduction and quality improvement lie at the fifth level of the hierarchy. The lead-time can be reduced with proper coordination and collaboration, a cooperation of the employee, flexibility, use of IT, and so on. Quality improvement means the elimination of the gap between customer expectation and perception. All the factors at the bottom such as employee empowerment, employee participation, use of IT, customer focus are the philosophies of total quality management. The factors, lead-time reduction, and quality improvement lie in the second cluster of the dependence-driving power diagram which shows more dependency and less driving power. These factors are also highlighted by Moore et al. (2020), Jaff and Ivanov (2016), and Kärki (2012).
After the quality, the cost is an important factor that influences the customer. This can be minimized by maintaining the quality, eliminating the wastes, increasing the economy of scale, use of optimal design and development of products and services, and so on. It lies at the fourth level of the hierarchy and in the second cluster of the dependence- driving power diagram. It has a high dependency on other factors and less driving power. The cost has already been an important parameter for the performance measurement as highlighted by Beamon and Balcik (2008).
Customer retention is a big indicator of the performance of an organization. The customers can only be retained when they can be provided the right services at the right time at minimum costs. Thus, on-time delivery of services with minimum cost and quality of the services plays an important role in the retention of the customer. Customer retention may be called a mirror for the performance evaluation of an organization. It lies at the 3rd level of the hierarchy and has the highest dependency on many factors as shown at the bottom of the hierarchy. Its importance has also been observed by Kim et al. (2015), M. Hossain and Suchy (2013), Kumar et al. (2011), Williams and Naumann (2011).
Brand image lies at the second level of the hierarchy of the TISM. The large market size or high customer retention is the indicator of the good brand image of an organization. It has a high dependency on the other factors responsible for the good performance of an organization. Finally, the performance of the service organization is highly correlated with the brand image of the organization. A good brand image means a high performance of the organization. It has the highest dependency on all the other factors as shown in the hierarchy. Its importance has also been observed by Kotler and Keller (2016).
The main similarity of the study regarding the previous research is the identification of the factors influencing service performance as all these factors are extracted through the literature review (Table 1). In most of the previous research articles, the performance of the service providers and quality of the services are determined using these factors. Many articles are concerned with the improvement of service quality and profit earning of the organization. Correlation and regression analysis has been used in many research articles. But, very few articles have been devoted to observing the direction and interpretation of the linkage between the factors. Also, in this study, more focus is given on the well-being of the consumers and employees as a part of the transformative services. Qualitative and subjective aspects of the factors (such as corporate social responsibility, respect for rules of law, transparency in customer dealing, employee participation, empowerment, satisfaction, customer satisfaction, and retention, etc.) and interpretation of the linkage between them are the major contribution of the study. To improve the service performance including the well-being of the employees, consumers, and society to know the exact interrelationship between these factors is very important.
Conclusion
Nowadays, organizational performance doesn’t only depend on the quality of products and services and certain business activities but also the factors related to the well-being of consumers and the welfare of employees and societies. In this study, it has been observed that many factors are required for subjective assessment for performance analysis of a service organization. The proper relationship with service providers and customers with welfare initiatives for the society is very important to build a brand image/ market reputation which shows the overall performance of the organization. This study also shows that the top management commitment toward the implementation of IT, corporate social responsibility, employee empowerment and participation, customer satisfaction plays an important role. It has been observed that the factors related to the wellness of employees, consumers, and broader society play an important role in the overall performance of a transformative service organization due to the fully awake customers. It has been observed that the top management commitment, use of IT and e-commerce, corporate social responsibility, respect for the rule of law have more driving power. They affect employee satisfaction, customer satisfaction, quality improvement, cost reduction, and so on, and also help in achieving a higher brand image/market reputation. Top Management Commitment has high driving power and is the most important.
The model TISM is used to analyze the interactions among the different factors that affect the working of a transformative service organization. The factors incorporated in this analysis are linked to the causal relationship using TISM. The causal relationships were produced with the help of the opinion of the practitioners working in service organizations. The detailed causal relationships as opined by the practitioners are shown in Supplemental Appendix 1 and also indicated in the hierarchy of TISM. TISM also helps in the determination of the driving power and dependence of all the factors to improve the performance of the service organization.
Limitations and Scope of Future Work
TISM model is not capable of providing the information related to the extent to which one factor influences the other, that is, the degree of influence. Also, this method does not provide a performance index for the comparison of the performance of one organization with another. The second limitation is lacking in the statistical analysis of the data collected from the respondents. The analysis is based on the common opinion of the respondents/experts. It is to be validated through the mass opinion using some statistical analysis. All the different opinions of the respondents cannot be incorporated simultaneously. Thus, this study may be validated by a general questionnaire survey including consumers, service provider executives, employees, and the other people in the society observing the ecological effect.
Supplemental Material
sj-docx-1-sgo-10.1177_2158244021999394 – Supplemental material for An Analysis of Causal Relationships Among the Factors Affecting the Performance of a Service Organization
Supplemental material, sj-docx-1-sgo-10.1177_2158244021999394 for An Analysis of Causal Relationships Among the Factors Affecting the Performance of a Service Organization by Garima Sharma and Pravin Kumar in SAGE Open
Footnotes
Declaration of Conflicting Interests
The author(s) declared no potential conflicts of interest with respect to the research, authorship, and/or publication of this article.
Funding
The author(s) received no financial support for the research, authorship, and/or publication of this article.
Supplemental Material
Supplemental material for this article is available online.
References
Supplementary Material
Please find the following supplemental material available below.
For Open Access articles published under a Creative Commons License, all supplemental material carries the same license as the article it is associated with.
For non-Open Access articles published, all supplemental material carries a non-exclusive license, and permission requests for re-use of supplemental material or any part of supplemental material shall be sent directly to the copyright owner as specified in the copyright notice associated with the article.