
Abstract
Professional football clubs have a special characteristic not shared by other types of companies: their sport performance (on the field) is important, in addition to their financial performance (off the field). The aim of this paper is to calculate an efficiency measure using a model that combines performance (sport and economic) based on data envelopment analysis (DEA). The main factors affecting teams’ efficiency levels are investigated using cluster analysis. For a sample of Spanish football clubs, the findings indicate that clubs achieved a relatively high efficiency level for the period studied, and that the oldest teams with the most assets had the highest efficiency scores. These results could help club managers to improve the performance of their teams.
Introduction
Professional football attracts millions of spectators every season and generates an important volume of jobs and business. This activity spills over into multiple economic sectors, such as the hospitality, transport, media, and tourism. Because of its international importance, football is also a key element in the promotion of international trade.
In fact, football is an extremely important economic and social activity. In Spain, the professional football clubs are represented by the National Professional Football League ("La Liga"), a private association made up of 42 clubs (20 First División and 22 Second Division), responsible for organizing professional football competitions, under supervision of the Spanish Football Federation. The football industry generates economic activity equivalent to 1.37% of gross domestic product (GDP), and each Euro of income from football produces € 4.2 in the rest of the economy. Moreover, the professional football employs about 185,000 people, and each direct job generates approximately four new jobs in the country. In relation to social responsibility, La Liga invest € 1.72 for each € 100 of income, amounting to an investment ratio double that of other leagues, and 15 times higher than the business world (PricewaterhouseCoopers, 2018).
Football clubs are a special kind of business, because, although they operate in the same legal framework as other companies, they are very strongly conditioned by the sport activity on the field. This way of operating can impinge on their decision-making, and the presence of non-financial objectives raises the question of how to measure football clubs’ performance. Recent significant increase in the levels of debt incurred by professional football need to be managed better, and clubs need to improve their control over the financial resources available, taking into account the possible positive relationship between sporting and financial performance (Miragaia et al., 2019).
In this context, professional football team managers should develop management practices that help clubs to achieve two objectives simultaneously: success on the field and business performance. To help managers carry out their functions, we propose a method for benchmarking football clubs’ performance.
As professional football teams are grouped into leagues to compete, some researchers suggest that the efficiency of football teams should be calculated, considering them to be decision-making units (DMUs) in the leagues where they play (Szymanski, 2003). There are conflicting opinions on this issue, with Neale (1964) arguing that performance should be measured for the league, while Sloane (1971) argues that the unit of analysis for performance should be the club. In our research, the latter approach has been selected for the case of Spanish clubs (Terrien & Andreff, 2020).
The Spanish Football League is one of the most important in the world. This paper examines Spanish clubs’ performance in the First Division. Data envelopment analysis (DEA) is used (Banker et al., 1984; Charnes et al., 1978), because it makes it possible to calculate efficiency scores without previous knowledge of a specific production function. In a second stage, in order to identify the main factors that affect the teams’ efficiency levels, a cluster analysis study was implemented, to determine the link between the efficiency levels obtained and the variables selected.
The rest of the article is structured as follows. Section 2 presents a review of the literature on sports performance. Section 3 describes the methodology used: DEA and cluster analysis. Section 4 provides the design of the research and a description of the data, as well as the analysis of the results. Finally, Section 5 contains the main conclusions of this investigation.
Literature Review
For any company, the production function is the technical relationship between the inputs and their contribution to the outputs. Rottenberg (1956) treats a sport team like any other enterprise producing an output (sport success) by combining different inputs for the first time. This method has since been accepted as a standard methodology to in sporting production function studies (Rossi et al., 2019).
Following Rottenberg (1956), the efficiency of sport clubs depends on the talent of players and coaches, and also on the staff costs (Kulikova & Goshunova, 2013). In football, the best players show their talent with their teams in every match, forming a special part of the team. But individual success is not possible without the integration of players into the team. Therefore, both human capital and club income are important variables to for efficiency and success.
To measure clubs’ performance in this research, the DEA methodology was employed (Banker et al., 1984; Charnes et al., 1978). This method has been applied successfully to measure efficiency in different cases, in the public and private sectors, as well as in sport.
In recent years, this technique has been used in the assessment of the following fields: construction (Devicenzi et al., 2015), hospitals (Martín & Ortega-Díaz, 2016), the energy sector (Schuschny, 2007; Torres & Vasquez, 2008), ports (M. Guzmán & Guzmán, 2016), and universities (Vázquez, 2010). It has also been used in non-profit sectors, the social economy (I. Guzmán et al., 2013) and public administration (Zamora & Navarro, 2014). Many studies have addressed sports efficiency in different disciplines, such as baseball (Anderson & Sharp, 1997; Chen & Johnson, 2010; Lewis et al., 2009), cycling (Rogge et al., 2013), cricket (Amin & Sharma, 2014), Formula One (Gutiérrez & Lozano, 2014), tennis (Glass et al., 2015; Toloo, 2014), basketball (Cooper et al., 2009; Fizel & D’Itri, 1996), and olympic sports (De Carlos et al., 2017; Valério & Angulo-Meza, 2013). These studies are only a small selection from the numerous works that in recent years have applied DEA to calculating efficiency, as can be seen on the DEA zone website (Deazone, 2018), where more than 10,000 bibliographical references are listed.
With regard to football clubs, there is no consensus about the input and output variables that should be used to measure their performance, and DEA studies have proliferated using diverse inputs and outputs. It is possible to distinguish two basis approaches. In the first, the outputs are selected from variables relating to the profit (income or turnover) of the clubs, and the inputs from expenses. In the second approach, the selected variables refer to performance on the field, where inputs represent movement on the field and outputs represent sporting success (Espitia-Escuer & Garcia-Cebrián, 2020).
Some papers consider only sport variables, while others select economic factors as well (see Table 1). In order to estimate efficiency levels in professional football, it is possible to use sport variables from the matches played (shots on goal, minutes of control over the ball, points obtained, etc.), or to consider economic variables from the financial accounts (rotation, personnel expenses, etc.). Efficiency might also be studied by combining these two types of variables. In the present paper, the last approach was selected, taking economic and non-economic variables into account.
DEA Efficiency Football Studies (in Chronological Order, From Latest to Earliest).

Note. DMUs = decision-making units; DEA = data envelopment analysis; PSD = player stats database.
Source. Own elaboration.
Methodology
Measurement of Efficiency
Efficiency measures the performance of the economic DMU, taking into account the production possibilities and technology available. The concept of efficiency was investigated by Farrell (1957), to determine whether performance is achieved by the lowest consumption of resources or by the minimization of production costs. Technical or productive efficiency evaluates how to obtain a given output level with a predetermined combination of inputs, while cost efficiency evaluates the best input combination that can reach the stipulated level of output with the lowest cost of production factors, assuming that the cost of different inputs is known. The global efficiency of a given DMU is the product of technical efficiency and cost efficiency (Thanassoulis, 2001).
To calculate efficiency, two methodological approaches are possible (Parkan, 2002): parametric models, based on the specification of the production function, using mathematical techniques to estimate the parameters according to data submitted by DMUs (Coelli et al., 1998), and non-parametric models, which use the conditions that must be met by the set of production possibilities. The latter approach considers an efficient or “best practice” frontier, which is made up of efficient DMUs, without adopting a priori a production function (Thanassoulis, 2001).
The main advantage of the non-parametric approach is its flexibility to adapt to multi-product and lack-of-price environments, although it has the disadvantage of being deterministic in character, so that any deviation from the efficiency frontier is considered to be inefficient behavior of the evaluated DMU (Pastor, 1995).
Data Envelopment Analysis
The study reported in the present paper evaluates the efficiency of Spanish First Division football teams using the deterministic non-parametric methodology of DEA. This technique assesses relative efficiency by calculating a multidimensional ratio, which results in a ranking of efficiency scores, from production data provided by the sample under study. The DEA approach one of a group of techniques called frontiers methods, which evaluate the efficiency with reference to production functions. This methodology provides a benchmark by classifying teams as efficient or inefficient, so the latter are assessed with respect to the former.
Following the methodological approach of Charnes et al. (1978), the mathematical formulation of DEA is executed through a pattern of linear programming under the assumption that every DMU is operating at the optimal scale of operation (CCR model, Constant Returns to Scale), which makes it possible to calculate scores of global technical efficiency (ETCCR) without considering diseconomies of scale. Two possible orientations can be adopted, depending on the research objective: input-oriented models, which identify the highest radial reduction of inputs in order to obtain a certain level of outputs, and output-oriented models, which define the highest radial expansion of products based on certain inputs consumption. In other words, DEA determines the efficiency frontier as the piece-wise linear combination that envelops the input–output combinations as observed from the empirical data.
The input-oriented CCR model (TECCR) evaluates the efficiency by solving the following linear programming problem:

subject to:


where (X) and (Y) are matrices of the inputs and outputs by DMUj, and (θ z ) corresponds to the maximum radial reduction in the consumption of all the inputs of the evaluated unit. The variable (λ j ) is a non-negative intensity vector that determines how important the other DMUs in the sample are for constituting the benchmark against which the selected DMUz is assessed.
The constraints (2) and (3) of the model include (So) and (Si) variables as slacks for inputs and outputs respectively, to solve the problem regarding the variation of inputs/outputs of a particular inefficient DMU. Positive values for the slack variables indicate that improvements are necessary in some inputs and outputs, besides the radial reduction expressed by (θ z ).
Solving the model in Equations (1) to (4) for each DMU, we will obtain the value of the scalar (θ z ), which ranges between 0 and 1. When a chosen DMU has a value of (θ z ) less than 1, it is not considered to be efficient because it could be possible to attain the same output quantity by reducing the consumptions of inputs in the proportion (1 – θ z ). However, when an output-oriented model is selected, the scalar (ψ z ) represents the largest radial expansion of all the outputs produced by the unit being evaluated. The scalar (ψ z ) varies from 1 to ∞, and its technical efficiency score (δ z ) with a range between 0 and 1 can be obtained as the inverse of the scalar value (ψ z ) (δ z = 1/ψ z ).
Whereas the CCR model estimates the hypothesis of constant returns at scale to avoid the problem associated with scale inefficiencies, Banker et al. (1984) opt for an alternative model (BCC model) based on variable return to scale, by adding the constraint
When both models (CCR and BBC) are compared by considering the production function of a given DMU situated on the efficiency frontier of the BCC and CCR models, it is possible calculate the scale efficiency (SE) according to the mathematical formulation in Equations (5) to (6), where a lower value than unity (SE <1) indicates the existence of inefficiency caused by a non-optimized production scale:


where TECCR is the global technical efficiency, TEBCC is the pure technical efficiency, ES=1 is the scale efficiency, and ES<1 is the scale inefficiency.
Finally, the discrimination capacity of the DEA methodology should be evaluated by considering the number of variables number that make up the efficiency model. The total number of units evaluated (n) must be at least three times the sum of the inputs and outputs in the efficiency model (El-Maghary & Ladhelma, 1995; Parkan, 1987).
Cluster Analysis
Football clubs nowadays are corporate entities. In a second stage, a complementary research, cluster analysis was used to identify the possible influence of some business variables, that is, not depending on sport performance, might have on efficiency measurements (DEA scores). The following variables were selected: club size (TS), measured by the total assets on balance sheets, club age (TA), the number of years the club has existed, and the club’s accounting results (AR).
Cluster analysis is used when the hypotheses associated with the data structure are unknown a priori. To solve this problem, the hierarchical study of clusters makes it possible to find out the natural groupings in the dataset, and is especially important when the research refers to a small number of objects. K-means cluster analysis makes it possible to assign cases to a fixed number of groups based on a particular number of variables, and is a good strategic tool when there is a large number of cases to classify.
In our study, cluster analysis was developed in two stages. In the first stage, a hierarchical cluster analysis was selected to determine the correct number of groups using the Ward method. Then, in a second stage, a k-means cluster analysis was implemented with the groups determined by the hierarchical cluster.
Research Design: Data
This section is devoted to the empirical part of this research, where the non-parametric DEA methodology is applied. DMUs (in this case, professional football teams) are considered efficient if they are part of the border thus established.
Sample and Variables
To use DEA as a performance measure, a model must specify the output and input variables. The inputs highlight the most important expenses of professional football clubs taken from their income statements, included in their financial statements. The first variable includes the teams wages, which includes all the employees of the sports club (players, coaches and managers). The second variable corresponds to the general expenses incurred by the teams. Although these general expenses are not directly linked to on-field success, these costs are essential for the clubs to be able to carry out all their activities satisfactorily.
With regard to the output variables, income was used as a measure of economic success, considering the different kinds of revenue (radio, television, merchandising, and so on). However, as described in the introduction of this paper, our model of analysis mixes economic and sport performance, and so a non-economic additional output, such as points won in competitions, was also considered to calculate efficiency scores.
As noted above, depending on the research objective, there are two possible orientations for the efficiency model: output-oriented or input-oriented. In the case of professional football, the Union of European Football Associations (UEFA) recently decided to introduce Financial Fair Play (UEFA, 2015), so as to improve the overall financial health of European football clubs, as well as transparency in the world of football (Chelmis et al., 2019). The two main measures proposed by the Financial Fair Play Regulation are (a) clubs playing in European competitions must prove that they have no debt to other clubs, players or tax authorities, and (b) clubs can spend only €5 million more than they earn, in order to ensure equality of expenses and incomes, avoiding the generation of future debt. These rules came into force in 2011 as a form of financial control over clubs.
Consequently, an input-oriented model was selected for this study. Table 2 shows the variables (inputs and outputs) included in the efficiency model.
Efficiency Model Variables.

Source. Own elaboration.
The information used for the economic variables comes from the financial accounts of Spanish professional football clubs published in the SABIC Database, except in the cases of Athletic Club (2017), Fútbol Club Barcelona (2017), and Real Sociedad de Fútbol (2017), whose financial information were obtained from the clubs’ official websites. The information for the non-economic variable (points won) was gathered from the Spanish Football Federation (2017).
A group of 13 teams was selected for the study on the basis that it was possible to collect the information from each of them for the whole period selected, that is, four seasons. Descriptive statistics of efficiency model variables are reported in Table 3. With 13 football teams for each of the 4 seasons (DMUs), and 4 variables included in the efficiency model, the model has enough discriminatory power to calculate efficiency scores (Cooper et al., 2004).
Efficiency Model Variables: Descriptive Statistics.

Source. Own calculations.
Empirical Results
Results of Efficiency Analysis
Applying an input-oriented efficiency model, the performance levels achieved by Spanish football teams for seasons 2012 to 2013 and 2015 to 2016 (4 seasons) are reported in Table 4.
DEA Scores (Input-Oriented Model).

Note. CCR = Constant Returns to Scale; BCC = Variable Returns to Scale; DEA = data envelopment analysis.
Source. Own calculations.
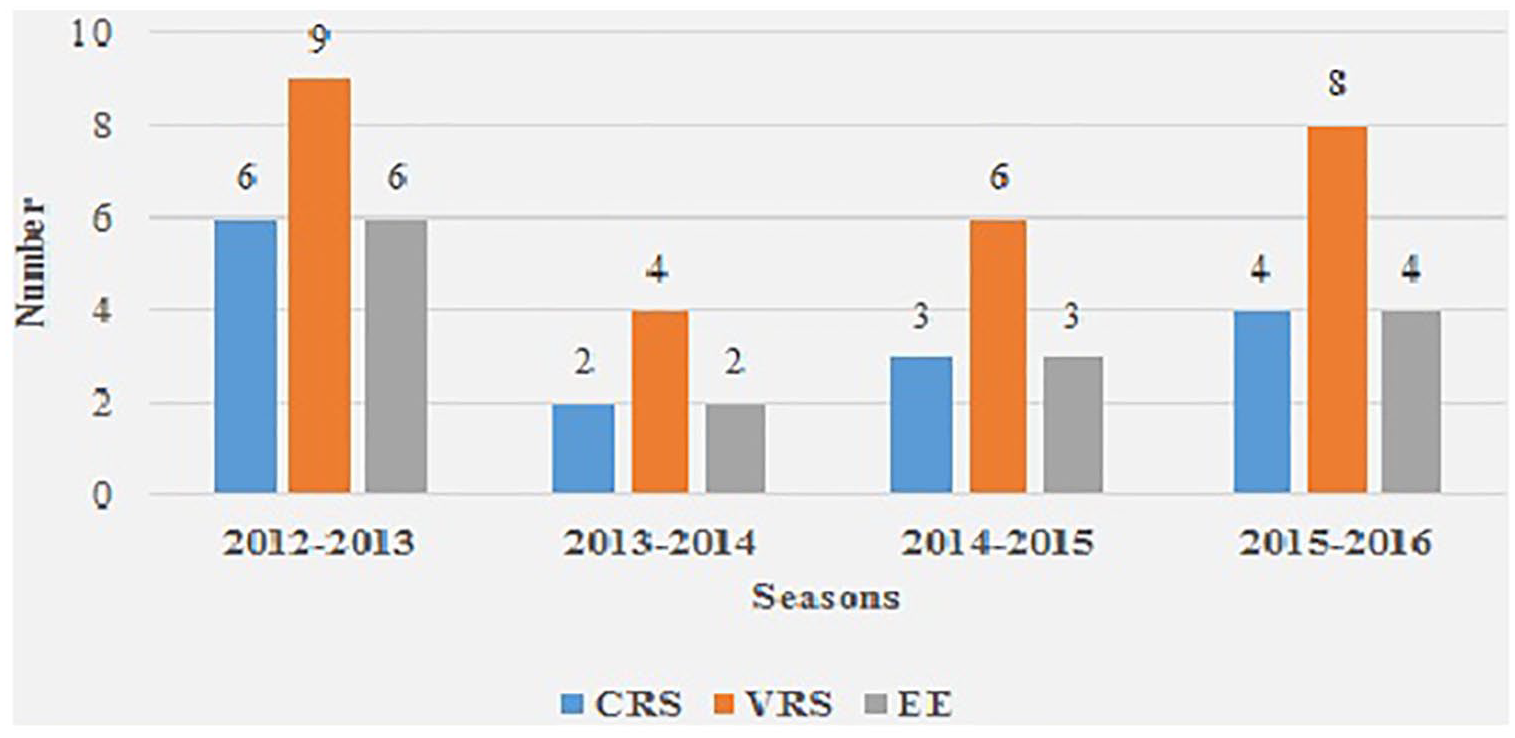
Graph 1 shows the evolution over time of the evaluated football teams’ performance, while Graph 2 shows the evolution of the number of efficient clubs. Table A1 includes each club’s efficiency score and also the number of efficient clubs (in absolute value and in percentage) calculated by the efficiency model selected and season.

Efficiency DEA scores.
Efficient clubs number.
Results of Cluster Analysis
After examining the levels of performance of Spanish football teams, a cluster analysis was conducted in order to find out the potential grouping of scores in both efficiency models (CCR and BCC models) based on some relevant variables of the selected clubs. For the pooled sample of the four evaluated seasons, the following variables were studied: (a) size (TS), measured by the total assets collected in the balance sheet of clubs; (b) age (TA), equivalent to years of existence of the different teams since their foundation; and (c) the accounting result (AR) obtained from the profit and loss account submitted by clubs each fiscal year.
The results obtained are included in Tables 5 to 7, where the descriptive statistics of both the grouping variable and the different resulting groups are collected. It can be observed that in all cases hierarchical cluster analysis suggested the existence of three groups based on the corresponding dendrogram, which were subsequently obtained by applying a k-means cluster analysis.
K-Means Cluster Analysis: Grouping Variable = Team Size (TS).

Source. STATA computer package, Version 13, was used for the resolution of cluster analysis.
Note. TS = total balance sheet asset (€000s); CCR = efficiency scores in CCR model; BCC = efficiency scores in BCC model.Significant differences: (***) at 1% level.
K-Means Cluster Analysis: Grouping Variable = Team Age (TA).
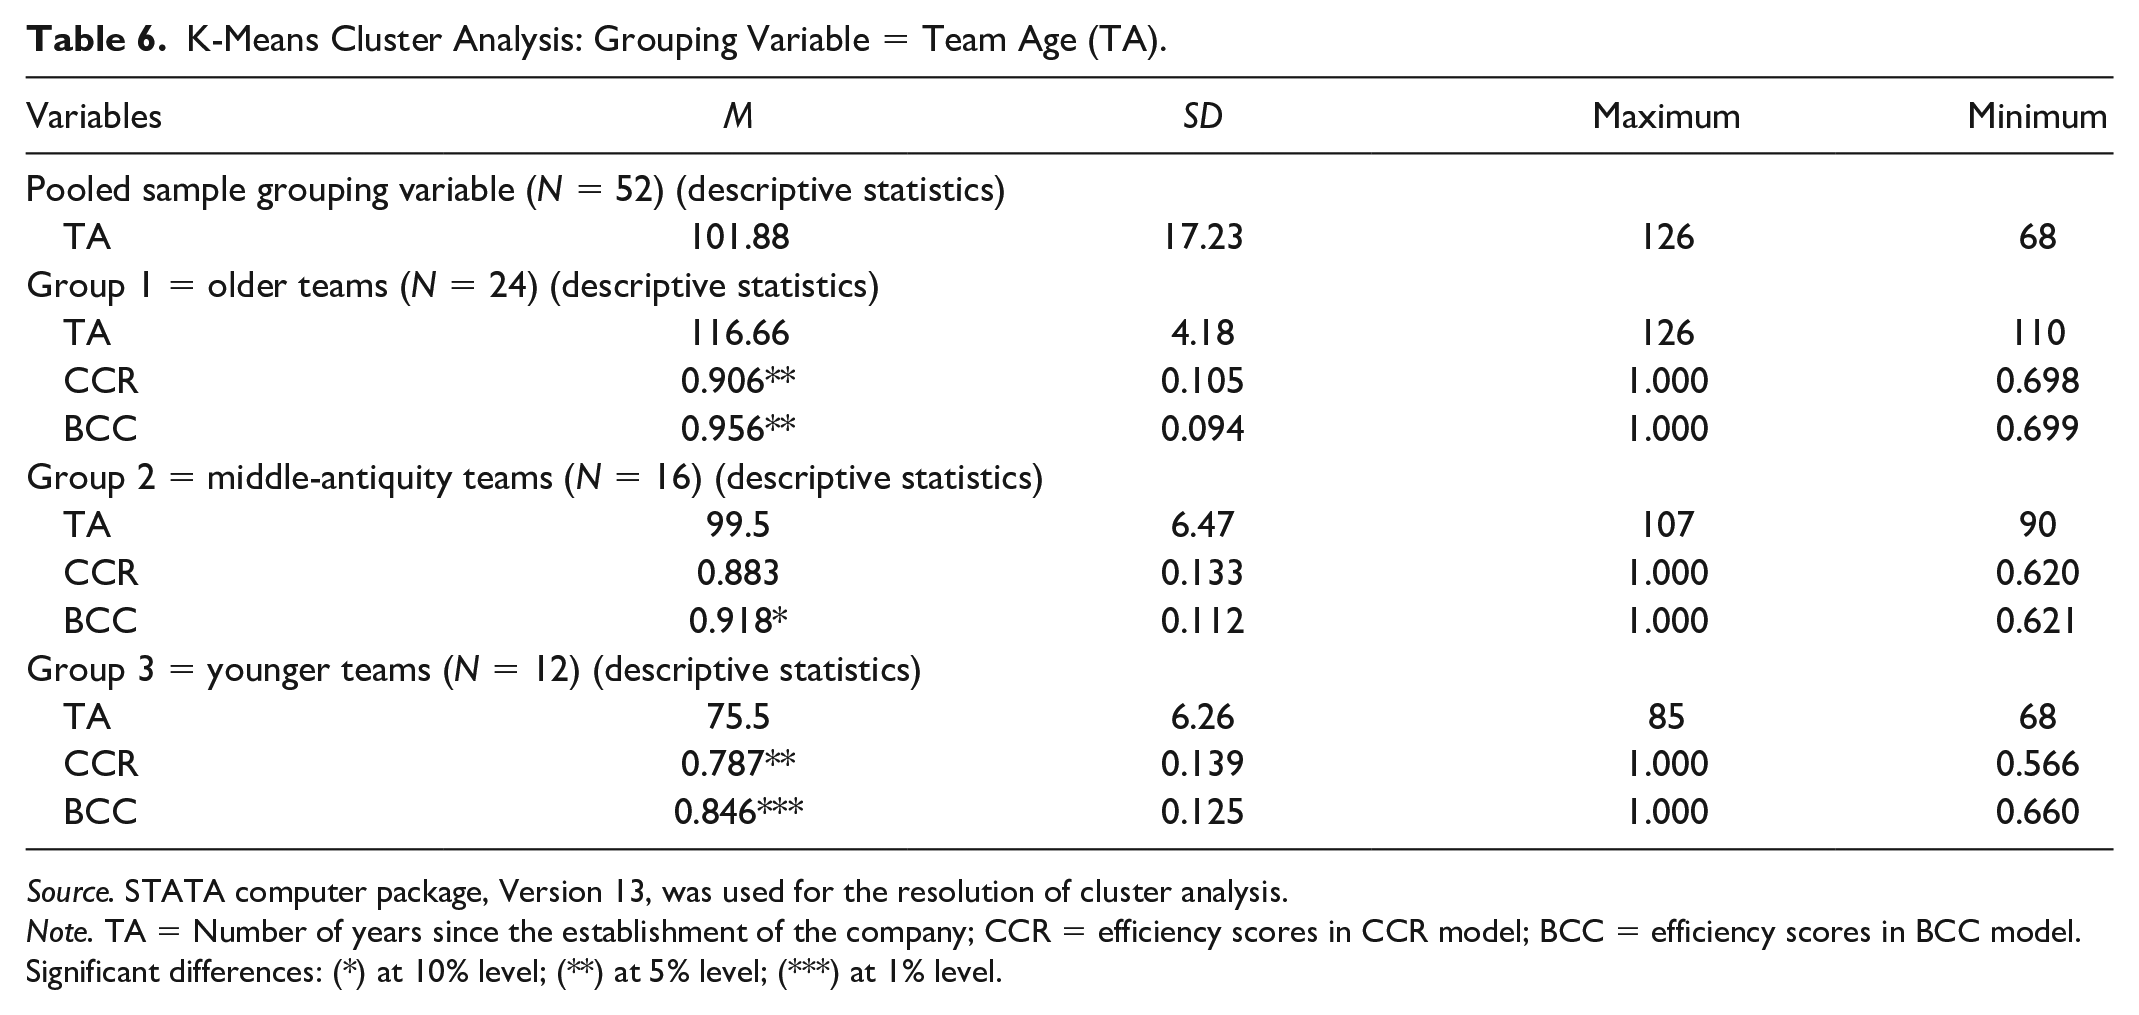
Source. STATA computer package, Version 13, was used for the resolution of cluster analysis.
Note. TA = Number of years since the establishment of the company; CCR = efficiency scores in CCR model; BCC = efficiency scores in BCC model.Significant differences: (*) at 10% level; (**) at 5% level; (***) at 1% level.
K-Means Cluster Analysis: Grouping Variable = Accounting Result (AR).

Note. AR = Accounting result (€ 000s); CCR = efficiency scores in CCR model; BCC = efficiency scores in BCC model.
Source. STATA computer package, Version 13, was used for the resolution of cluster analysis.
Discussion of Results
Implications for Theory
From a theoretical point of view, this paper analyzes the efficiency levels of football clubs in Spain based on Rottenberg’s approach (1956), assuming that their production function can be evaluated by considering their input combination (teams skills) to produce the outputs expected (sporting success). Following Sloane (1971), clubs are preferred as DMUs rather than the leagues of countries. Based on these criteria, a sample of teams from the First Division of the Spanish Professional Football League was selected to calculate the efficiency level over the seasons considered.
To determine the efficiency scores, the DEA technique was used, and another important problem arose when selecting the variables that make up the efficiency model. As previously mentioned in the literature review, this topic has been addressed by selecting either sporting aspects or economic aspects, or both.
The criteria applied by the authors of the reviewed papers (Table 1) to evaluate the efficiency of football clubs (papers evaluating the individual players’ performance are not considered), in 40% of papers used only sports variables, while in 5% of papers they used only economic variables. The remaining 55% used mixed models, taking into account both sports and economic variables. In this sense, we selected a mixed model, as the clubs are special companies that must achieve both goals: sporting success and financial success.
Implications for Practice
In accordance with the research framework, our main findings are the following.
Regarding clubs efficiency levels, when DEA model (Table 4) is applied assuming variable returns of scale (BCC model) for the four seasons assessed, pure technical efficiency reaches an average level of 91.9%. Therefore, clubs should reduce the resources employed (staff costs and other expenses) by 8.1%. However, assuming constant returns to scale (CCR model), the mean value of global efficiency decreases to 87%, and consequently the inputs should be reduced by approximately 13%. The scale efficiency (SE) of clubs reaches the level of 95%, which indicates that football teams are operating near their optimal scale of operations.
Graph 1 shows the evolution over time of the football teams’ performance, showing a cumulative drop of -1.6% in terms of pure technical efficiency (BCC model), which in the case of global efficiency (CCR model) reaches -3.3%, and the scale efficiency showing a similar trend with a cumulative drop of -1.7%. In summary, all variables show a downward trend, especially accentuated between 2013 to 2014 and 2014 to 2015 seasons, though recovery is noticed in the last season evaluated, 2015 to 2016.
As for the evolution of the number of efficient clubs, Graph 2 shows that the best season was 2012–2013, with a significant worsening in the following season 2013–2014. In the last seasons, a gradual improvement is observed, until, in season 2015–2016, a situation similar to that of the beginning of the evaluated period is reached.
For more detailed information about the assessed teams, Table A1 includes each club’s efficiency scores and the number of efficient clubs (in absolute numbers and as a percentage) for each efficiency model and season. Only Real Madrid CF and Real Club Celta de Vigo are efficient clubs in every season, while in terms of pure technical efficiency, Athletic Club de Bilbao, Club Atlético de Madrid and Fútbol Club Barcelona are also efficient and reach the highest efficiency in three of the four seasons analyzed. However, scale efficiency issues can be observed in the last two clubs mentioned, especially Fútbol Club Barcelona, in the last two seasons. In a second stage of the research design, the possible determinants of efficiency were analyzed, taking into account team size, age, and business results.
In terms of club size, measured by volume of assets (Variable TS, Table 5), in the CCR model, medium-sized teams (Table 5, Group 2) are more globally efficient than big teams (Table 5, Group 1) and small teams (Table 5, Group 3). Conversely, for pure technical efficiency, in the BCC model, bigger teams are more efficient. However, the differences were only statistically significant at the 1% level for pure technical efficiency (p-value: .006) for big teams (Table 5, Group 1) and small teams (Table 5, Group 3).
As for age (Variable TA, Table 6), the oldest teams (Table 6, Group 1) are performed better in terms of both pure technical efficiency (BCC model) and global technical efficiency (CCR model). Teams of middle age (Table 6, Group 2) also performed better than the youngest teams (Table 6, Group 3). For CCR model, differences were only statistically significant at the 5% level (p-value: .015). This was also the case in the BCC model (p-value: .017), where differences were found between teams of middle age (Table 6, Group 2) and the youngest teams (Table 6, Group 3), but only at the 10% level (p-value: .089).
Finally, cluster analysis using the accounting result (Variable AR, Table 7) as the grouping variable, shows that clubs with moderate positive results (Table 7, Group 2) are more efficient in terms of pure technical efficiency (BCC model) and global technical efficiency (CCR model) than clubs with higher profits (Table 7, Group 1) or with very limited profits (Table 7, Group 3), though the differences were not statistically significant.
To summarize, the results show that clubs with a higher volume of assets (TS) have better levels of pure technical efficiency than teams with fewer assets. The oldest teams are more efficient than the youngest teams in terms of pure and global technical efficiency. Teams of middle age are more efficient than the youngest teams, but only in terms of pure technical efficiency. There were no significant differences between clubs grouped by their accounting results.
Conclusions
This study analyses the efficiency of professional football clubs in Spain from the periods 2012 to 2013 to 2015 to 2016 (4 seasons), based on efficient frontiers drawn using the non-parametric DEA technique. This methodology makes it possible to use a benchmark system to evaluate the performance of clubs in relation to each other, and, consequently, it could help team managers to gain knowledge about their clubs’ behavior, which in turn may lead to improving their performance.
The DEA analysis is complemented by a cluster analysis, which groups the clubs in accordance with variables similar to those used by any business, such as their size, age and accounting results.
The main conclusions of the research for the proposed efficiency model, in which a combination of financial and sport outputs is considered, are that football clubs have relatively acceptable performance levels. Furthermore, according to the results of the cluster analysis, the oldest clubs with the highest volume of assets achieve higher pure technical efficiency. For global technical efficiency, the oldest clubs are those which are able to achieve the best results. Accounting results did not differ according to the efficiency levels of the clubs evaluated.
The main limitation of this study is the period evaluated (4 seasons), which is why the results must be interpreted cautiously. It is difficult to obtain the financial information for a homogeneous sample of clubs. We plan, in the future, to extend our research with similar studies with a wider time horizon for both Spanish professional football clubs and those of other European countries, so as to be able to compare these entities’ performance at an international level.
Footnotes
Appendix
DEA Scores.

| 2012–2013 | 2013–2014 | 2014–2015 | 2015–2016 | ||||||||||
|---|---|---|---|---|---|---|---|---|---|---|---|---|---|
| N | Club | CCR | BCC | SE | CCR | BCC | SE | CCR | BCC | SE | CCR | BCC | SE |
| 1 | Athletic club | 0.729 | 0.736 | 0.990 | 0.918 | 1.000 | 0.918 | 1.000 | 1.000 | 1.000 | 1.000 | 1.000 | 1.000 |
| 2 | Club Atlético de Madrid SAD | 0.890 | 1.000 | 0.890 | 0.985 | 1.000 | 0.985 | 0.847 | 0.999 | 0.848 | 0.961 | 1.000 | 0.961 |
| 3 | Fútbol Club Barcelona | 0.956 | 1.000 | 0.956 | 0.907 | 0.948 | 0.957 | 0.744 | 1.000 | 0.744 | 0.752 | 1.000 | 0.752 |
| 4 | Getafe Club de Fútbol SAD | 0.693 | 0.737 | 0.940 | 0.566 | 0.660 | 0.858 | 0.662 | 0.840 | 0.788 | 0.908 | 1.000 | 0.908 |
| 5 | Granada Club de Fútbol SAD | 1.000 | 1.000 | 1.000 | 0.851 | 0.981 | 0.867 | 0.687 | 0.790 | 0.870 | 0.750 | 0.808 | 0.928 |
| 6 | Levante Unión Deportiva SAD | 0.900 | 0.925 | 0.973 | 0.829 | 0.847 | 0.979 | 0.705 | 0.820 | 0.860 | 0.972 | 1.000 | 0.972 |
| 7 | Málaga Club de Fútbol, SAD | 1.000 | 1.000 | 1.000 | 0.871 | 0.872 | 0.999 | 0.682 | 0.683 | 0.999 | 0.779 | 0.786 | 0.991 |
| 8 | RCD Espanyol de Barcelona SAD | 0.995 | 1.000 | 0.995 | 0.939 | 0.945 | 0.994 | 0.910 | 0.912 | 0.998 | 1.000 | 1.000 | 1.000 |
| 9 | Real Club Celta de Vigo SAD | 1.000 | 1.000 | 1.000 | 1.000 | 1.000 | 1.000 | 1.000 | 1.000 | 1.000 | 1.000 | 1.000 | 1.000 |
| 10 | Real Madrid Club de Fútbol | 1.000 | 1.000 | 1.000 | 1.000 | 1.000 | 1.000 | 1.000 | 1.000 | 1.000 | 1.000 | 1.000 | 1.000 |
| 11 | Real Sociedad de Fútbol SAD | 1.000 | 1.000 | 1.000 | 0.971 | 0.981 | 0.990 | 0.620 | 0.621 | 0.998 | 0.795 | 0.800 | 0.994 |
| 12 | Sevilla Fútbol Club SAD | 0.704 | 0.721 | 0.976 | 0.954 | 0.975 | 0.978 | 0.865 | 1.000 | 0.865 | 0.698 | 0.699 | 0.999 |
| 13 | Valencia Club de Fútbol SAD | 1.000 | 1.000 | 1.000 | 0.866 | 0.867 | 0.999 | 0.656 | 1.000 | 0.656 | 0.819 | 0.821 | 0.998 |
| Efficient Clubs (absolute value) | 6 | 9 | 6 | 2 | 4 | 2 | 3 | 6 | 3 | 4 | 8 | 4 | |
| Efficient Clubs (percentage) | 46.2 | 69.2 | 46.2 | 15.4 | 30.8 | 15.4 | 23.1 | 46.2 | 23.1 | 30.8 | 61.5 | 30.8 | |
Note. CCR model = constant returns to scale model; BCC model = variable returns to scale model; SE = scale efficiency.
Source. Coelli’s computer package (1996) has been used for the resolution of DEA.
Declaration of Conflicting Interests
The author(s) declared no potential conflicts of interest with respect to the research, authorship, and/or publication of this article.
Funding
The author(s) received no financial support for the research, authorship, and/or publication of this article.