
Abstract
The study employs metafrontier and four-stage data envelopment analysis (DEA) to measure the overall and individual efficiency of life insurance companies in mainland China and Taiwan, after applying the slack-based measure (SBM)-DEA model to adjust the differences in the operating environment across production units. The empirical findings show the following: (a) The environmental factors significantly affected the efficiency of all life insurance companies. After the adjustments, the efficiency score of life insurance companies in mainland China and Taiwan drops for 14.01% and 26.64% in regional frontier, and 38.31% and 12.22% in metafrontier frontier. (b) Before 2008, the life insurance companies in Taiwan are more efficient than those in mainland China.
Keywords
Introduction
In recent years, the global insurance industry faced the fierce many challenges including the ending of QE3, the U.S. government funding and debt ceiling issues, the long-running low interest rates, and so on. According to the Swiss Re research report, due to part-year data indicates that there will be a substantial contraction in life premiums in mainland China, global life insurance premiums will grow by 1.6% in real terms (see Figure 1), slightly slower than the average annual growth rate of the last 5 years. The global premiums forecast to increase annual insurance premium growth of around 3% in real terms over the next 2 years. Most demand will come from Asia, where premiums are forecast to increase at more than 3 times the global average rate. In both non-life and life, the emerging markets remain the main driver, particularly in mainland China. And, they forecast emerging market premium growth will accelerate to around 9% annually over 2019/2020. There will be a rebound in mainland China, where the economic backdrop remains strong and as the one-off shock effect of the tighter regulation of wealth-management-product types fades in 2018. Advanced market life premiums are expected to remain stable at current levels.

Global life insurance premium growth in real terms, actual and forecasts (2018 values showing in brackets).
In 2016, mainland China’s insurance share of the world market is the third in the world and the second in Asia. Nonetheless, both the insurance density and the insurance penetration of mainland China are still in lower level (see Table 1). Swiss Re Institute forecasts that China’s insurance premiums will reach US$2.36 trillion in 2032 and China will become world’s biggest insurance market by mid-2030s.
Insurance Market Index of Mainland China and Taiwan in 2016.

Taiwan is one of the most important global insurance markets. Taiwan insurance industry has seen explosive development in recent years following liberalizations that have permitted banks and foreign firms to participate. Taiwan insurance share of the world market is the tenth in the world and the fourth in Asia in 2016. Compared with mainland China market, Taiwan market has a high level of insurance density and the insurance penetration, the world ranking is top 1. Although the insurance market of Taiwan is highly competitive and insurance premium growth faced its first recession since 2000, strong growth was seen in 2017 in Taiwan and Taiwan’s growth was supported by insurance continuing to attract a high share of domestic savings. Table 1 shows the insurance market indices of mainland China and Taiwan in 2012.
In 2010, Taiwan and mainland China signed The Economic Cooperation Framework Agreement (ECFA), which is a preferential trade agreement that aims to reduce tariffs and commercial barriers between the two economies. The importance of this agreement is that mainland China will open markets in 11 service sectors including insurance. After signing the ECFA, the insurance market of two economies are getting closer. Compared with other foreign insurance companies, most of the Taiwanese insurance companies believe that they can more easily move into mainland China market because of having the similar culture and language.
This study aims to analyze the insurance corporations’ efficiency of two economies during 2005–2011. We combine the concept of Battese et al. (2004) with the concept of Fried et al. (1999) to assess the overall and individual efficiency of insurance companies in mainland China and Taiwan after adjusting for differences in the operating environment across production units. In addition, we also investigate whether there exists a gap on both sides of the insurance industry’s operating performance and try to understanding whether the Taiwanese insurance companies have the advantage to survive in mainland China market.
Literature Review
Four-Stage DEA
The aim of four-stage approach, developed by Fried et al. (1999), is to adjust the environment effect on efficiency and the result is seen as pure managerial efficiency. Fried et al. (1999) took the effect of the external operating environments into consideration, to propose a linear programming, nonparametric, frontier procedure to measure a pure managerial efficiency. Their findings point out the importance of controlling the external operating environment that does make a significant difference in efficiency rankings if adjust it.
Both Cook et al. (2010) and Kao (2014a) indicated that decision-making units (DMUs) are generally treated as a black box when measuring efficiency in the sense that internal structures are ignored in conventional DEA analysis, especially in the intermediate products or linking activities (Tone & Tsutsui, 2014). Network DEA uses the DEA technique to measure the system’s relative efficiency more properly by considering its internal structure and the operations of the component processes of the system. Therefore, the network DEA approach is more meaningful and informative than the conventional DEA approach (Kao, 2014b). The slack-based measure (SBM) approach is one of the network DEA models and can provide appropriate efficiency measures, especially for weakly efficient production units (Kao, 2014a).
To overcome the existing problem of the power of standard regression analysis based on DEA processed data, Hahn (2007) employed a multiple-stage approach based on an SBM-DEA with a censored regression model and applied a bootstrap estimator to deal with these existing problems. Avkiran (2009) pointed out that four-stage DEA methodology is an improvement over existing approaches because it consists of a units-invariant efficient frontier analysis followed by Tobit regression, adjustment of data, and a repeat of the efficient frontier analysis and can be leveled by adjusting data based on input and output slacks. Reviewing approaches to performance measurement, R. K. Park and De (2004) provide an examination of the applicability of alternative (four-stage) DEA to efficiency measurement and find that alternative DEA is a powerful approach to the evaluation of the overall efficiency of seaports.
To enhance previous proposed models introducing noncontrollable inputs in DEA overcoming some of main shortcomings, Cordero-Ferrera et al. (2010) adopt a multistage approach with Tobit regressions to estimate efficiency when a set of DMUs uses nondiscretionary inputs and to test the influence of these variables, and employ a bootstrap procedure to estimate these regressions to avoid potential bias. Sav (2013) employed a four-stage DEA model to evaluate university graduation rate performance and found the four-stage DEA efficiencies correct for both environmental and statistical noise effects on university operations.
P. C. Chen et al. (2014) combined the four-stage approach with Simar and Wilson’s (2007) double bootstrapping to strain the impacts of external variables in the efficiency measurement to evaluate technical efficiency of Taiwan’s incineration plants. Medina-Borja and Triantis (2014) defined and assessed multiple performance dimensions. The performance of each of the four dimensions stands for a separate stage, provides a DEA formulation at each stage, and considers the influence of key environmental factors.
The study of Shieh et al. (2017) is the first study to integrate four-stage approach and dynamic DEA to assess the efficiencies of 45 Taiwanese international tourist hotels during 2002–2011.
SBM-DEA
The SBM model was introduced by Tone (2001). Tone (2011) pointed out that the SBM models are designed to meet two conditions: Units invariant and Monotone. Indeed, SBM is a nonlinear programming problem that minimizes a ratio of potential reduction of inputs to potential increase of outputs (Khezrimotlagh et al., 2012). However, the results of past studies may not appear to be effective because they neglect the environmental impacts of outputs. To avoid these defects, in some studies outputs have been incorporated into an efficiency analysis. Nevertheless, there are some limitations in these models based on radial efficiency measures. The radial model adjusts all undesirable outputs and inputs to efficient targets with the same proportion, so it cannot provide information concerning the efficiency of the specific inputs or outputs (Zhou et al., 2012). Moreover, Fukuyama and Weber (2009) pointed out that radial efficiency measures neglect slack variables to lead to biased estimations and to weaken discriminating power for ranking and comparing DMUs (Zhou et al., 2007). Recent studies have tried to employ nonradial DEA approaches to avoid these biases and limitations (Zhou et al., 2012). Having the advantage of capturing the whole aspect of inefficiency, SBM, a nonradial efficiency approach, can explain input and output slack in efficiency measurements directly and is particularly suitable for the reduction of undesirable outputs (Zhang & Choi, 2013).
In real-world business, we can find a lot of remaining nonradial slacks in many radial approaches, but these slacks play a vital role in evaluating managerial efficiency. Nonradial SBM model is a collective model that does not have input (output) change through self-increase (decrease) scale and does not compute the efficiency rate in the evaluation with this model, and only identifies deficiency or efficiency of DMUs. Compared with radial models, Rostamy-Malkhalifeh et al. (2013) indicate the advantages of nonradial SBM models that work based on slacks does not need separation in nonradial models and ever inputs (outputs) decrease (increase) to self-shortage (surplus). Furthermore, nonradial SBM model has identified efficiency or deficiency of a DMU through solving one problem certainly, whereas two problems are needed in radial models (Rostamy-Malkhalifeh et al., 2013). The nonradial SBM can deal with slacks directly, discard the varying proportions of original inputs and outputs, and avoid misleading the decision.
Morita et al. (2005) used an SBM context-dependent DEA model to obtain different frontier levels and more appropriate performance benchmarks for inefficient DMUs. Hong (2010) uses the modified four-stage DEA combining SBM and common four-stage DEA to assess the SBM efficiency of non-life insurance industry during 2000–2006 in 14 Organisation for Economic Co-operation and Development (OECD) countries and China. The results show that environment variables including gross domestic product (GDP) per head, social security level, financial deepening, and scale have significant effect on overall efficiency of individual countries.
Yu (2010) used an SBM-network DEA model of performance measurement to assess domestic airports’ operation efficiency in Taiwan and to estimate the input excess and output shortfalls. Tone and Tsutsui (2014) proposed a dynamic DEA model with network structure within the framework of SBM to evaluate the overall efficiency over the entire period and to evaluate dynamic change of period and divisional efficiencies. Bi et al. (2014) used an SBM approach to examine the relationship between fossil fuel consumption and the environmental regulation of thermal power generation in China.
Efficiency in Insurance Industry
Yao et al. (2005) applied DEA to evaluate mainland China insurance industry efficiency over the period 1999–2002 by a panel data. The empirical results show that the firm size, ownership structure, mode of business, and human capital are important factors affecting firm performance. In addition, policy design and implementation is important to the future development of the insurance industry.
Hao and Chou (2005) used the distribution free approach (DFA) to estimate the efficiency of 26 life insurance companies in Taiwan from 1977 to 1999. Their results show that the efficiency relates to the product diversification strategy, scale, and occurrence of market share.
Yang (2006) used a two-stage DEA to evaluate the Canadian life and health insurance industries in 1998. The two-stage DEA model integrates the production performance and investment performance of the insurance companies and provides management overall performance evaluation. The results show that Canada’s life and health insurance industry is fairly efficient during the study period.
Hwang and Kao (2006) used the two-stage DEA and Tobit regression model to measure managerial performance in 24 Taiwanese non-life insurance companies and explore factors that significantly influence managerial efficiency. The first stage is measured the marketability and profitability in the second stage. The findings show that profitability can be explained by percentage of premium reserved, market share, and corporate image; and marketability can be explained by premium investment percentage, percentage of outer servers, number of branches, and corporate image.
Kao and Hwang (2008) modified the traditional DEA model by considering the series relationship of the two subprocesses within the whole process to explore the causes of inefficiency of Taiwanese non-life insurance companies. Their study indicated that some unusual results, appeared in the independent model, do not exist in the relational model.
Because traditional DEA neglecting the operation of individual processes within a system, Kao (2009) considered the interrelationship of the processes within the system and built a relational network DEA model to measure the efficiency of the system and those of the processes simultaneously. Then, he used this new model idea to analyze efficiency of Taiwanese non-life insurance industry.
X. Hu et al. (2009) illustrated the efficiencies of mainland China’s domestic and foreign life insurance and examined the relationship between the efficiencies of insurers and ownership structure. The findings show that the average efficiency of the value of all insurance companies are cyclical, and Tobit regression pointed out that the insurance company’s market power, access, and ownership structure may be the cause of differences in efficiency values.
Fang and Hu (2009) used the conventional DEA model and zero-sum gain DEA (ZSG-DEA) method to estimate the broker and dealer (B&D) efficiency of securities firms in Taiwan under the framework of metafrontier. Their result showed that the traditional DEA method underestimated the efficiency of Taiwanese securities firms, especially in the inefficient firms. Compared with the ZSG-DEA, the establishment of the financial holding companies in Taiwan is not able to improve B&D efficiency in the securities industry.
Eling and Luhnen (2010) used DEA and stochastic frontier approach (SFA) to measure the efficiency of international insurance industry. They indicated that both cost and technical efficiency keep a stable growth in international insurance markets from 2002 to 2006. The highest average efficiency is Denmark and Japan, whereas the most inefficient is Philippines. In general, the insurance companies in emerging markets have high potential to significant improvements because emerging market countries have lower efficiency scores than Asian and European countries.
Cummins et al. (2010) used DEA to investigate economies of scope in the U.S. insurance industry during the years 1993–2006. Their results show that property-liability insurers achieve cost scope economies, but they are more than offset by revenue scope diseconomies. Furthermore, life-health insurers recognize both cost and revenue scope diseconomies.
Huang et al. (2010) adopted the metafrontier cost function model to investigate the performance of 16 European countries’ commercial banks over the period of 1994–2003. This model can decompose the meta-cost efficiency into the technical efficiency (TE) and the technology gap ratios (TGRs). Their results show that the average technical efficiency of the financial sectors in Europe’s markets improves and the technology gap shrinks.
Zhi and Zhengcheng (2015) evaluate business performance of 28 personal insurance companies and 21 non-life insurance companies from 2009 to 2013 and employ Tobit model analysis to explore the effect of the business performance on the scale of health insurance and various companies and the entire insurance industry. Long and Li (2017) employ a two-stage DEA model to evaluate the operating performance of insurance companies, and their results indicate that the proposed method is able to analyze with high accuracy. Wise (2017) explores the methods most commonly used in over 190 studies evaluating life insurance efficiency, and the findings point out that DEA is the technique used most commonly, with SFA next. Bian and Wang (2019) study the cost and profit efficiencies of life insurers in China from 2009 to 2013, a period when China fully opened its insurance market to foreign insurers, and compare efficiency disparities between domestic and foreign life insurers.
Method and Data
Battese et al. (2004) first proposed the concept of metafrontier for the purpose of studying differences in productivity across different regions and groupings. Figure 2 illustrates the concept of the metafrontier. This study will be following the design by Battese et al. (2004) using the DEA methods to measure the efficiency of different group’s DMU under the regional frontier and metafrontier. Then, we calculate TGR and compared with the entire regions to find out the gap in two economies. Nevertheless, some environmental variables that cannot be controlled and may affect the efficiency of insurance company, so we follow the concept of Fried et al. (1999) to employ the Tobit regression analysis to quantify the effect of external conditions on the excessive use of inputs. In addition, this study uses the estimated coefficients from the regression to adjust the influence of external condition and create a new pseudo data to estimate the differences across production units in the operating environment. Finally, we re-run DEA model and generate new frontier to measure the inefficiency. These new scores measure the inefficiency that is attributable to management.

Metafrontier function model.
The Metafrontier Stage
In the first step, metafrontier is the envelope of a subgroup’s frontier and considers multiple outputs. Therefore, the assumption of variable returns to scale (VRS) is reasonable. The SBM is a nonradial model and utilizes input and output slacks directly in producing an efficiency measure and estimated efficiency values between 0 and 1. This study uses the nonoriented VRS-SBM model to construct the regional frontier in Step 1. The SBM-DEA, which is introduced by Tone (2001), has the following important properties: Units invariant and Monotone. This study uses the nonoriented SBM model, which is presented as


where
Furthermore, Equation 1 can be transformed into

In Equation 2, the first term of right-hand side represents the mean reduction rate of input or input inefficiency. Similarly, the second term represents the mean expansion rate of outputs or output inefficiency. Thus, SBM ρ can be interpreted as the product of input and output inefficiencies.
In conventional DEA, we usually neglect the negative outputs and transfer that to a positive data. The SBM model in Equation 1 did not consider negative output data for efficiency evaluation. Considering the negative output data, we change the scheme as follows proposed by Tone (2001). Supposing yro ≤ 0, we define

If the output has no negative data, we define
If

If

where
In any case, the denominator is positive and strictly less than
In the second step, considering all the regional DMUs, we construct the metafrontier. According to Battese et al.’s (2004) metafrontier model, the value of the metafrontier function is no less than the deterministic component of the stochastic frontier production from different groups.
The third step is the process of measuring the technology gap of each DMU:

Equation 6 represents that the TE* relative to metafrontier equals the product of TE relative to frontier for the subgroups and TGR. In the study, TE is efficiency under the nonoriented VRS-SBM model.
The Tobit Regression Stage
In the first step, except for the inputs which we have considered, some environmental variables may be out of the manager’s control. These environment variables play an important role in the study to explore whether they would do have influence on the operating among the DMUs. Tobit regression, proposed by Tobin (1958), is a popular tool which is based on the principle of maximum likelihood estimation to get the consistent parameters estimation, to examine what external operational environment will affect the efficiency scores or total input–output slack. According to Fried et al. (1999), we used the Tobit regression to estimate the relationship between input slack and external environment variables. The objective is to quantify the effect of external environment variables on the excessive use of inputs. The equations are specified as

where
In the second step, this study uses the coefficients estimated from the regression to predict total input slack for each unit based on its external variables:

According to the difference between maximum predicted slack and predicted slack, these predictions are used to adjust the primary input data for each unit:

These inputs are adjusted for the influence of external conditions, and this creates a new pseudo data set. Although we use the nonoriented SBM model that can measure the output and input slack at the same time, we just adjust the input slack in this step. The reason is that it can be easy for companies to decide how much resource to put in to running the business, but hard to predict how much revenue they can earn in future.
Applying the SBM-DEA model under the initial input–output specification, the final step is to re-run Battese et al.’s (2004) framework using the adjusted data set, and this generates a new frontier to measure the efficiency.
Input and Output Variables
Based on previous studies, we select three inputs and two outputs, use unbalanced panel data from 2005 to 2011, and generate new frontier to evaluate the efficiency of insurance company in mainland China and Taiwan. All the operating variables are collected from the China Insurance Regulatory Commission and Taiwan Insurance Institute, and all variables in monetary units are first transformed into U.S. dollars by annual exchange rates. All nominal variables in U.S. dollars are then transformed into real variables using the U.S. GDP deflators with 2005 as the base year. Therefore, all variables in monetary units are in real U.S. dollars with 2005 as the base year. The number of insurance companies varies every year, because of merger and acquisition. Table 2 shows the number of observations from 2005 to 2011 in mainland China and Taiwan, and Table 3 describes the definitions of these variables.
Number of Observations During 2005 to 2011.

Definitions of Variables.

Some authors believed that increasing total assets can lead a firm’s operation to be more efficient (e.g., Berger et al., 1993; Gardner & Grace, 1993; Hao & Chou, 2005; Yuengert, 1993). Therefore, total asset, including insurance premium, property, and others, is an important index to measure insurance companies’ scale.
For an insurance company, total equity can be seen as a reserve fund to pay the premium loss and the capability of facing risk. Therefore, we choose the “total equity” as an input variable. The insurance industry is a labor-intensive industry because the product is an intangible commodity and it needed a lot of salesmen and office staffs to run the business (Berger et al., 1993; Cummins et al., 2010).
Based on the previous literature, we choose the premium insurance for the output variable, because premium insurance is the main revenue to the insurance company (Cummins et al., 2010; Noulas, 2001). According to the Noulas (2001), and Hwang and Kao (2006), investment revenue is the second source revenue on the insurance company. Therefore, we choose the investment revenue for the output variable. Table 4 provides the descriptive statistics for all variables in this study.
Summary Statistics of Input and Output Variables.

The result shows that all the correlation coefficients between inputs and outputs are positive (Table 5), satisfying the isotonicity in the study, and means the variables included in this model are appropriate.
Correlation Matrix for Inputs and Outputs, 2005–2011.

Rejection of the zero null at the 1% significance level.
Environmental Variables
This study uses 10 environment variables: country GDP growth rate (GDP), inflation rate (IR), financial leverage (FL), savings rate (SV), elderly population (EP), insurance penetration rate (IPR), business freedom index (BF), corruption index (CI), climate risk index (CR), and rediscount rate (DR). Table 6 describes the definitions of these variables.
Definitions of Environment Variables.

Note. GDP = gross domestic product; IR = inflation rate; FL = financial leverage; SV = savings rate; EP = elderly population; IPR = insurance penetration rate; BF = business freedom; CI = corruption index; CR = climate risk index; DR = rediscount rate.
Swiss Re World Insurance Report from 2005 to 2011. b IMF. c The Ministry of Internal Affairs of Taiwan and National Bureau of Statistics of mainland China. d The Heritage Foundation. e Germanwatch Global Climate Risk Index Report from 2005 to 2011.
Country GDP is the market value of all officially recognized final goods and services produced within a country in a year. According to Lee et al. (2013), they reveal that a 1% increase in the real-life premium raises real GDP by 0.06%. Therefore, we expected that GDP growth rate has a significant relationship with business efficiency.
Haiss and Sümegi (2008) state that a significant impact between the interest rate and the level of economic development on the insurance-growth. Browne and Kim (1993) find that the inflation rate has a negative correlation with the life insurance consumption. Beck and Webb (2003) stated that the higher saving rate and higher interest rate associate with higher life insurance consumption. Therefore, we choose the inflation rate, savings rates, and rediscount rate as environmental variables to investigate their relationships with efficiency.
Financial leverage (total debt/shareholders equity) described a business or investor is using the borrowed money. Recent analysis shows that the use of funds will affect the operating efficiency of insurance company (Hwang & Kao, 2006).
Because a large share of older population has higher life insurance premium (Beck & Webb, 2003), we believe that the increase in the elder population will have a significant influence on the life insurance industry.
Business freedom is announced by the heritage foundation. It can measure the efficiency of country regulations. A lower score implies that the economy has a burdensome and redundant regulations, and vice versa. Thus, we believe that the regulation has a significant relationship with the business operating.
Insurance penetration rate is the ratio of the percentage of total insurance premiums (in U.S. dollars) to GDP. It indicates the level of development of insurance sector in a country. According to Butler et al. (1998), the higher insurance penetration rate will bring the problem of moral hazard and could lead to more resource dissipation. Therefore, we choose the penetration rate to an environment variable.
Corruption index denoted the freedom from corruption, which is gauged by the Heritage Foundation. It measures the level of corruption as it affects a country’s economic freedom. Thus, we expect that the corruption will bring a negative effect to efficiency.
Climate risk index is the score of the impacts of weather-related loss events, which is gauged by the Germanwatch. The climate crisis may lead people to feel life-threatening and willing to buy insurance. Thus, it is expected that climate risk index has a positive relationship with business operation.
Empirical Results
Generally, when using the traditional DEA model, we will let the negative output data transfer to positive data, called translation data. However, we use the SBM model that can calculate the negative output data. Table 7 shows the differences of using negative output data and translation data.
Different in Negative Output Data.
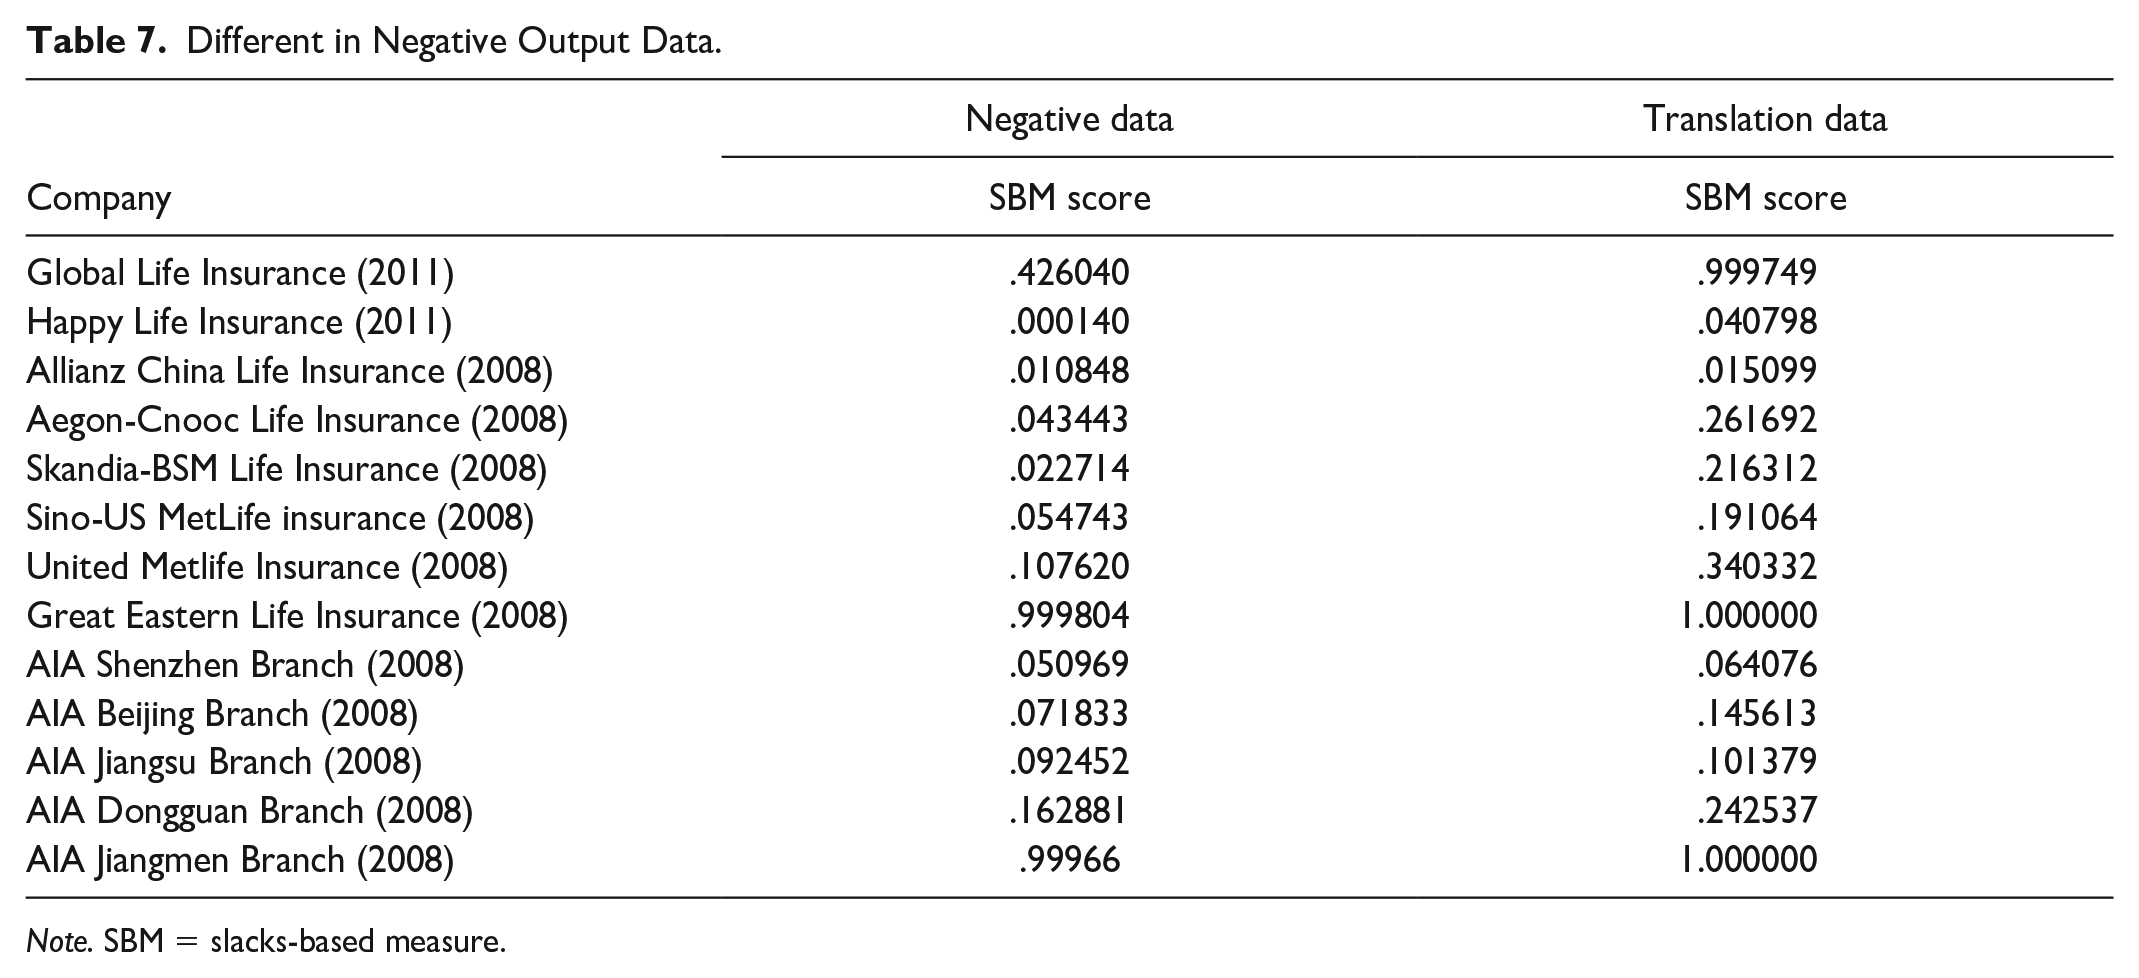
Note. SBM = slacks-based measure.
The table shows the differences between the efficiency score by the negative output data and the translation data. As we can see, the translation score of DMUs is higher than that of negative output data, one of the reasons may be that using the translation data would cause the overestimation. Thus, we can say that the negative output data can better explain the reality, so we cannot neglect the negative outputs.
The Metafrontier Stage Results
In Step 1, we use the SBM to calculate the regional efficiency of Taiwan and mainland China from 2005 to 2011. In the Taiwan regional frontier, Cathay Life Insurance and Fubon Life Assurance are the most efficient companies. Furthermore, China Pacific Life Insurance, China life Insurance, Ping An Life Insurance, and New China Life Insurance are the most efficient companies in mainland China regional frontier. All of them get the full SBM score (0–1) in the 7-year span. Table 8 shows the regional frontier score in metafrontier stage.
Regional Frontier Score in Metafrontier Stage.
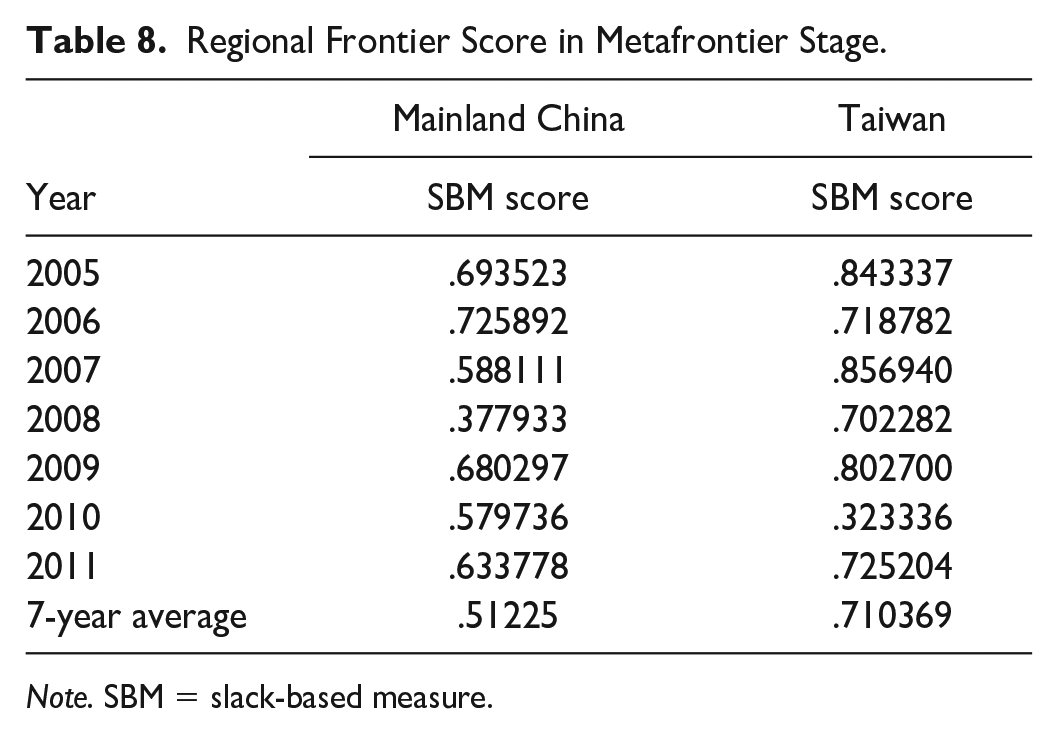
Note. SBM = slack-based measure.
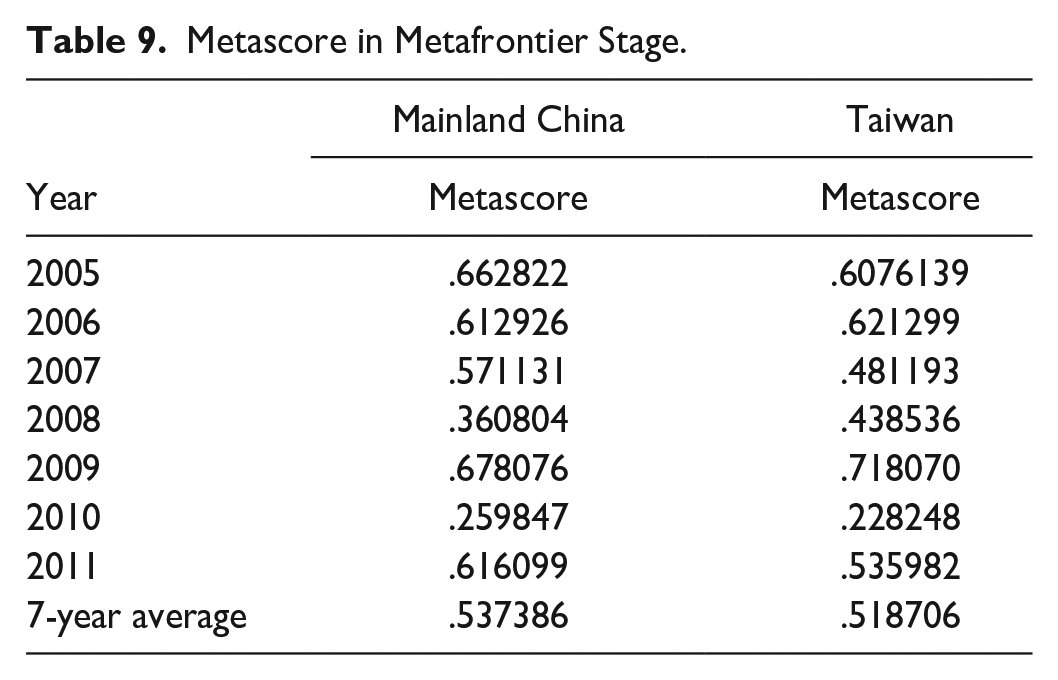
In Step 2, we consider all DMUs in these two economies to construct the metafrontier. Table 9 shows the metafrontier score from 2005 to 2011. We find that the average score of mainland China (.537386) and Taiwan (.518706) and their trends are very close. Both faced a lower score in the 2008 economic crisis and the euro bond crisis in 2010.
Metascore in Metafrontier Stage.
In Step 3, we examine who are closely the metafrontier and the gap that exists in the insurance industry’s operating performance on both sides. This study calculates the TGR score in this step. Although the metafrontier scores of both economies are very close, the TGR score of mainland China is significantly higher than that of Taiwan. A higher TGR score implies being closer to the efficiency frontier. Table 10 shows the TGR score from 2005 to 2011.
TGR Score in Metafrontier Stage.

Note. TGR = technology gap ratios.
The Tobit Regression Stage Results
In Step 1, we quantify the effect of the operating environment using the Tobit regression. There are three regression equations, one for each input, and the dependent variables are the total input slacks. The parameter estimates and standard errors are summarized in Table 11.
Tobit Regression Results.

Note. Standard errors of the parameter estimates are in parenthesis. SV = savings rate; CI = corruption index; CR = climate risk index; BF = business freedom; GDP = gross domestic product; IR = inflation rate; FL = financial leverage; IPR = insurance penetration rate; EP = elderly population; DR = rediscount rate.
Rejection of the zero null at the 10% significance level.
Rejection of the zero null at the 5% significance level.
Rejection of the zero null at the 1% significance level.
Saving rate has a significant positive coefficient to the employee slacks. The higher saving rate will cause excess use of the input. This may be the result of the congestion effect. Company recruits more employees to expand their business, but always exceeds their input.
Corruption index has a significant negative coefficient to the total equity slacks and a positive to the employee and total assets slacks. The lower corruption score means high level of corruption. The results show that the one of the reasons the company increased their capital may be caused by the uncertainty problem (corruption). Others, the negative coefficient to the employee and total assets slack, may be the reason for the crowding out effect. When company faced an uncertain problem, the operating cost will be higher. Instead, the other input resource will be less.
Business freedom has a notable positive coefficient to the employee slack. This may indicate the effect of congestion, excessive investment of the company in the number of employees to expand their business.
GDP has a significant negative coefficient to the total equity slack and positive coefficient to the total asset slack. The higher GDP means the overall economic performance is good; therefore, insurance company is effectively using their capital to investment and has decreased the slack of the total equity. However, the prosperity of economy will let the firm input more resource to expand their business and always bring the congestion effect to increase the total assets slack.
Inflation rate has a positive significant coefficient to the total equity and total employee slack. According to the economic theory, the economic boom will also bring the higher inflation rate. Therefore, the reason for positive coefficient to employee and total asset slack may be the excessive investment of the firm on their resource to expand business.
Financial leverage has a positive significant coefficient to the total assets slacks. This said, the company may overinvest as they have a lot of borrow capital.
Insurance penetration rate has a positive coefficient to the total equity slack and negative coefficient to the total employee slack. It is interesting when higher insurance penetration rate causes the total equity slack to increase. The reason may be that the insurance company may prepare more equity to control the risk due to the higher insurance premium. However, because the people are willing to buy more insurance, higher insurance penetration rate will decrease the employee slack.
Discount rate has a positive significant coefficient to the total equity slack and negative coefficient to the total employee slack. The higher discount rate means the insurance company will pay more interest fee to the consumers, so insurance company will increase their equity to control the risk and causes the equity slack to increase. In contrast, the higher interest will encourage people to buy the investment insurance product and it will decrease the employee slack.
In Step 2, the parameter estimates (shown in Table 11) are used to adjust the initial data set according to Equation 9.
The Final Stage Results
The first step results
We use the new adjusted data to re-run the DEA model under the concept of metafrontier. Table 12 shows the result of regional frontier score in adjusted data and original data. We find that the average score of mainland China is .440485 and Taiwan is .52114. After the adjustments, the average efficiency score drops 14% in mainland China and 26% in Taiwan.
Regional Scores in Final Stage.

Note. SBM = slack-based measure.
The second step results
Under the metafrontier, we discovered that the new adjusted metascore of two groups have a big variation when compared with the original score. After the adjustment, the average efficiency score drops 38% in mainland China and 12% in Taiwan. The result shows that Taiwan score is significantly higher than mainland China score. In the adjusted data, the metascores of mainland China and Taiwan are .315986 and .455329, respectively. Table 13 shows the metascore in adjusted data and original data.
Metascores in Final Stage.

Note. SBM = slack-based measure.
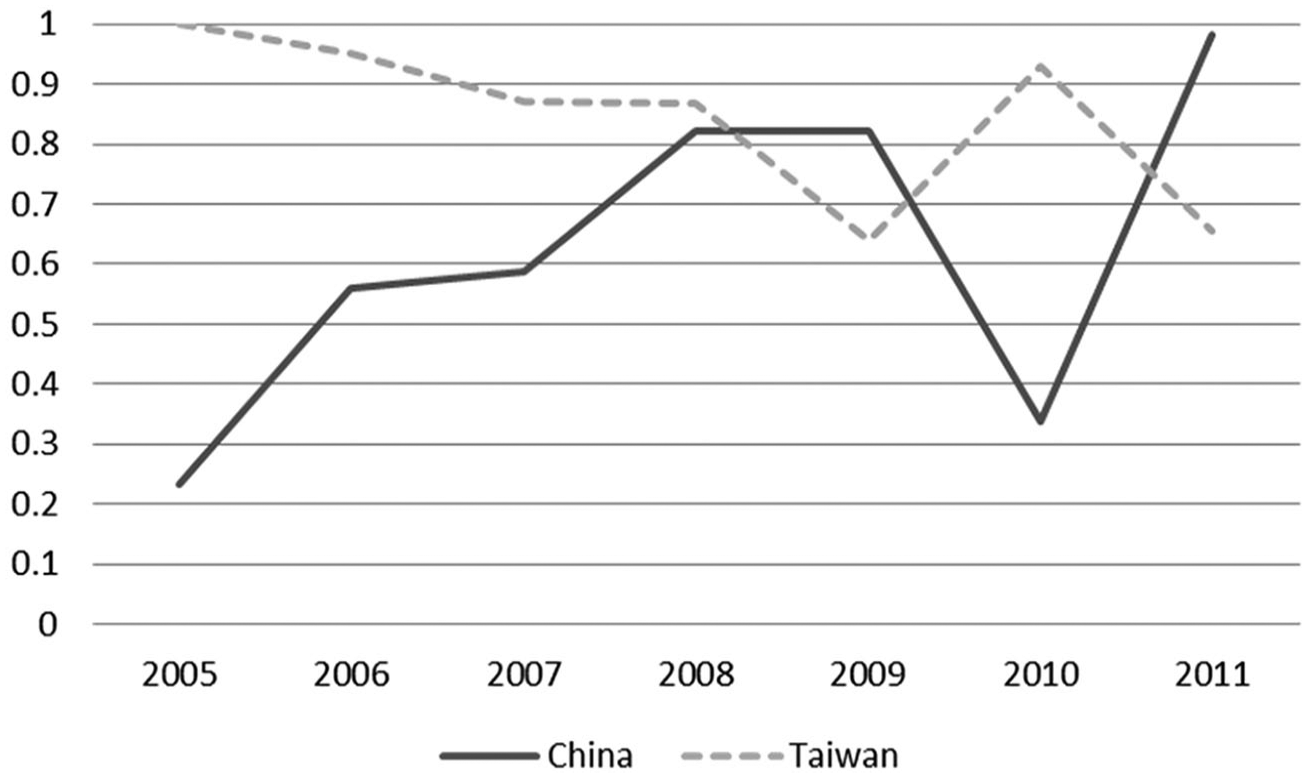
In addition, if we observe the trend of score, we will find an interesting result. In the original data, the score of direction of two economies is similar and the gap between them is very small. In contrast, the new adjusted data have a totally different result. At the beginning, Taiwan score is higher than mainland China, but later, the score of Taiwan dramatically decreases and there appears a reversal in mid-2008. After that, Taiwan leads mainland China again in the years of euro bond crisis (2010). However, mainland China recovered strongly in 2011 and widened gaps with Taiwan. Figures 3 and 4 show the trend of metascore in Taiwan and mainland China during 2005–2011.

Trend of average metascore in original data.

Trend of average metascore in adjusted data.
Furthermore, we examine the top 10 inefficient life insurance companies. In original data, we discovered that among the top inefficient life insurance companies, mainland China has seven companies and Taiwan has three companies. Yet, after the adjustment, the result becomes six in mainland China and four in Taiwan. Moreover, most of the Taiwan inefficient life insurance companies are foreign companies in both original and adjusted data result. It means that it is difficult to survive for the foreign company in Taiwan insurance market. In 2012, the market share of new business and total premium of foreign company in Taiwan is only 0.7% and 3%, respectively.
In addition, we examine the efficiency scores of the insurance companies invested by Taiwan capital (share over or equal 50%) in mainland China. In our data, we have three Taiwan capital firms in mainland China during 2005–2011, because those insurance companies in mainland China are subsidiaries and still young. We further examine the efficiency score of those parent companies in Taiwan under metafrontier. Whether in the original or adjusted score, we find that the efficiency scores of those parent companies are significantly higher than subsidiaries.
The third step results
In this step, we calculate the TGR score using the adjuster data, and we discovered an opposite result to the original data. The average TGR score of Taiwan is higher than that of mainland China. Mainland China’s average TGR score dramatically decreased from .833384 to .620362. In contrast, the Taiwan TGR score has a sharply increase from .715573 to .844812. Table 14 shows that the score of TGR in adjusted data and original data.
TGR Score in Final Stage.

Note. TGR = technology gap ratios.
This explained that the score of mainland China’s insurance company will become lower when it enters the co-market and the gap of operating performance exists in mainland China’s life insurance industry. However, if we observe the TGR score of Taiwan in recent 3 years, we will find that the score of Taiwan is lower than mainland China most of the time. To observe the trend of change, we draw a line chart. Figures 5 and 6 illustrate the trend of average TGR score of Taiwan and mainland China from 2005 to 2011 in original data and adjusted data.

Trend of average TGR score in original data.
Trend of average TGR score in adjusted data.
As a result, we find a difference between two data sets at the beginning year. In original data, mainland China’s score is higher than Taiwan, but it is opposite in the adjusted data. Thereafter, the direction of Taiwan score has a downward trend in both data. In the original data, the Taiwan TGR score begins to rise in 2007, narrowing the gap between with mainland China. By contrast, in adjusted data, the TGR score of Taiwan continues to decrease until 2009 and is lower than mainland China in 2008. Moreover, we find an interesting result both data, which is mainland China score dramatically decreased in 2010 and let the Taiwan TGR score higher than mainland China. Furthermore, mainland China has a strong recovery from 2010 and widened the gap with Taiwan in both data.
Conclusion
After employing Tone’s (2001) SBM-DEA model to adjust the differences in the operating environment across production units, the study follows the framework of Battese et al. (2004) and Fried et al. (1999) to measure the metafrontier and subgroup efficiency of insurance companies of two economies. In addition, we also investigate whether there exists a gap on both sides in the insurance industry’s operating performance and try to understanding whether the Taiwan insurance companies have the advantage to survive in mainland China market.
The empirical results illustrate that the environmental factors significantly affected the efficiency scores of life insurance companies of two economies. The regional scores of life insurance companies in mainland China and Taiwan drop for 14.01% and 26.64%, and metascores drop for 38.31% and 12.22% after the adjustments.
To measure the operating performance in Greater China insurance market, we put all of two economies’ DMUs together to construct the metafrontier. In the original data of metafrontier, the average score of Taiwan is .518706 and is lower than mainland China’s .537386, but the difference is very small. By contrast, there is a significant gap existing between two economies in the adjusted data; the average score of Taiwan is .455329 and it is significantly higher than mainland China’s .315986.
In addition, we calculate the TGR score to examine who are close to the metafrontier and to explore whether there exists a gap between these two economies in the insurance industry’s operating performance. TGR is calculated as the distance between the group frontier and the metafrontier obtained using the metafrontier approach, and represents the efficiency gap between the metafrontier and the specific group frontier (J. Park & Shin, 2018). TGR is also an indicator of the gap between common production technology and group technology (Lin & Zhao, 2016; O’Donnell et al., 2008). Because the constraints to problems in different groups are a subset of the constraints to problems of the metafrontier, the technical efficiency of each group technology should be higher than those of the metatechnology (Y. H. Chen et al., 2017). If the gap increases, the TGR decreases; that is, while the gap decreases gradually, the TGR approaches “1” (J. Park & Shin, 2018). The closer to the efficiency frontier it is, the higher the TGR score will be. The TGR values can help identify relative efficiency among DMUs and also understand the changes in efficiency during this period.
Like the metascore result, mainland China’s TGR score is higher than that of Taiwan in the original data; however, the opposite in adjusted data. It may be the adjustment effects of the environment variables, so there is difference between the efficiency values of life insurance companies in Taiwan and China. The technical efficiency values of both economies have apparently changed, and there is also a significant difference between the life insurance companies in Taiwan and China. However, the difference between efficiency values is not large.
In general, the whole operation performance of life insurance industry in Taiwan is apparently higher than that in China. However, after considering the adjustment effects of the environment variables, most life insurance companies’ efficiency value shows a significant change, regardless of being in mainland China and in Taiwan. It means that the technical efficiency of the life insurance companies in China underestimated before considering the environment variables; that is, Taiwanese life insurance companies are overestimated. After entering World Trade Organization (WTO), for attracting foreign life insurance companies’ investment and setup, China has fully opened domestic insurance market and the insurance-related laws have been amended remarkably. Thereby, the production technology of the whole life insurance industry in China has developed faster than that in Taiwan.
In summary, we find that mainland China’s score has sharply decreased both in the metascore and TGR score after the adjustment. The definition of efficiency after adjustment means the efficiency that is attributable to management. Therefore, the results imply that the management efficiency of Taiwan is better than that of mainland China and the environment condition is harder than mainland China.
However, after 2008, the advantage of Taiwan in adjusted data is diminishing (except 2010). The adjusted score of Taiwan sharply decreased in the most recent year and widened the gap with mainland China. This is an interesting result that indicated the management efficiency of mainland China insurance company is higher than Taiwan after 2008.
Furthermore, we discovered that mainland China’s TGR score dramatically decreased in both data in 2010. The reason may be that the China government announced a new regulation: Administrative Reconsideration Law of the People’s Republic of China and the Insurance Law of the People’s Republic of China. China government reinforces the regulatory power of China Insurance Regulatory Commission to enforce the market monitoring to prevent and correct illegal or improper specific administrative action. The regulation formal implementation happened on 1 March, and it caused a great effect. Figure 4 shows mainland China’s life premium monthly revenue in 2010.
In Figure 7, we discovered that the premium revenue maintains at a high level before March. Then, the premium revenue dramatically decreases in March, and this is the starting time of the new regulation. According to the China Insurance Regulatory Commission statistics in 2010 January to September, a total of 681 times insurance agencies were punished, which included 39 new business ordered to stop, revocation of 47 business licenses, and 71 people were ordered to replace executives, including chairman and the general manager. Therefore, this is the main reason why the TGR score of mainland China is lesser than Taiwan. Besides, Taiwan also has a strong growth (14.7%) in 2010, which is a biggest growth since the 2008 economic crisis. This is another possible reason that led Taiwan TGR score exceed mainland China. In other words, the results point out that Taiwan government should adopt a more open policy in life insurance market to increase life insurance company efficiency, especially on the technical efficiency. However, compared with Taiwan market, in mainland China, the development time of life insurance industry is not long and the relative market scale is larger, leaving much to be desired in the management efficiency.
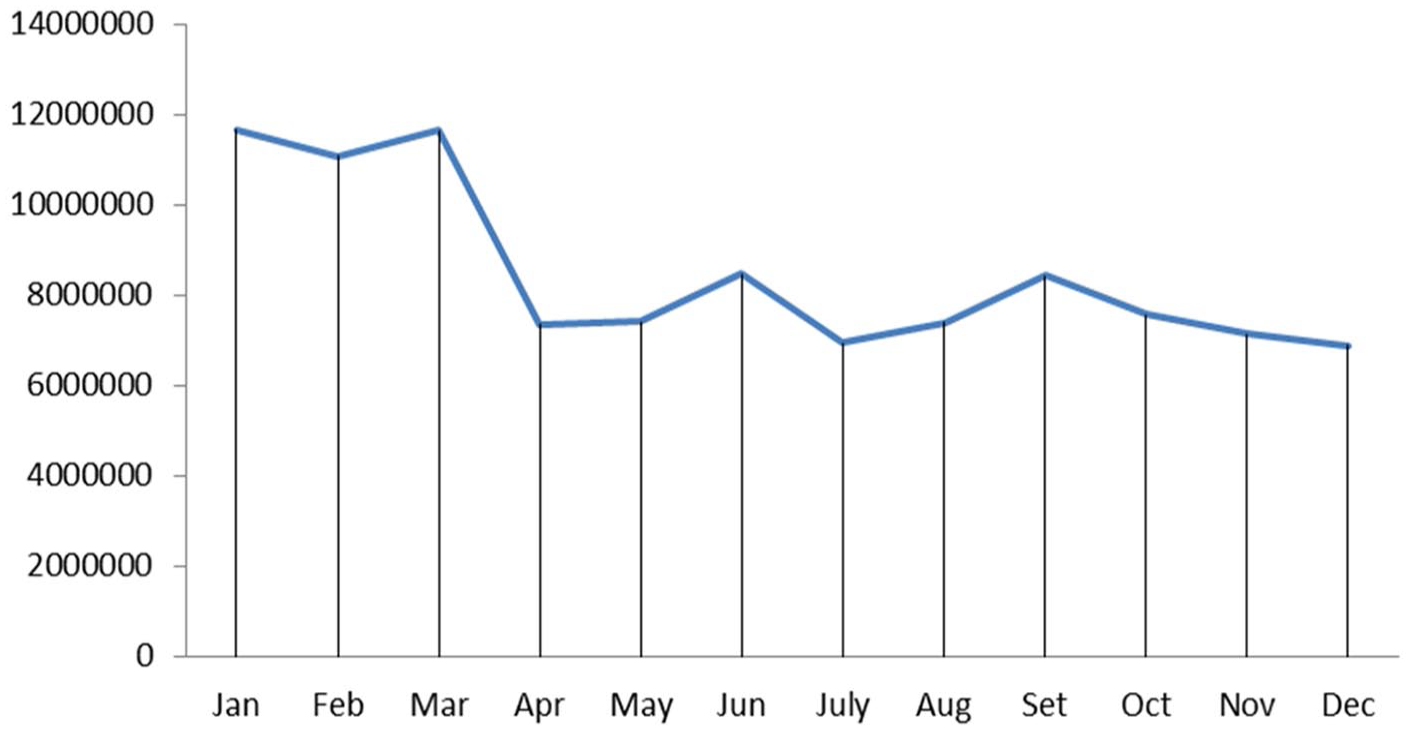
Mainland China’s monthly life premium revenue in 2010.
In addition, we also find that the Taiwan companies may not have an absolute advantage to compete with mainland China life insurance companies. Even mainland China and Taiwan have some common culture. In our empirical result, among the three Taiwan capital firms, only one is the efficient company (King Dragon Life Insurance Co. Ltd) in original data. However, there appears a big difference after the environment adjustment. The score of King Dragon sharply decreased to 0.0109 and the total average score of Taiwan capital firm is only 0.04179. As the subsidiaries are too young, we further examine the efficiency score of those parent companies in Taiwan to examine whether they have an advantage or not when in a co-market. We discover that the score of the King Dragon life parent companies—Taiwan Life Insurance is below 0.5 and the score of Shin Kong HNA parent company—Shin Kong is about 0.7. Therefore, we can say that even the parent company in Taiwan may not have an absolute advantage to compete with mainland China companies. Despite that, we also discovered that the Cathay parent company (Cathay Taiwan) obtained a full efficiency score when compared with other mainland China companies. It is the minority Taiwan insurance company that obtained a full efficiency score in our empirical results.
Finally, some directions for future research are provided. This study focused on evaluating the overall efficiency of insurance companies in mainland China and Taiwan by DEA method. The results discovered that mainland China’s score has dramatically decreased in 2010, and we think the reason may be the effect of tight regulation. But, we did not use the statistical or mathematical methods to examine the relationship between them. In addition, our method does not consider the relationship of time, and it means that each year of performance is individual. In the future, further researcher may consider the method that can evaluate the time relationship to measure the efficiency of insurance company in mainland China and Taiwan.
Footnotes
Declaration of Conflicting Interests
The author(s) declared no potential conflicts of interest with respect to the research, authorship, and/or publication of this article.
Funding
The author(s) received no financial support for the research, authorship, and/or publication of this article.