
Abstract
The purpose of this study is to analyze the influential factors of non-take-up citizens, who do not receive social benefits, to increase their discovery rate. A spatial regression model was used to analyze the variables affecting the discovery rates. As a result of the study, there was a difference in the percentage of welfare blind spots by region. In addition, when the proportion of the elderly population, the number of unemployment benefit recipients, etc. increased, that of welfare blind spots also increased; the lower the population density was, the higher the rate of increase in welfare blind spots became. Accordingly, in order to resolve the welfare blind spots at the local level, it is necessary to reinforce policy support for the elderly population and reduce the unemployment rate. Particularly, the policy will have to be prepared to resolve the welfare blind spots in rural areas with low population density.
Keywords
Introduction
Discussions on the discovery of non-take-ups in Korea, centered on the Ministry of Health and Welfare, began in 2013. Since 2015, by utilizing the social security information system (Hangbok-e-eum) of the Social Security Information Service, non-take-up citizens have been identified via the discovery model based on 29 linked variables. In Korea, non-take-ups include the non-receiving poor strata who do not receive social security benefits based on a fixed amount of recognized income (Hupkau & Maniquet, 2018; Reijnders et al., 2018).
As of 2019, there were approximately 10% non-take-ups from almost 6 million people with a receiving history through 29 linked variables, of which 30% to 40% of non-take-up citizens are being succored through confirmatory investigation of towns, villages, and dongs by local governments (Dubois et al., 2018; Fuchs et al., 2020). These non-take-up citizens include: (1) groups excluded from benefit rights because they do not meet the property and support obligation criteria among those who earn less than the minimum cost of living; (2) those facing economic troubles among near-poverty groups whose amount of recognized income is more than the minimum cost of living; (3) those who are eligible for the National Basic Livelihood Security System but are not actually receiving the benefits; and (4) those who are not adequately supported among beneficiaries because their income level is not appropriate.
The non-take-up discovery process in Korea encompasses collecting and analyzing big data related to vulnerable social groups associated with power failure, water supply cuts, non-payment of social insurance premiums, and more, and preemptively discovering and supporting non-take-up citizens. After 2015, starting with three trial services, non-take-ups were discovered using big data and 67,170 citizens were selected in March 2019. Regarding the discovery procedure, first, data collection is performed by aggregating 29 types of external linkage information and 37 kinds of internal information for collecting citizens in the social security information system. Second, through big data analysis of the collected data, discovery citizens are selected by the predicted statistical models for high-risk households. Third, a variety of support is provided, such as public and private services, emergency welfare services, and case management, after conducting on-the-spot surveys in towns, villages, and dongs for the selected discovery citizens (Lee et al., 2016; Pedersen & Wilkinson, 2018).
However, the scope of non-take-ups in Korea is narrower than that in Austria, Germany, and other countries, whose selection criteria for non-take-ups are based on basic income rather than recognized income (Fuchs et al., 2020). The process in Korea is highly likely to generate non-take-ups only from those with a history of social security benefits. Furthermore, differences were observed in the object discovery method. In Korea, 29 linked variables are used, and most are personal income-related variables, wherein predictive models are utilized for controlling various influencing factors at the regional level. European countries, on the other hand, extract non-take-up citizens through micro-simulation and use a predictive model reflecting various personal and regional variables for the whole nation (Bargain, 2017; De Agostini et al., 2018; Gallo, 2021; Van Lancker, 2015).
In Korea, the selection of non-take-up citizens varies in accuracy according to discovery criteria, linked variables, and discovery methods, among others. Furthermore, problems regarding non-take-ups are continuously arising, as variables that were not recognized earlier are emerging as linked variables. For example, the emergence of exceptional cases, such as mother–daughter families in dire circumstances and North Korean defectors, has expanded the scope of non-take-ups, which contributes to reducing the accuracy of predictive models (Leisering, 2009; Leisering & Barrientos, 2013). Therefore, consideration of the current non-take-up predictors, which are based on personal income, is urgent. Harnisch (2019) identified poverty extent, presence of children, householders’ age, volition to work, immigrant experience, housing type, and others as influencing factors on non-take-ups in Germany. Fuchs et al. (2020) considered employment status, household type, poverty gap, education level, housing type, gender, and so on as influencing variables through quantitative analysis of non-take-ups and regarded the size of local government as a regional influencing factor (Paz-Fuchs & Wynn, 2019). Hümbelin (2019) analyzed the factors affecting the effectiveness of non-take-up discovery using administrative data from Canton City, employing variables that reflect both personal and regional characteristics such as urban size, language, political ideology, and poverty level (Bruckmeier & Wiemers, 2018; Harnisch, 2019; Hümbelin, 2019).
This study identifies the regional variables that affect the discovery rates of non-take-ups and analyzes the influencing factors by implementing a geographic information system (GIS). Accordingly, we found that the non-take-up discovery model in Korea is excessively dependent on individual variables; thus, there is a lack of consideration of regional variables. Through this investigation, we intend to assist stakeholders in providing region-customized services and developing policy support to reduce non-take-ups.
Materials and Methods
Research Model
The purpose of this study is to analyze the influencing factors of non-take-ups using variables reflecting regional characteristics to increase the discovery rate of non-take-ups in Korea. To this end, we first conduct a theoretical review of the literature on non-take-ups and propose a new definition of non-take-ups to improve their discovery rate. Specifically, we reviewed studies conducted since 2015 to expand the scope of non-take-ups and derived the influencing variables of non-take-ups, centered on regional variables, as in previous studies. Second, information on the discovery rate of non-take-ups and the influencing regional variables was collected using national statistical data and administrative data. Third, a non-take-up discovery model was designed at the regional level. Fourth, the spatial regression model was used to analyze the variables affecting the discovery rate of non-take-ups. Fifth, the analyzed results were implemented in GIS (Geographic Information System), and policy implications were derived (Figure 1).

Flowchart of this research.
Definition of Variables
In the first study conducted for non-take-up discovery, variables were utilized to discover non-take-ups linked with information systems (Table 1). The specific variables are given in the textbox below a total of 29 kinds of externally linked variables, and 37 kinds of internal variables were used to discover non-take-up citizens in 2019.
Composition of Variables.

However, analyses based on household or individual units are more vulnerable to leaks of individuals’ personal information in implementing the influencing factors of regional units on the GIS. In addition, such a method is methodologically limited in that the non-take-up discovery models at the individual level cannot analyze the influencing factors of non-take-ups at the regional level. Therefore, in this study, we derived the variables influencing the discovery of non-take-up citizens through a review of precedent studies.
Dependent variable
First, the non-take-up discovery rate was selected as a dependent variable influenced by non-take-up-related regional variables. With respect to the extraction of non-take-up discovery citizens, a process conducted every 2 months, we set as the dependent variable the ratio calculated by adding up the total number of discovery citizens—a process conducted six times in 2018—and then dividing it by the number of actual discovery citizens. In the discovery rate of non-take-ups, we coded the city and country districts and harmonized regional independent variables in regional units with parameters. The welfare blind-spot discovery rate refers to the ratio actually selected as the welfare blind spot object compared to the parameter to become the welfare blind-spot discovery target. For example, if 500,000 people were suspected of being in the welfare blind spot and 50,000 of them were selected as welfare recipients, the discovery rate would be 10%. Eurofound (2015) believed that it was important to reduce the welfare blind spot and, to this end, it was necessary to simplify the procedure. In Korea, discovering welfare blind spots can be seen as a simplified procedure. In addition, most of the studies on welfare blind spots are mostly conducted in countries such as Europe and Korea, where government-led welfare services or medical services are being provided. Furthermore, it was judged that the study would be meaningful since there are no countries, such as Korea, where the region with high population density compared to area has a structure differentiated by district, such as large cities, small and medium-sized cities, farming and fishing villages, etc.
Independent variables
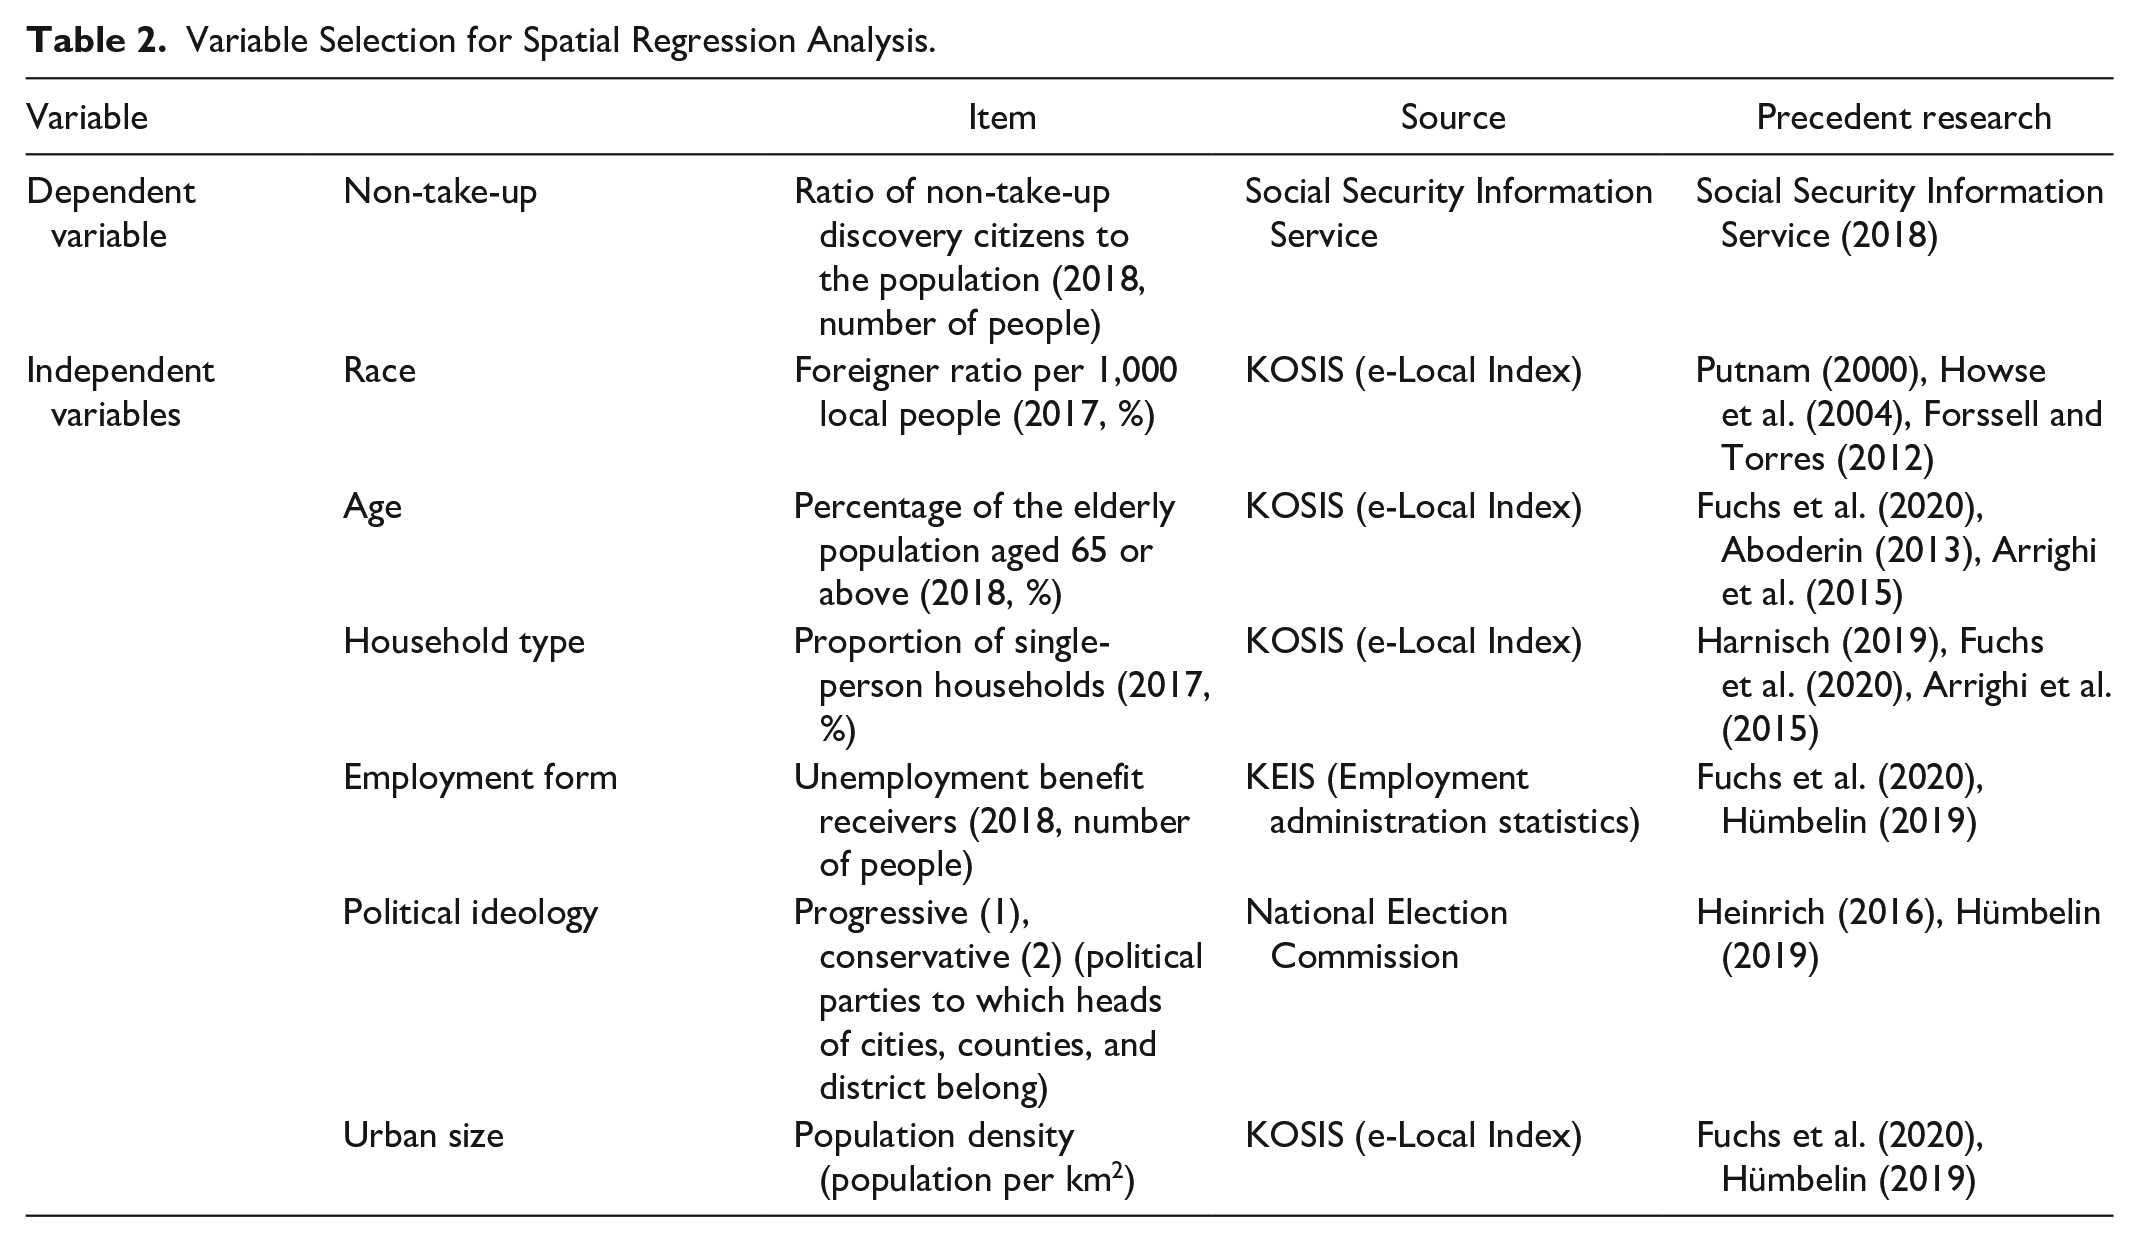
Race, age, housing type, household type, gender, employment type, political ideology, and urban size were selected as independent variables affecting the proportion of discovered non-take-up citizens—the dependent variables. First, regarding race, Putnam (2000) asserted that minorities with inaccessible political influence were classified as non-take-ups. Howse et al. (2004) found that minorities did not receive sufficient local health and social services compared to the national majority. Forssell and Torres (2012) also found that despite wide cultural diversity in Sweden, 16% of people from other countries were more likely to be classified as non-take-ups. Therefore, in this study, we used the ratio of foreigners per 1,000 Korean individuals as an independent variable (Forssell & Torres, 2012; Howse et al., 2004; Uslaner, 2010).
Second, the proportion of the elderly population aged 65 years or above was selected as a variable influencing non-take-ups. Fuchs et al. (2020) found through a simulation study that the higher the age, the more likely an individual is to be classified as a non-take-up. Aboderin (2013) argued that most non-take-up studies are related to aging. In addition, Arrighi et al. (2015) stated that elderly individuals who are eligible for the long-term care system but who do not apply for benefits are classified as non-take-ups (Aboderin, 2013; Fuchs et al., 2020; Riedel, 2013).
Third, Harnisch (2019), Fuchs et al. (2020), and Arrighi et al. (2015) identified household type as an influencing factor. Harnisch (2019) suggested that the type of household, such as single-person households and households with children, might influence non-take-up discovery. According to Fuchs et al. (2020), couples with children also play a role. Meanwhile, Arrighi et al. (2015) suggested that household types, such as cohabitation, determine non-take-up discovery. Accordingly, in this study, we selected the proportion of single-person households as the influencing factor for non-take-ups, as the number of studio-type houses among the low-income population living in dense areas is high relative to other household types (Arrighi et al., 2015; Fuchs et al., 2020; Harnisch, 2019).
Fourth, studies have found that employment type affects non-take-up discovery. Fuchs et al. (2020) stated that employment status, such as unemployment, inactivity, and retirement, influences non-take-up discovery. Hümbelin (2019) asserted that the importance of non-take-up discovery has increased as unemployment has emerged as a social problem since the 1990s. In the meantime, the study of Achim et al. (2020) showed that the corruption level might affect physical and mental health through economic development and cultural frameworks, where the unemployment rate was used as an alternative indicator of economic development and national corruption was not considered (Achim et al., 2020).
Therefore, this study selected the number of beneficiaries of unemployment benefits as an influencing factor for non-take-ups (Fuchs et al., 2020; Hümbelin, 2019).
Fifth, some studies have reported that political ideology affects non-take-up discoveries. Heinrich (2016) suggested that the public administration of non-take-ups depends on the propensity of bureaucrats who distribute social security benefits. Holmberg and Rothstein (2011) also thought that the quality of government (QoG) and public cost procurement could influence the improvement of healthcare services, and thus, that the role of the government was important. In addition, Hümbelin (2019) argued that left- or right-wing ideology influences the effectiveness of non-take-up discovery. In this regard, this study distinguished between conservatives and progressives based on the political parties to which mayors, county governors, and heads of district in cities, counties, and district belong (Heinrich, 2016; Hümbelin, 2019).
Sixth, urban size has also been identified as a factor influencing non-take-up. Fuchs et al. (2020) stated that the larger the local government, the more negative the effect on non-take-ups. In addition, Hümbelin (2019) suggested that non-take-up discovery varies by the size of congested areas, rural areas, and so on, and that living in rural areas had a significant impact on non-take-ups. In this regard, this study selected the population density of each city, county, and district as independent variables (Fuchs et al., 2020; Hümbelin, 2019).
In analyzing regional variables affecting the non-take-up discovery rate, the validity of data and the clarity of data sources for spatial regression analysis are important. Accordingly, this study measured the non-take-up discovery rate at the city and province levels, but not at the household and individual levels, and utilized only administrative data extracted from the Korean Statistical Information Service (KOSIS), National Election Commission, and Ministry of Employment and Labor for the remaining regional variables. The target area of this study was all 230 local governments in Korea; these 230 regions were marked on the map, and 17 cities and provinces, which are larger regional units, were determined as boundary lines. In addition, North Korea’s data were omitted, considering the divided situation of Korea. The specific variables and sources are presented in Table 2.
Variable Selection for Spatial Regression Analysis.
Methods
Spatial regression analysis was used to analyze the regional variables affecting the non-take-up discovery rate. In this study, we are interested in space in non-take-ups because mutual influences can be exchanged between elementary local self-governments, which can increase the geographic heterogeneity of non-take-ups. In other words, local governments in neighboring regions may execute new welfare projects to gain support from non-take-ups, which can accelerate policy transfers to other municipalities. In addition, this will enable beneficiaries to move to areas where local governments are in their favor, although such movements may not be common. Thus, fiscal expenditures of local governments, including on welfare, are affected by fiscal expenditures of other local governments in close proximity, and their fiscal expenditure structures may be similar (Barreira, 2011; Brueckner, 2000; Case et al., 1993; Dahlberg & Edmark, 2008; Hong & Yim, 2019; Saavedra, 2000, Re-citation). In other words, geographically adjacent municipalities interact and exhibit similar behaviors, which can be explained by spatial autocorrelation or spatial interaction (Barreira, 2011; Brueckner, 2000; Case et al., 1993; Dahlberg & Edmark, 2008; Hong & Yim, 2019; Saavedra, 2000).
Spatial data may exhibit spatial dependence and heterogeneity. In this study, the use of linear least squares (OLS) resulted in considerable errors. The OLS regression model assumes that the observed and error values of dependent variables are mutually independent, but when spatial autocorrelation occurs due to spatial dependence, this assumption is broken. To control for spatial dependence of spatial data, many studies have employed spatial regression models, which can largely be divided into the spatial lag model, which utilizes spatially autoregressive dependent variables, and the spatial error model, which uses spatially autoregressive errors. Combined, these two models are commonly referred to as the spatial autoregressive model (Martinetti & Geniaux, 2017; Teng et al., 2019).
Tests need to be performed to determine the most fitted model among OLS, spatial lag, and spatial error. First, the OLS model’s fitness test should use assumptions on normality, homoscedasticity, and spatial independence, which were calculated from the OLS model. Then, the spatial dependence of the dependent variables and error terms was determined using the Lagrange multiplier (LM) lag and error. If the LM lag and error were significant at α = .05, the null hypothesis of the spatial independence of dependent variables and error terms was rejected. If only one value of the LM lag or error was statistically significant, the model was selected; if both were significant, a reselection process was conducted via a significance test on the statistics for robust LM lag and robust LM error. The goodness-of-fit of the spatial regression model was estimated by comparing the values of R2, log likelihood, Akaike information criterion, Schwarz criterion (SC), and others. The models whose log-likelihood values increased and whose Akaike information criterion (spatial autocorrelation model) and SC (tolerance model) reduced more than the corresponding values of the OLS model were classified as better fitted (Acosta et al., 2006; Wang et al., 2019).
As discussed, to accurately establish the factors affecting non-take-up discovery, it is necessary to control for spatial autocorrelation. Therefore, since local governments in Korea were set as an analysis unit in this study, accurate analysis would be impossible if space control was not achieved; therefore, we performed spatial regression analysis to consider spatial autocorrelation. This clarified whether the non-take-up discovery variables related to local governments were autocorrelated and helped establish the factors influencing non-take-up discovery. The data on space in Korea are administrative data from KOSIS’s local index, the National Election Commission, the Ministry of Employment and Labor, and so on; spatial regression analysis was performed using the Geoda program created by Professor Luc Anselin.
Results
Basic Statistical Analysis
The results of the basic statistical analyses of the variables are shown in Table 3. In 2018, the average number of non-take-up discovery citizens was 0.00464 compared to the total population of 227 local governments, except Jeju, which has no geographical proximity. The mean proportion of foreigners per 1,000 local individuals was 21.69%; the mean proportion of the elderly population aged 65 or above was 20.12%, the mean proportion of single households was 30.84%, the number of unemployment benefit recipients was 6,066.61, the number of cases in which the heads of the cities, counties, and district belong accounted for 67% on average; and the mean population density was 3,946.17.
Results of Descriptive Statistical Analysis.

The minimum rate of welfare blind spots was 0.27%, and the area with the highest rate was 1.33%. For the percentage of foreigners per 1,000 people, the lowest was 3.49 people, while the highest was 38.8%. This is because there are many foreign workers in the region where factories are concentrated. The proportion of the elderly population came to further increase as going from large cities (8.02%) to rural areas (38.87%). The region with the lowest number of unemployment benefit recipients fell in 235 people, whereas that with the highest number was 32,944 people. The region with the highest population density was 18.89 people per 1 km2, and that with the largest population was 27,445 people.
Spatial Autocorrelation Analysis
To investigate the spatial autocorrelation of non-take-up discovery citizens of local governments in Korea, we examined a quartile map. Compared to the regional population, the ratio of non-take-up discovery citizens was high mainly in Jeollabuk-do, Jeollanam-do, Gyeongsangbuk-do, and eastern Gyeonggi-do, but was relatively lower in the capital areas of Gangwon-do, southern Gyeonggi, and Chungcheongbuk-do. In the top 25% of the regions, the ratio of non-take-up discovery citizens ranged from 0.006 to 0.013, whereas in the bottom 25%, the ratio of non-take-up discovery citizens ranged from 0.001 to 0.003.
Figure 2 shows the regional differences in the ratio of non-take-up discovery citizens and the distribution of regions based on their ratios. Specifically, regions with similar ratios are located adjacent to each other. The quartile map shows that spatial autocorrelation between the regions may exist.

Quartile map on the ratio of non-take-up discovery citizens compared to population.
They show the Global Moran’s I using the queen and rook methods, respectively. The Global Moran’s I using the queen method was 0.485701 and that using the rook method was 0.485856, reflecting that both methods were high, meaning that they were statistically significant.
Figure 3 shows the results of local autocorrelation. The local autocorrelation analysis results from the clustered regions have similar values. The cluster types are divided intohigh -,low -,low -, and high-low; spatial clusters exist in the high-high and low-low types (Anselin, 2005). Examining the queen-type local autocorrelation of the 227 units of cities, counties, and district, 33 were classified as high-high clusters and 47 as low-low clusters. High-high clusters appeared mainly in Jeonbuk, Jeonnam, and Gyeongbuk; low-low clusters were centered in the metropolitan area.

Results of local autocorrelation analysis (queen model).
Investigating the rook-type local autocorrelation, 34 units were classified as high-high clusters and 45 as low-low clusters. The distribution appeared to be similar to that of the queen type, but the high-high distribution in the Gyeongbuk area was wider for the rook type (Figure 4).

Results of local autocorrelation analysis (rook model).
To establish an appropriate spatial regression model, this study used a bottom-up approach, which moves from specific to general. The bottom-up approach is used to compare OLS models, SLMs, and spatial error models (SEM) to select the best-fit model and is considered to be excellent (Florax & Nijkamp, 2003; Seok-hwan, 2014). Using the bottom-up approach, Moran’s I value calculated by the queen method was 3.7954, which is smaller than that obtained by the rook method (3.8623). The LM (lag) value in the Queen method was 4.4313, which was statistically significant, whereas the robust LM (lag) value was 0.0345, which was not statistically significant. The LM (err) value was 11.3353, and the Robust LM (err) value was 6.9385, both of which were statistically significant. Accordingly, the spatial error model was found to be more appropriate than the spatial lag model.
Table 4 shows the analysis results of the OLS models, SLMs in the queen method, and SEMs in the queen method. First, the results of the OLS models showed that the proportion of the elderly population aged 65 or above and the number of unemployment benefit recipients had a positive (+) effect on the non-take-up discovery rate, but population density had a negative (−) effect. The R2 value of the OLS model is 0.61, which can be considered to be fitted if there is no spatial autocorrelation. However, the Jarque-Bera value was 20.2758 (p < .001), so the null hypothesis on the normality of error terms was rejected. The Breusch-Pagan value was 52.7166 (p < .001) and the Koenker-Bassett value was 34.8394 (p < .001), which showed that both had heteroscedasticity in the error terms. Therefore, it is more appropriate to use the spatial regression model instead of the OLS model.
Comparison of Spatial Autocorrelation.
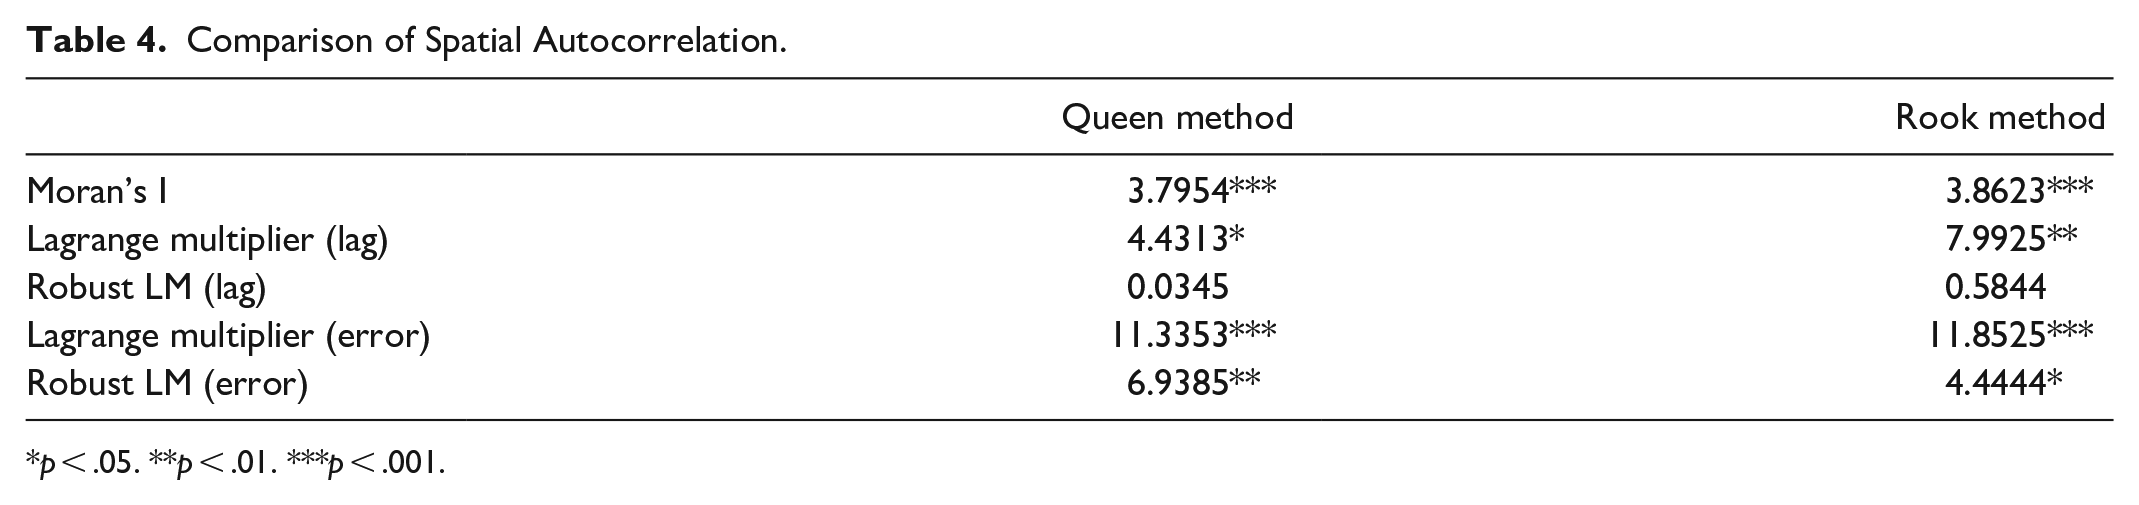
p < .05. **p < .01. ***p < .001.
Thus, the OLS model was found to be unsuitable, and the more suitable option between SLMs and SEMs was chosen as follows. The R2 value of the SEM was 0.64, which is higher than that of the SLM (0.62); thus, it had a higher explanatory power. The log likelihood of the SLM was 1128.41, whereas that of the SEM was 1131.15. Finally, the Akaike information criterion of the SEM was –2248.3, which is lower than that of the SLM. Overall, SEM was found to be a more suitable model.
The results of the SLM were similar to those of the OLS. The proportion of the elderly population aged 65 or above and the number of unemployment benefit recipients had a positive (+) effect on the non-take-up discovery rate, whereas population density had a negative (−) impact. In the SEM, the proportion of the elderly population aged 65 or above had a positive (+) effect on the non-take-up discovery rate, but population density had a negative (−) impact (Table 5). Since Korea has 230 local governments, the parameters used in the spatial regression model were analyzed using all numbers, which could have limitations in the size of the parameters.
Analysis Results of the OLS Model and Spatial Regression Models (Queen Method).
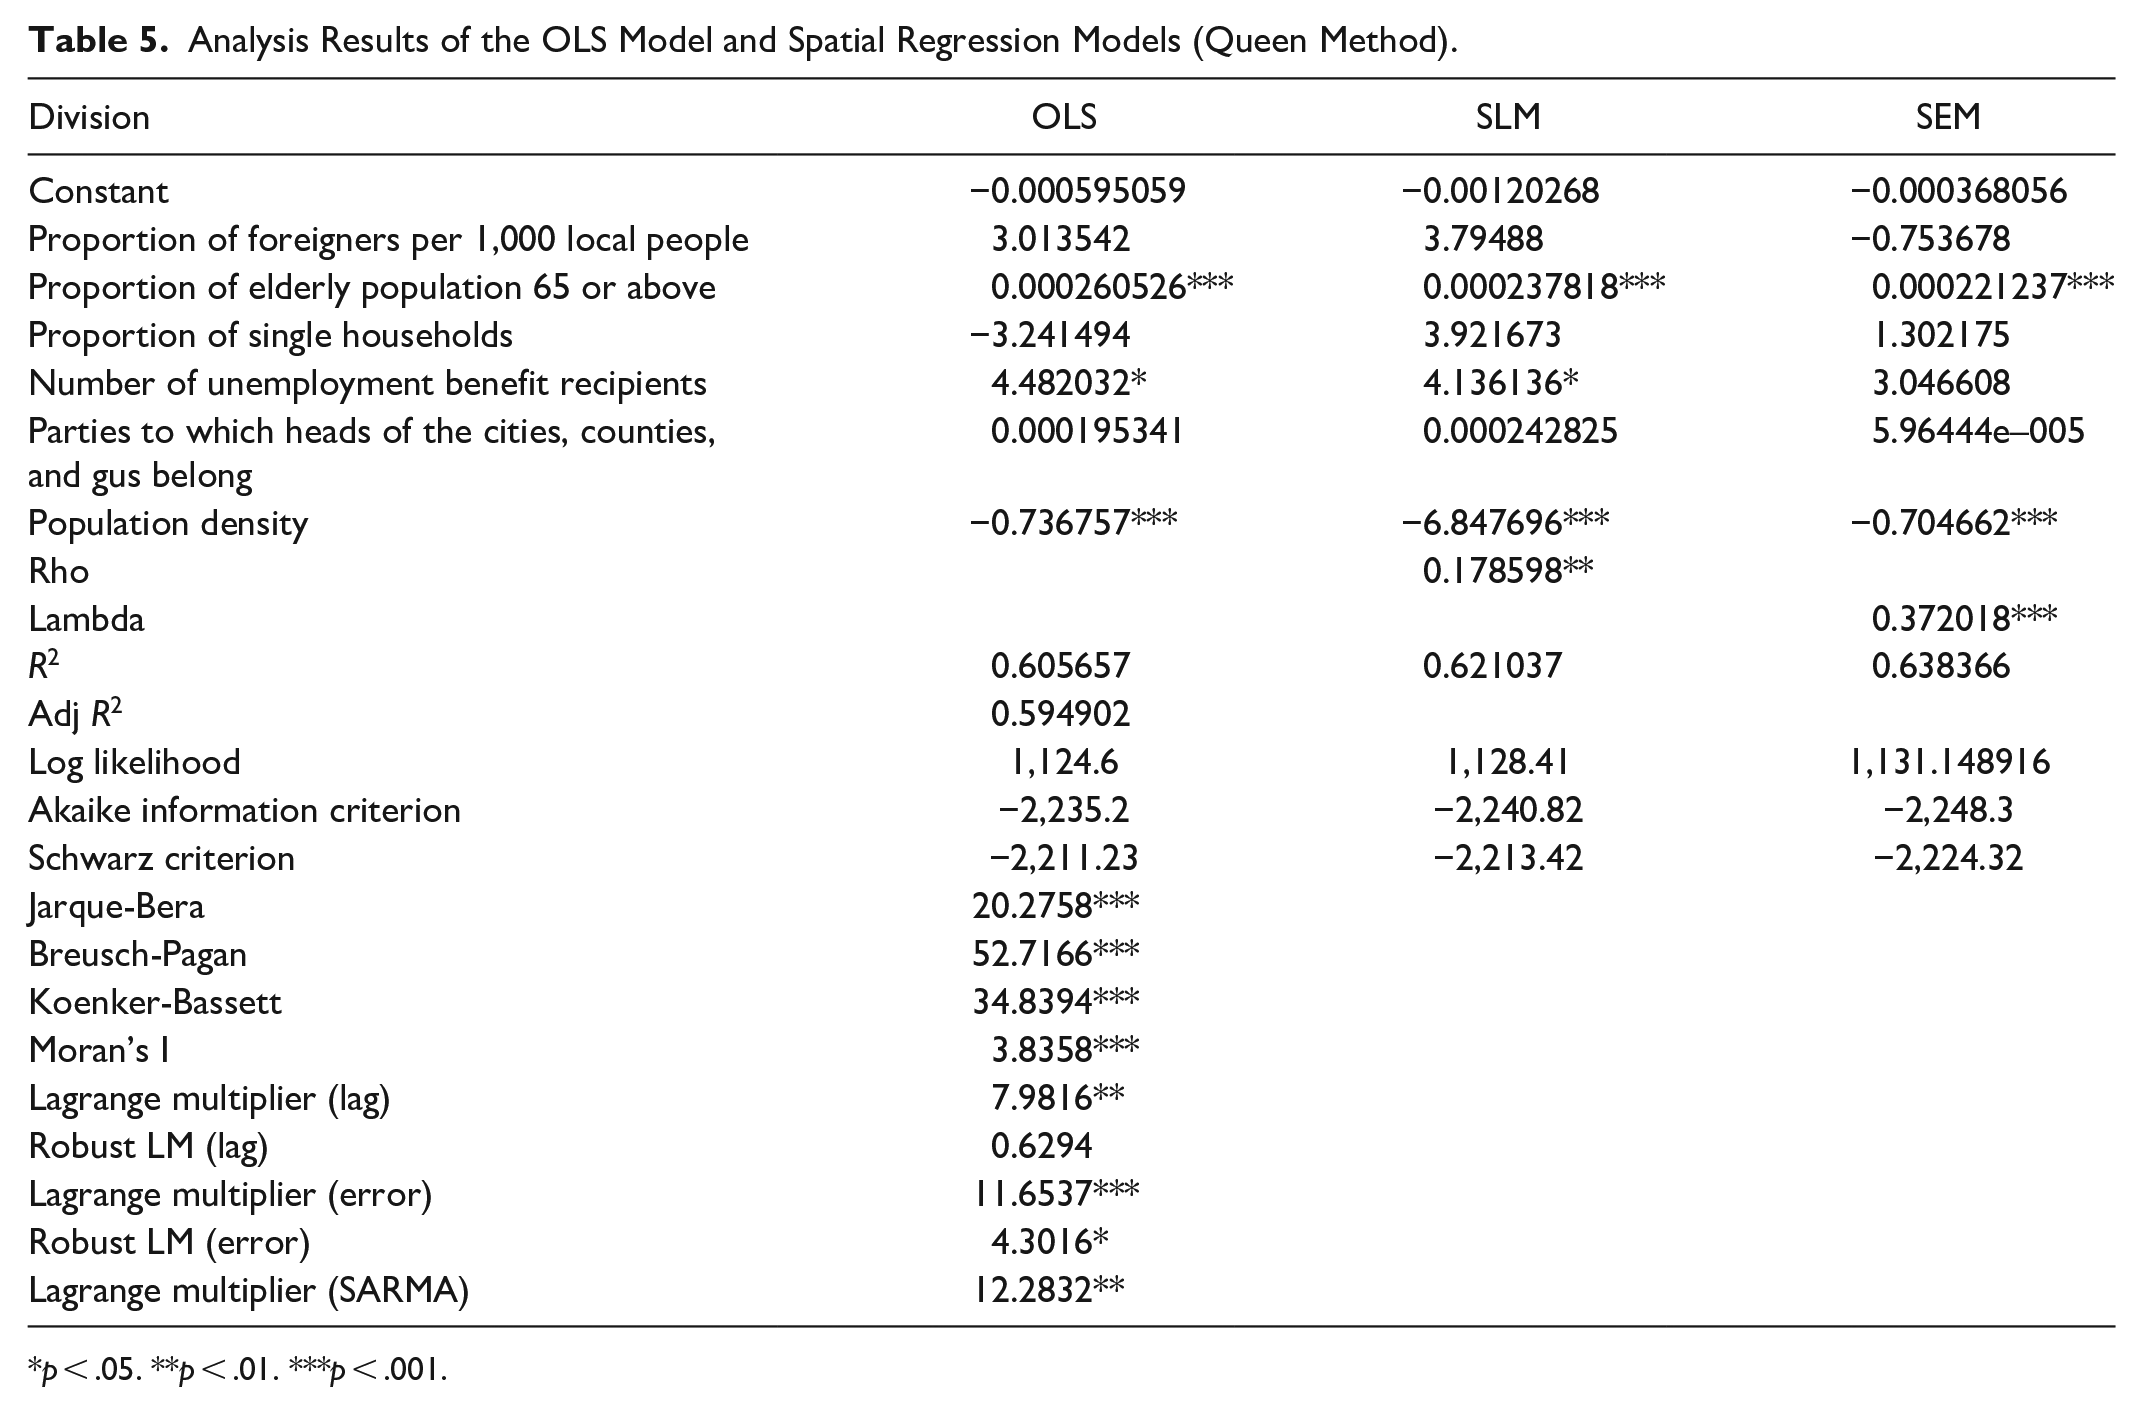
p < .05. **p < .01. ***p < .001.
Discussion
This study analyzed factors affecting the non-take-up discovery rate using spatial regression analysis, taking the proportion of foreigners, proportion of the elderly population aged 65 or above, proportion of single households, number of unemployment benefit recipients, political ideology, and urban size as independent variables.
First, we found a regional gap in the non-take-up discovery rate. When examining local autocorrelation of the queen type, 33 units emerged as high-high clusters and 47 units as low-low clusters among the total 227 units of cities, counties, and district. High-high clusters appeared mainly in Jeonbuk, Jeonnam, and Gyeongbuk; low-low clusters were centered on metropolitan areas. It can be seen that the capital area is a metropolis region, while Jeonbuk, Jeonnam, Gyeongbuk, etc. are farming and fishing areas. For these areas, there is a difference in benefit criteria in terms of livelihood benefits, medical benefits, education benefits, housing benefits, and so on; therefore, it is more likely that welfare blind spots exist in the farming and fishing areas.
Second, investigating the rook-type local autocorrelation, 34 units were classified as high-high clusters and 45 units as low-low clusters. The distribution was similar to that of the Queen type, but the high-high distribution in the Gyeongbuk area was wider in the rook type. In the case of the Gyeongbuk region, it is a region belonging to a super-aging society; it was found that it has a higher poverty rate for the elderly, so that welfare blind spots are likely to be high there.
Third, to analyze the factors affecting the non-take-up discovery rate, OLS, SLM, and SEM were performed. The results of the SLM were similar to those of the OLS. The proportion of the elderly population aged 65 or above and the number of unemployment benefit recipients had a positive (+) effect on the non-take-up discovery rate, whereas population density had a negative (−) impact. Since the metropolis areas with high population density have a relatively lower elderly population rate and unemployment rate than those of farming and fishing areas, and the geographic scope of the region in which public officials should be in charge is narrow, the welfare blind spots could be reduced.
Fourth, in the SEM model, the proportion of the elderly population aged 65 or above had a positive (+) effect on the increase in the non-take-up discovery citizens, but population density had a negative (−) impact on that. Accordingly, to enhance non-take-up discovery at the local level, social support for the elderly population should be strengthened. Furthermore, related policies should be reinforced in rural areas with low population densities.
Nevertheless, this study has the following limitations. First, attempts have been made to extend the theoretical discussion on non-take-ups to Europe, redefine new concepts, and benchmark new models to measure non-take-ups. However, unlike in Korea, consideration of the political, economic, social, and cultural characteristics in European countries was insignificant in these attempts.
Second, as the focus herein was on regional non-take-up discovery, less attention was given to the association with resources held by local communities. Therefore, follow-up studies will be necessary to develop non-take-up models that consider public or private resources in local communities.
Third, since we limited our research to regional units and analyzed the influencing factors of regional units on the non-take-up discovery rate, there was a lack of consideration of policy support functions. Region-customized policies should be provided by implementing non-take-up-related local variables and welfare information through the GIS map; decision-making systems for policymaking, research support, and so on—which use social security information—should be prepared.
Conclusions
Spatial regression analysis was performed to analyze the regional variables affecting the non-take-up discovery rate. The following implications are based on the results. First, this study attempted to identify the factors influencing non-take-up discovery at the local level, which was implemented in the GIS. Accordingly, this study can provide a basis for the development of customized region-specific non-take-up discovery models and relevant policies. Korea, in particular, has strong regional characteristics regarding non-take-ups; this necessitates extensive regional research as there are many factors of income-related non-take-up, such as housing type, health status, and unemployment level.
Second, this study suggests the possibility of developing more sophisticated predictive models by incorporating non-take-up predictive models into the GIS. In these predictive models, it is necessary to include not only variables related to individuals and households but also those associated with regions. In particular, as environmental variables related to regional non-take-ups vary, they may contribute to the development of customized region-customized non-take-up models (Siebertova et al., 2016; Van de Walle, 2018).
Third, we will expand the citizens and areas from the existing risky households to those such as caring blind spots, medical blind spots, children blind spots, and elderly blind spots, and derive analysis indexes affecting non-take-ups to develop predictive models that could be implemented on the GIS. Specifically, it may be necessary to update regional variables such as increases in the elderly population, population density, and unemployment benefits.
Fourth, we can consider and index various variables related to non-take-ups by city and province and by city, county, and district. Notably, unique regional properties, such as characteristics of residential types and blind spots related to income, should be reflected in non-take-ups. To this end, it will be necessary to develop a module-type non-take-up predictive model that can cluster regions and suggest where various variables for each region can be applied.
Fifth, in the long term, it will be necessary to maintain the non-take-up discovery model of the Social Security Information Service and simultaneously develop a new predictive model that can reflect local characteristics and increase the predictive power of the model. An integrated predictive model needs to be developed that considers both local and individual variables simultaneously. Such models have been utilized in many European countries, and it is necessary to establish national non-take-up discovery platforms for Korea through microsimulation based on panel surveys.
In this study, the existing discovery methods of welfare blind spots have been performed based on individuals or households, which could also contribute to the low discovery rate of welfare blind spots. This study assumes that regional factors could influence the discovery of welfare blind spots and then analyze the influencing factors by using administrative variables related to regional characteristics. In addition, since individual factors are included in the dependent variable of the welfare blind spot discovery rate, it is judged to be an original study considering the influence of regional characteristics on the discovery rate induced by individual variables. Therefore, a hierarchical study combining regional and individual factors is limited. Furthermore, it is necessary to increase the validity of the variables that describe regional characteristics through additional research. Specifically, it is possible to compare individual and regional influencing factors through the multi-level model to comprehensively analyze groups and individuals.
Nevertheless, at a time when discussions on welfare blind spots are active around the world, analyzing the Korean situation where welfare blind spots are discovered through government-led efforts provides implications on what role the government-led welfare policy should play in discovering welfare blind spots where regional characteristics are reflected.
Particularly, in the case of countries that determine the criteria of a certain livelihood benefit based on income or that use complex criteria, such as income, housing, or the like, there is a possibility that welfare blind spots may occur as well among the households that do not meet the criteria. Used in some European countries, the statistical estimation scheme through micro-simulation also has a high occurrence probability of households being excluded. Therefore, it will be necessary to consider the minimization of welfare blind spots through Korea’s direct welfare blind spot discovery system.
Footnotes
Authors’ Contributions
GP, ML participated in the study design, collected and analyzed the data, and drafted the manuscript. KY participated in the study design, and the analysis revised the manuscript. All authors read and approved the final manuscript.
Declaration of Conflicting Interests
The author(s) declared no potential conflicts of interest with respect to the research, authorship, and/or publication of this article.
Funding
The author(s) disclosed receipt of the following financial support for the research, authorship, and/or publication of this article: This research was supported by the Ministry of Education of the Republic of Korea and the National Research Foundation of Korea (NRF-2021R1I1A4A01057428) and Bio-convergence Technology Education Program through the Korea Institute for Advancement Technology(KIAT) funded by the Ministry of Trade, Industry and Energy (No. P0017805).
Availability of Data and Material
All data generated or analyzed during this study are available upon request from the authors.