
Abstract
This study aims at advancing leadership research in corporate communications by introducing a more rigorous statistical approach to test whether communication professionals of different hierarchical reporting levels, years of experience, and educational backgrounds would ascribe the same meanings to the construct of leadership excellence in corporate communications via survey research. By using an established measurement model of leadership excellence in corporate communications, the study uses three samples, including senior communication executives/leaders, mid-level communication professionals, and senior college students majoring in communication and/or public relations, to conduct the measurement invariance tests. By imposing constraints to different parameters in a sequence of nested models, findings indicate that the measures of leadership excellence in corporate communications can be equivalent across multiple groups. Measurement invariance was confirmed at multiple levels, including the higher-order measurement model, configural invariance, metric invariance, scalar invariance, and error invariance. This study deepens our understanding of measurement invariance when applying multi-group comparison in testing leadership excellence. Such evidence can also be used as central principles when developing corresponding leadership training and development modules by organizations in supporting multicultural and multi-group sensitivity in leadership development. Future research and practical implications are also discussed.
Keywords
Introduction
This research aims at advancing corporate communication leadership research in by introducing a more rigorous research method and a sophisticated statistical approach, namely measurement invariance (MI), to test the latent variable model of leadership excellence in corporate communications. By using multiple samples recruited via survey research, the statistical approaches to measurement invariance help test whether communication professionals of different hierarchical reporting levels, years of experience, and educational backgrounds would ascribe the same meanings to the construct of leadership excellence in corporate communications. Although research on corporate communications in the past two decades has enriched our understanding of corporate communications as a diverse and evolving field, which is composed of various specialized areas of communications such as corporate identity, corporate reputation, corporate advertising, corporate social responsibility, corporate social advocacy, media relations, financial communication, employee communication, and crisis communication (e.g., Argenti, 1996; Rim et al., 2020; van Riel, 1997), few research has addressed the issue of measurement invariance in assessing values of model parameters when the statistical approach of structural equation modeling is applied. This could leave some potential measurement biases undetected, especially when testing latent variable models in theory development and advancement.
The past research efforts on measurement theories in corporate communications have been dedicated to measure how effective communication strategies are by linking the contribution of communications to organizations’ financial and business performance (e.g., Buhmann et al., 2019; Gregory & Watson, 2008; Macnamara, 2014, 2015; Meng & Berger, 2012; Volk, 2016; Watson, 2012; Zerfass et al., 2017). However, the importance of minimizing some possible underlying biases by using multiple-group samples in empirical research has not been addressed at the level of measurement invariance when proposing and testing new constructs in theory development in corporate communications. Although some recommended methods for detecting measurement biases in relation to ethnicity or gender before or during data collection (e.g., Griffith & Schuster, 2002; Holland & Wainer, 2015) have been applied to reduce potential biases across various conditions, the assessment of measurement invariance of latent variable models has not been widely applied in corporate communications research as a reliable and advanced statistical approach. If the notion of testing measurement invariance is to confirm “a measuring device should function in the same way across varied conditions, as long as those varied conditions are irrelevant to the attributes being measured” (Millsap, 2011, p. 1), it is critical to evaluate and address measurement accuracy through the psychometric perspective in theory development and multi-sample testing in corporate communications research.
As addressed by researchers in organizational behavior, educational psychology, and measurement in psychology (e.g., Meredith & Teresi, 2006; Millsap, 2011; Millsap & Olivera-Aguilar, 2012; Vandenberg & Lance, 2000), to evaluate measurement invariance is to address several key questions by documenting group differences in item scores. These questions include: (1) Do members in different social groups interpret given measures of certain constructs or underlying theoretical variables in a conceptually similar way? (2) Do measurement instruments define performance and/or perceptions in similar ways so members in different social groups can have similar identifications? and (3) Do members reflect “any real difference on the attribute” through “the psychometric perspective” (Millsap, 2011, p. 3)? With respect to this assessment approach, scholars in international marketing and management argued that the validity of multi-group data analyses (e.g., in cross-cultural/ethnic contexts, gender and cross-age comparison) could be questioned if measurement invariance is not established (e.g., Dong & Dumas, 2020; Knickenberg et al., 2020; Singh, 1995; Steenkamp & Baumgartner, 1998; Van der Vijver & Leung, 1997).
Therefore, this study aims at addressing measurement invariance as an important statistical assessing approach when testing a structural equation model across multiple samples corporate communication leadership research. To address this testing approach, the study uses an established measurement model of leadership excellence (Meng, 2009, 2012; Meng et al., 2011; Meng & Berger, 2013) by using multiple samples as an example to provide a general procedure of the statistical approach. By providing an illustration of the measurement invariance assessment in empirical settings, the study advances our knowledge not only in the topic of communication leadership as related to corporate communications but also in statistical approaches to evaluate measurement bias in latent variable models with multiple samples.
Overall, the contribution of this research is trifold: First, a key contribution is to further validate item responses scales in extending the established measurement model of leadership excellence in corporate communications to multiple populations. Second, by testing measurement invariance of the leadership excellence model, it enables us exploring both practical and theoretical implications of the construct and its variations in corporate communications, which helps address a key research question in multi-group assessment: Are established scales to measure leadership excellence in corporate communications coherent and invariant? Lastly, the research contributes to leadership research in corporate communications by adding the methodological notes on measurement invariance. The study concludes with practical implications and suggestions for future research on measurement invariance.
Literature Review
Measurement Invariance (MI) as an Assessment Approach in Management Science
Cross-cultural/national comparative research by using multiple groups of populations is a common approach in management science to study group differences. We have witnessed numerous studies published in educational psychology, international marketing, management, and organizational behaviors to address the importance of practical implications based on group differences revealed. Although this stream of research has provided valuable insights in understanding individual/group differences rooted in cultural settings, the importance of minimizing underlying biases in “cross-cultural comparisons of personality traits” (Dong & Dumas, 2020, p. 109956) cannot be ignored (e.g., Borsboom et al., 2008; Brandt et al., 2020; Eigenhuis et al., 2015). Typically, this type of cross-cultural/national multi-group data is collected at the individual level by using the method of survey research. Before the research results can be compared across different groups, researchers must demonstrate the evidence that individuals from different samples ascribed essentially the same meanings to the psychometric measures designed to describe a defined attribute. If results from cross-national or multi-group analyses showed “different scores or interpretations” (Millsap, 2011, p. 3), researchers need to validate “whether the results are measurement and scaling artifacts or true cultural differences” (Mullen, 1995, p. 574). Hence, the observed differences may have multiple interpretations: Do the results reflect a real difference on the measured attribute due to systematic cultural or group differences in interpretation, or the results “failed to reflect any real differences on the attribute” (Millsap, 2011, p. 3).
Therefore, to solve this widely presented problem when conducting cross-cultural comparisons, the approach of measurement invariance is used to ensure the comparability (e.g., Cheung & Rensvold, 2002; Mullen, 1995; Myers et al., 2000; Steenkamp & Baumgartner, 1998; Vandenberg & Lance, 2000). As a technique widely used by social science researchers, measurement invariance helps assess “whether the same models hold across different populations” (Mullen, 1995, p. 575) or determine “if items used in survey-type instruments mean the same thing to members of different groups” (Cheung & Rensvold, 2002, p. 233).
The importance of validating measurement invariance is apparent when consumer behaviors from multiple samples are investigated (e.g., consumers’ interpretation of a given construct and responses to certain scale items may vary across cultures “when the cultures speak different languages, and when researchers use translated versions of a survey instrument”) (Cheung & Rensvold, 2002, p. 234). Consequently, if evidence supporting the invariance of a measured attribute is lacking, conclusions based on that measurement scale/items can be ambiguously or erroneously interpreted as it is unknown if the difference reflects the result of a true attitudinal difference, or it is about different “psychometric responses to the measurement properties” (Vandenberg & Lance, 2000, p. 5). Failing to establish consistent scales presents the major threats to “the evaluation of measurement equivalence of multi-item composite measures” (Vandenberg & Lance, 2000, p. 5).
Based on Dong and Dumas (2020) systematic review of research on measurement invariance across several common demographic variables such as gender and age, a general approach to establish different levels of measurement invariance is through “a confirmatory factor-analysis (CFA) framework” (Vandenberg & Lance, 2000, p. 5) or Item Response Theory (as seen in Millsap & Everson, 1993). By using the CFA framework, researchers are subjected to test a series of nested models by specifying “cross-group equality constraints” on different parameters (Kline, 2005, p. 290). The fit of the series of constrained models will help researchers determine the level of measurement invariance of a given attribute across multiple populations (e.g., Shi et al., 2019; Wu et al., 2009). Over the past decade, this has been accepted and applied as a widely accepted statistical approach to test more restrictive models in order to establish measurement equivalence in social and behavioral science (Millsap & Olivera-Aguilar, 2012). This following section reviews and explains the rationale of testing a series of nested measurement models by adding constraints at different levels in the realm of SEM.
Measurement invariance at different levels
Measurement invariance (MI) refers to “the measurement property of X in relation to the target latent trait Wt are the same across populations” (Millsap, 2011, p. 46). It indicates the latent traits are measured in the same way by applying to multiple groups or occasions (Dong & Dumas, 2020; Millsap & Olivera-Aguilar, 2012). This statistical approach can be applied to assess multiple levels of invariance by imposing constraints to different parameters as suggested by scholars in empirical social, behavioral, and organizational research (e.g., Dong & Dumas, 2020; Little, 1997; Millsap & Olivera-Aguilar, 2012; Mullen, 1995; Steenkamp & Baumgartner, 1998; Vandenberg & Lance, 2000).
Configural invariance is to determine equal factor structure in the baseline model; that is “whether the factor structure” and “the pattern of indicator-factor loadings are identical across groups” (Brown, 2006, p. 267). If configural invariance is established, data collected from each group will decompose into the same factor structure (Meredith, 1993; Meredith & Teresi, 2006). The level of configural invariance is used to assess the overall fit of the baseline model across groups. It indicates two major implications when “generalizing psychological constructs” (Brown, 2006, p. 267). First, it means that respondents in different samples were employing the same underlying frame of the constructs. Second, it confirms that the other more restricted tests of MI may proceed if these tests are nested within the established baseline model (Millsap & Olivera-Aguilar, 2012; Vandenberg & Lance, 2000).
Metric invariance is to confirm that “all factor loadings parameters are equal across groups”; that is, whether “all factor loadings associated with a particular construct are constrained to be equal across groups” (Cheung & Rensvold, 2002, pp. 237–238). The evidence of confirming configural invariance may suggest that samples drawn from different groups indicated their perceptual agreement in underlying factor structure, and the items associated with each construct. Metric invariance provides a more restricted solution of invariance by “introducing the concept of equal metrics or scale intervals” across groups (Steenkamp & Baumgartner, 1998, p. 80). However, participants in different groups may respond to or give different ratings to the measurement items (Chen, 2007). As Bollen (1989) suggested, metric invariance is important as a prerequisite for meaningful cross-group comparison. Statistically, metric invariance can be tested by imposing constraints on the factor loadings to be equal across groups:


Scalar invariance or factorial invariance helps evaluate “the equality of measurement intercepts” (Steenkamp & Baumgartner, 1998, p. 80). In this case, the equal constraints are increased to a more restricted level. If the vectors of item intercepts are invariant, the existence of strong factorial invariance is supported (e.g., Meredith, 1993; Meredith & Teresi, 2006; Mullen, 1995). As a matter of fact, the establishment of factorial invariance is a prerequisite for the comparisons of latent means. The achievement of scalar invariance implies that the measurement scales have the same operational definition across groups, even “scores on that item can still be systematically upward or downward biased” (Steenkamp & Baumgartner, 1998, p. 80). Statistically, scalar invariance is tested by placing equal constraints on item intercepts across groups:

Residual variance invariance is the evaluation of the equality of indicator residuals (Steenkamp & Baumgartner, 1998). Residual variance or unique variance is “the portion of item variance not attributable to the variance of the associated latent variable” (Cheung & Rensvold, 2002, p. 237). It is another restricted solution that can be imposed on the measurement model to assess “if the scale items measure the latent constructs with the same degree of measurement error” (Cheung & Rensvold, 2002, p. 237). This is tested by specifying that:

Equivalence of factor invariance is the evaluation of the factor invariance. The equal constraints are placed to the diagonal elements of the Phi (Φ) matrix across groups to assess whether “the correlations between the latent constructs are invariant” (Steenkamp & Baumgartner, 1998, p. 80):

Equivalence of construct covariance is the evaluation of the equality of factor covariance across groups if more than one latent factor is presented in the measurement model. The test is accomplished by constraining the covariances of factors to be equal across groups:

Invariance of latent means is the evaluation of the equality of latent means (kappa for latent-X; alpha for latent-Y). The test is accomplished by constraining the latent means to be equal across all groups:

Moreover, a “step-up approach” is recommended for multiple-group confirmatory factor analysis (CFA) (Brown, 2006, p. 269). In this procedure, researchers will start the test with the least restricted solution, followed by placing extra constraints at various levels when comparing the model fit in subsequent models (Millsap & Olivera-Aguilar, 2012; Vandenberg & Lance, 2000). To be more specific, the recommended sequence of multiple-groups CFA invariance assessment is as follows: (1) test the CFA model separately in each group; (2) assess the overall fit of all groups by conducting the configural invariance tests; (3) test metric invariance (i.e., the equality of factor loadings); (4) test factorial invariance (scalar invariance); (5) test the residual variance invariance; (6) test the invariance of factor variance and factor covariance; and (7) test the invariance of latent means (see Brown, 2006, pp. 269–270). Moreover, Brown also specified that the above “steps from 1 to 5 are tests of measurement invariance,” which focus on the assessment of the psychometric properties of the measurement scales; and the other two steps (i.e., step 6 and step 7) test “population heterogeneity” (p. 270). In addition, the invariance established in steps 1 to 5 is a prerequisite for the interpretation of steps 6 and 7.
Assessment approach and fit statistics
As explained earlier in the literature, the multiple-group confirmatory factor analysis (CFA) represents the most effective way to test measurement invariance in cross-national research, especially in the context of a complex CFA solution (i.e., the measurement model contains multiple factors and indicators; more than two groups have been involved in the assessment) (e.g., Chen, 2007; Cheung & Rensvold, 1999, 2002; Meredith, 1993; Millsap & Olivera-Aguilar, 2012; Mullen, 1995; Steenkamp & Baumgartner, 1998; Vandenberg & Lance, 2000). As addressed in Steenkamp and Baumgartner’s (1998) research, CFA has a great advantage in examining the equivalence of all measurement and structural parameters of the factor model when multiple groups of samples are recruited.
In addition, a standard way was also recommended by Steenkamp and Baumgartner (1998) to test the invariance of estimated parameters of two or more nested models across groups by using the Chi-square difference tests (Chen, 2007). However, they also raised the warning that Chi-square test itself is sensitive to sample size “for evaluating overall model fit” if the research has unbalanced sample sizes (Steenkamp & Baumgartner, 1998, p. 84). Therefore, other model fit indices should also be considered when evaluating the overall model fit. Some recommended ones include “the root mean square error of approximation (RMSEA), the consistent Akaike information criterion (CAIC), the comparative fit index (CFI), and the nonnormed fit index (NNFI)” (Steenkamp & Baumgartner, 1998, p. 84).
Testing measurement invariance in second-order factor models
As explained in previous section, multi-group confirmatory factor analysis (CFA) has been widely used by different disciplines as the most reliable technique for testing measurement invariance, if continuous variables are designed to measure proposed constructs. As a widely recognized statistical approach, it is not hard to locate research examples in the literature that examine measurement invariance across groups in first-order models with correlated factors (e.g., Brandt et al., 2020; Dong & Dumas, 2020; Eigenhuis et al., 2015; Kim et al., 2003; Marsh, 1994; Marsh & Byrne, 1993; Meredith & Teresi, 2006; Millsap & Everson, 1991; Millsap & Olivera-Aguilar, 2012; Myers et al., 2000; Steenkamp & Baumgartner, 1998). However, we need to expand our knowledge in applying the same measurement invariance tests to second- or higher-order models, and few research efforts have been done (e.g., Bryne & Campbell, 1999; Bryne, 1994; Chen et al., 2005, 2006; Marsh & Hocevar, 1985).
According to Chen et al.’s (2006) research, second-order factor models are potentially more common in research settings in which several related constructs were assessed and each of the constructs has multiple measures. The hypothesis underlying the second-order factor model is that these “lower-order factors are substantially correlated” and “there is a higher-order factor that is hypothesize to account for the relationship among the lower-order factors” (Chen et al., 2006, p. 193). Bagozzi and Edwards (1998) argued that second-order models actually can provide a more parsimonious factor structure and have more implications when the construct is hypothesized to account for variation in all measures, except for measurement error (Bagozzi & Edwards, 1998). In addition, for a higher-order model to be statistically overidentified, it normally requires that four or more first-order factors should be proposed and tested (see Brown, 2006, pp. 325–326) as “the rules of identification used for a typical CFA model readily generalize to higher-order solutions” (Brown, 2006, p. 325). Therefore, when the lower-order factors have been specified as the marker indicators for the higher-order factors, the evaluation of measurement invariance of the lower-order models can be applied to the higher-order solution across groups (e.g., Brown, 2006; Chen et al., 2005).
Research Objective and Hypothesis
Therefore, inspired by the argument that it is important to evaluate measurement invariance in “psychometric development” (Brown, 2006, p. 267) in multiple sample research, research procedure presented in this study uses the construct of leadership excellence in corporate communications and its dimensions established in the previous research (e.g., Meng, 2012, 2014; Meng et al., 2011; Meng & Berger, 2013, 2019, 2021) and extends the measures to a multi-group testing environment. The major research objective is to test whether the same construct and relevant measurement model hold the same meaning across different populations. Thus, one major hypothesis is developed to guide the measurement invariance evaluation of the leadership excellence construct across three samples:
Method
An Empirical Illustration of Multi-Group Comparison
Thus, to test the major hypothesis, an empirical illustration of the assessment of MI of the construct of leadership excellence in corporate communications is addressed in the study. The illustration is based on data sets derived from previous research (Meng, 2012, 2014; Meng & Berger, 2013, 2019), which proposes the theoretical conceptualization of the construct of leadership excellence and its related dimensions in corporate communications. A higher-order measurement model of leadership excellence in corporate communications was tested and established (Meng, 2012, 2014; Meng & Berger, 2013, 2019). As depicted in Figure 1, the higher-order measurement model of leadership excellence consists of six crucial dimensions, which are “self-dynamics, team collaboration, ethical orientation, relationship building, strategic decision-making capability, and communication knowledge management capability” (Meng & Berger, 2013, p. 144). As mentioned earlier, the purpose of this study is to validate of the second-order measurement model of leadership excellence in corporate communications by applying a series of measurement invariance tests. In addition, by presenting testing procedures and statistical analyses to address measurement invariance in leadership excellence, the present research aims at introducing the method of testing measurement invariance of latent variable models in corporate communications research.

The second-order measurement model of leadership excellence in corporate communications.
In this research, the leadership excellence construct (a second-order factor) and its six dimensions (lower-order factors) are used. Due to the strong managerial relevance and theoretical implications of interdisciplinary research on corporate communications (van Riel, 1997), assessing measurement invariance of multi-attribute models with latent variables can extend our understanding of these constructs, especially when research in this area remains limited and needed. Due to limited space in this article, the perceptual measures of the leadership excellence and its dimensions are not listed but can be provided upon reasonable request. Readers can also refer to previous research done by the author and associates’ research (e.g., Meng, 2012, 2014; Meng & Berger, 2013, 2019) to obtain a full list of the measures for the conceptual model.
Overall, the analysis presented in this study follows Brown’s (2006) suggested “step-up approach” (p. 269) to invariance evaluation: (1) test the CFA model in each recruited sample; (2) assess the psychometric properties of the measurement model (i.e., configural invariance, metric invariance, scalar invariance, residual variance invariance); and (3) evaluate the equality of factor variances and latent means at the construct level (population heterogeneity) (see Brown, 2006, pp. 269–270).
Sample Profiles for Three Corresponding Groups
Derived data sets from the author and associates’ previous research (Meng, 2012, 2014; Meng & Berger, 2013, 2019) include three different corresponding groups: a group of senior communication executives/leaders in the U.S. (the Primary Group), a regional group of mid-level communication professionals from the Southern Public Relations Federation (the SPRF Group; sprf.org), and a group of senior college students majoring in public relations (the Student Group). The sample sizes were 222, 164, and 226 for the three corresponding groups respectively. All three groups were convenient samples recruited through national, regional, local communication professional associations, or communication/public relations programs in several public universities in the Southeastern region. Due to the limited sample sizes and the requirements for parameter estimates in the CFA approach, the researcher could not use a random procedure to split each sample group nor obtain equal sizes cross groups.
To be more specific, the first group (the Primary Group) includes 222 senior executives in the field of corporate communications. More than half of them have more than 15 years of experience in public relations and communication (76.58%). The sample has more women (59.9%) than men (40.1%). Respondent also reported working in various types of organizations, including public corporations (37.40%), private companies (19.40%), or communication agencies (17.60%). The majority in this sample group are white professionals (89.2%), followed by 3.6% African Americans and 3.6% Latinos/Hispanics.
The second sample group were recruited based on the membership directory of the Southern Public Relations Federation (SPRF). The Southern Public Relations Federation is “a network of public relations professionals from Alabama, north Florida, Louisiana, and Mississippi who share a common interest in the public relations profession” (SPRF, 2021). The SPRF sample consisted of 164 respondents. This sample group has more female respondents (78.66%) than males (21.34%). The majority are whites (91%), followed by a small group of African Americans (less than 10%). Years of experience varied within the group: 35% of communication professionals in this group reported having more than 15 years of experience, followed by 27% between 5 and 10 years of professional experience.
For the third corresponding group, the Student Group, the total sample size was 226 students majoring in communication and/or public relations from two large public universities in the Southeastern region. The majority of students in this group are women (80.5%). For ethnic backgrounds, the majority are whites (91.2%). Minority groups include African Americans (4.9%), Asians (2.2%), and Latinos/Hispanics (1.8%). Based on self-reported data, 72.1% of the students were seniors and the rest of the sample were juniors (27.9%). As for educational background, the majority of the sample major in public relations (81.4%), followed by 12.4% in communication major (12.4%) and other majors such as marketing, management, and public administration (6.2%). Most students (75.2%) indicated having had some experiences in public relations practice through internships, course projects, and/or student organization activities.
Reliability Check and Profile Analysis
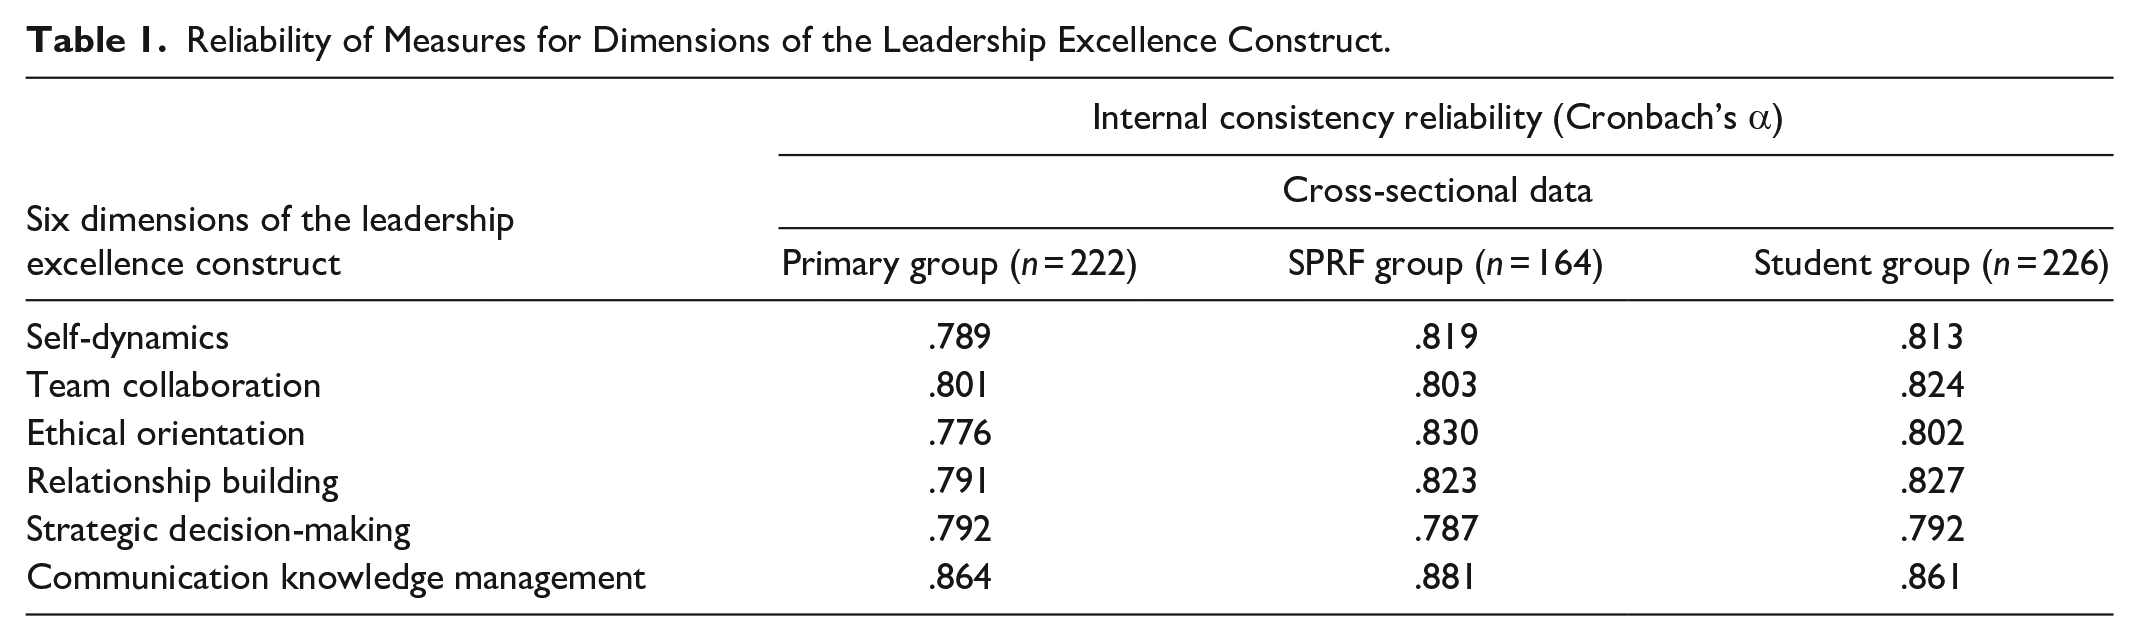
First, the researcher checked the internal consistency reliability of the constructs. The results indicated strong reliabilities on six dimensions of the leadership excellence construct across three corresponding groups: Cronbach’s alpha values ranged from .78 to .86 for the Primary group, .79 to .88 for the SPRF group, and .79 to .86 for the Student group (see Table 1 for detailed results). Before proceeding with measurement invariance tests, a profile analysis was conducted as suggested by Morris and Pavett (1992) as an additional check for response set bias. According to Morris and Pavett (1992), the means for each measure of a construct are graphed and connected to test whether the lines are parallel across groups. They further suggested that a lack of parallelism indicates that the differences among the data sets are not caused by systematic response bias. In this case, the graphic presentation of the six constructs among three groups did show a lack of parallelism, which help eliminate any potential systematic response bias (see Figure 2).
Reliability of Measures for Dimensions of the Leadership Excellence Construct.

Profile analysis of the leadership excellence construct and six dimensions across three groups.
Therefore, the researcher continued the measurement invariance tests by using the rigorous stepwise sequence of multiple-group CFA on the higher-order measurement model of leadership excellence in corporate communications. Correlation matrices (see Appendix A) for the three corresponding groups were used as input for analyzing measurement invariance by using LISREL 8.8.
Results
Measurement Invariance Evaluation for the Second-Order Measurement Model
As suggested, testing the measurement model separately in each group is necessary as the first step before proceeding to gradually restricted measurement invariance tests. Thus, the researcher tested the leadership excellence model separately in three groups first and the results confirmed that the model fit the data well across all three groups. As presented in Figure 1, the selected model fit indices for the Primary group showed that χ2 (71) = 156.26 (p < .01). Other model fit indices (e.g., NFI = .97, NNFI = .98, CFI = .98, SRMR = .04, RMSEA = .07) also confirmed a strong fit.
The model fit indices for the second sample (i.e., the SPRF group) also confirmed a strong fit: χ2 (71) = 139.82 (p < .01), NFI = .97, NNFI = .98, CFI = .99, SRMR = .04, RMSEA = .07. The completely standardized solution for the model also indicated high loadings on the lower-order factors, ranging from .70 to .94. Each of the first-order factors (the six dimensions) loaded strongly onto the second-order factor (leadership excellence in corporate communication), ranging from .77 to .97.
The model fit indices for the third sample (i.e., the student group) also confirmed a strong fit: χ2 (71) = 158.69 (p < .01), NFI = .96, NNFI = .98, CFI = .98, SRMR = .05, RMSEA = .08. The standardized factor loadings for lower-order factors ranged from .52 to .96. In addition, as predicted, lower-order factors also demonstrated a strong load on the higher-order factor, ranging from .52 to .96. Such consistent results from all three samples ensured the fit of the measurement model as proposed. Thus, the following measurement invariance tests with restricted solutions can be conducted.
Configural invariance assessment
To confirm the identical factor structure, configural invariance test was applied first. By placing the equal constraint to the factor structure across three samples, the results presented a satisfied fit: χ2 (213) = 406.23 (p < .01), NFI = .97, NNFI = .98, CFI = .98, SRMR = .05, RMSEA = .07. Each group of sample presented a similar percentage of contribution to the identical factor structure: 38.82% from the Primary group (χ2 = 157.71), 34.42% from the SPRF group (χ2 = 138.82), and 26.76% from the student group (χ2 = 108.69). Therefore, the level of configural invariance was achieved.
Metric invariance assessment
To confirm metric invariance, equal constraints were placed at the level of factor loadings for both lower-order and higher-order factors in order to test whether the measures of leadership excellence in corporate communications hold the same meaning to senior communication executives, mid-level communication practitioners, and future communication practitioners (e.g., senior college students majoring in communication). The evaluation of the metric invariance helps establish leadership excellence as a universal construct in corporate communications.
The results of the multiple-groups CFA with equal factor loading constraints presented an overall good fit to the data with χ2 (241) = 452.50 (p < .01). Some other model fit indices also presented a strong value (e.g., NFI = .96, NNFI = .98, CFI = .98, SRMR = .10, RMSEA = .07). The nested Chi-square difference test indicated that Δχ2 (28) = 46.28 (p > .01). Therefore, the level of metric invariance is achieved. Thus, it is confident to say that the factor loadings of all indicators to the construct of leadership excellence in corporate communications hold equivalent meanings to respondents in three different samples.
Scalar invariance assessment
To test scalar invariance, which is the “equality of measurement intercepts” (Steenkamp & Baumgartner, 1998, p. 80), the constraints were imposed at the level of model intercepts. Similarly, the Chi-square difference tests were used to inspect the results, which showed that the equal intercepts model did not result in a significant degradation of model fit: Δχ2 = 44.88, Δdf = 26, p > .01. Thus, it is confirmed that the level of scalar invariance was achieved.
Factor variance assessment
Since the levels of metric and scalar invariance were achieved, it is safe to proceed with the tests of factor variances, factor covariances, and the latent factor means. To test factor variance, an equal constraint was imposed to the diagonal numbers of Φ matrix (factor variances). However, the results yielded a poor fit to the model: χ2 (269) = 515.48 (p < .01), NFI = .96, NNFI = .98, CFI = .98, SRMR = .12, RMSEA = .08. Results from the Chi-square difference test (Δχ2 = 17.09, Δdf = 2, p < .01) indicated that the invariance of factor variances was not achieved, especially with SRMR larger than .10. It is also interesting to observe that the second group (i.e., the SPRF group) was using a relatively narrower range of the construct continuum (0.85–0.96) to assess the factor indicators, if compared to the Primary group (ranging from 1.02 to 1.07) and the student group (ranging from 0.96 to 1.21). Table 2 displays the detailed results.
Factor Covariances (Diagonal Elements of the Covariance Matrix of Eta and Ksi).

Assessment of latent factor means
Since the invariance of factor variances was not achieved, there’s no need to compare the invariance of the factor covariances. However, the confirmation of metric and scalar invariance allows the study to further evaluate the invariance of latent factor means. To do so, an equal constraint was placed on latent means. However, the model fit indices did not support the invariance of latent factor means [χ2 = 581.70 (df = 285, p < .01)]. Some other selected model fit indices included NFI = .95, NNFI = .98, CFI = .98, SRMR = .12, RMSEA = .08. With the value of SRMR exceeded .10, it indicated some possible misspecifications of factor covariances. To compare the results from different measurement invariance tests applied in this study, a summary of key model fit indices were compiled in Table 3.
Tests of Measurement Invariance of the Second-Order Measurement Model of Leadership Excellence Across Three Groups.

As mentioned earlier, the Primary group was used as the reference group when running invariance tests at all levels. Therefore, when comparing the latent factor means, the researcher found that respondents in the student group indicated relatively smaller values in latent means (e.g., ranging from −0.22 to −0.10). At the same time, respondents in the SPRF group presented relatively higher values (e.g., ranging from 0.09 to 0.25). In addition, the SPRF group presented the highest values on several factors, including communication knowledge management (0.248) and ethical orientation (0.168) as listed in Table 4. It may further reveal the needs from this group of public relations practitioners in acquiring specific communication knowledge and ethical guidelines for effective practice.
Latent Means by Using the Primary Group as the Reference Group.

Note: SD = self-dynamics; TC = team collaboration; EO = ethical orientation; RB = relationship building; DM = strategic decision-making capability; CM = communication knowledge management capability.
Summary
The empirical example of the MI tests presented in this study illustrates several key points. First, for interdisciplinary research in corporate communications, it illustrates how researchers can and should apply more rigorous assessment of measurement invariance prior to conducting cross-group comparisons when latent variable models are proposed. As noted earlier, the establishment of solid psychometric properties (e.g., internal consistency, profile analysis) is important but may not be sufficient in determining whether “psychological measures apply equivalently across groups” (Steenkamp & Baumgartner, 1998, p. 80). Second, the illustrated example presented in this study makes a major contribution to the theoretical development of a complex construct—leadership excellence in corporate communications—and illustrates an advanced approach of how the tests of MI can be used to detect the universality of the measurement scale. Finally, research presented in this paper used the widely accepted “step-up approach” in evaluating measurement invariance (Brown, 2006, p. 269) of the leadership excellence construct and its dimensions. The results indicated different degree of measurement invariance across three groups, which can lead future research to investigate managerial implications in practice. In short, the proposed hypothesis was supported by the findings. Table 5 presents the overall model parameters’ estimates at both lower- and higher-levels of the construct model when the Primary group was used as the reference group.
Common Metric Completely Standardized Solution for the Higher-Order Measurement Model of the Leadership Excellence Construct Across Three Groups (N = 612).

Note. S11-V12 are composite indicators for construct of self-dynamics (SD); T11 and T12 are composite indicators for construct of team collaboration (TC); E11 and E12 are composite indicators for ethical orientation (EO); R11 and R12 are composite indicators for relationship building (RB); D11 and D12 are composite indicators for strategic decision making (DM); C11 and C12 are composite indicators for communication knowledge management (CM).
Discussion and Implications
This article demonstrates the statistical approaches of using multiple-group CFA in assessing measurement invariance in corporate communications research when latent variable models are proposed. As argued earlier, the importance of measurement invariance shall be emphasized in multi-sample comparative studies to establish the validity of the measurement scales. Specifically, the latent construct of excellent leadership and its measurement model were applied in this article to demonstrate the testing procedure by using three corresponding samples. The author applied invariance constraints at multiple levels and in a sequential series of tests to evaluate the second-order measurement model of leadership excellence in corporate communications. The findings echo the procedures of previous measurement invariance research on latent variable models and indicate the importance of validating accuracy in measurement in corporate communications research.
Results confirmed in this article revealed several important theoretical and methodological contributions. As we know that leadership is a broad and complex construct relevant to different areas of organizational and managerial behaviors. Of the many types of leadership styles and skills, leadership excellence in corporate communications has not been fully analyzed. Despite the importance of conceptualizing and measuring leadership excellence in corporate communications, we find few works that propose and validate measurement scales in the literature (Meng, 2014; Meng & Berger, 2013). Thus, results presented in this article further support the theory construction efforts in corporate communication by confirming the multidimensional nature of the construct of excellent leadership.
More importantly, the multi-group analyses confirmed the validity of both factor latent structure and latent variables as proposed in the higher-order measurement model. Such results allow us to apply effective leadership evaluation performed in corporate communications practice. Practitioners should test the level of excellent leadership in their communication unit and take internal evaluations according to what is achieved versus what could be improved, considering the different dimensions of leadership excellence in corporate communications. These internal evaluations may involve proposing and developing additional or alternative training opportunities to further enrich leadership knowledge, skills, and practice. In addition, the validation of a measurement scale across multiple samples allows communication leaders to purposively emphasize different dimensions while simultaneously taking other contextual variables into account when measuring leadership effectiveness. The measurement model itself can be further developed into a benchmarking process in leadership evaluation, due to its multidimensional nature in practice.
From a methodological perspective, via a series of measurement invariance analyses, results presented in this study emphasize the importance of using a statistical approach to detect potential measurement bias in latent variable models. The procedure presented in this article did not only follow the recommended stepwise sequence for assessing measurement invariance, but also extended the statistical approach by allowing adding constraints to three unbalanced samples. Assessing the applicability of the measurement model of leadership excellence to different groups is an important methodological procedure in confirming the generalizability and universality of the construct of leadership excellence in corporate communications.
Additionally, in light of the methodological contributions presented above, it is necessary to mention that the tests illustrated here are examples of omnibus tests of whether a given level of invariance is fully satisfied or not. It is not surprising to find full measurement invariance may not hold at every level of analysis. Thus, the possibility of partial measurement invariance shall be investigated in future research. For example, special attention can be addressed at the level of partial measurement invariance. Since partial measurement invariance is not a widely applied methodological concept in corporate communications research, more attention is needed. Researchers in interdisciplinary research have argued that partial measurement invariance is likely to be “the typical case in most practical applications” (Millsap, 2011, p. 6). It further suggests that valid cross-group or cross-national comparison still can be conducted even when the status of full invariance cannot be achieved.
Finally, results presented in this article also offer practical implications. It is evident that leadership excellence in corporate communications is a multidimensional construct. It requires the development of leadership knowledge and skills at individual, team, and strategic levels. Given the strong theoretical foundation of the excellent leadership construct, it will benefit communication managers and executives of various organizations who wish to develop and demonstrate leadership excellence adopting and applying those established leadership dimensions consistently. Such evidence can also be used as central principles when developing corresponding leadership training and development modules by organizations in supporting multicultural and multi-group sensitivity in leadership development.
To summarize, the statistical approach presented in this article aims at enriching the understanding of measurement invariance when applying multi-group comparison in corporate communications research. Despite repeated calls to report measurement invariance assessment in interdisciplinary and international research using a survey method, the research efforts presented in the article also call for establishing methodological standards for all cross-group empirical research in corporate communications. Although limited reports of measurement invariance are available in the literature of corporate communications, the author believes that the assessment of measurement invariance would increase popularity and confidence when latent variable models are proposed and tested in corporate communications research.
Limitations and Future Research
Despite the rich findings, the researcher full admits the critical need in the near future to expand our knowledge on measurement invariance from a multidisciplinary perspective. Several limitations embedded in this study may constitute venues for future research on related topics. First, the analysis adopted in this study focused exclusively on samples of communication professionals in the United States. Although various levels of professional experience have been taken into consideration when designing the multi-group testing, it certainly limits the degree of generability of results and their application scope at the international level. To this end, future research could benefit in expanding this study and the testing procedures to the field of corporate communications in other societies and cultures, including some cross-cultural comparison to integrate cultural determinants to leadership excellence.
Secondly, the analysis and procedure conducted in this study can be further investigated and deepened by using other research methods such as in-depth interviews and case studies to capture the deep understanding of achieving leadership excellence in corporate communications practice. Insights from senior executives and expectations from junior communication professionals will provide a complementary picture to what has been tested in the measurement model from a qualitative perspective.
As revealed in the results, measurement invariance have achieved at different levels. Specifically, the model satisfied the requirement of configural invariance, metric invariance, scalar invariance in that all six factors and associated measure items were appropriate to represent the leadership excellence construct. However, the measurement invariance of error term was not supported in this case. Further tests (i.e., applying partial measurement invariance to relax invariance constraints to certain items) should be conducted to test the underlying reasons in future research.
As reviewed in the literature, unbalanced sample size could be a major threat to measurement invariance test itself. Although multiple-group CFA has been identified and suggested as a quality diagnostic tool for evaluating measurement equivalence, future research should strive to recruit balanced sample size in order to conduct measurement invariance tests more successfully (e.g., Bagozzi & Yi, 1989; Bollen, 1989; Chen, 2007). As another limitation of this study, this study used unbalanced sample sizes in a series of measurement invariance tests. To avoid potential sample-size-related risks, future research can be designed to enlarge the sample size to generate adequate observations to match the number of parameters in defined model.
Lastly, future research could benefit from the inclusion of other elements related to leadership excellence, such as followers’ motivation, organizational climate, among others, to link the functions and activities of leadership to performance assessment. In short, the detailed illustration provided in this study will help researchers who are interested in corporate communications, communication management, and multiple sample research to follow. Use of the statistical procedure can definitely increase the rigor of multiple-sample quantitative research in corporate communications.
Supplemental Material
sj-docx-1-sgo-10.1177_21582440211061375 – Supplemental material for Leadership Excellence in Corporate Communications: A Multi-Group Test of Measurement Invariance
Supplemental material, sj-docx-1-sgo-10.1177_21582440211061375 for Leadership Excellence in Corporate Communications: A Multi-Group Test of Measurement Invariance by Juan Meng in SAGE Open
Footnotes
Appendix
The Student Group: Correlation Matrix, Means (M), and Standard Deviations (SD).

| S11 | S12 | V11 | V12 | T11 | T12 | E11 | E12 | R11 | R12 | D11 | D12 | C11 | C12 | |
|---|---|---|---|---|---|---|---|---|---|---|---|---|---|---|
| S11 | 1.00 | |||||||||||||
| S12 | .62 | 1.00 | ||||||||||||
| V11 | .66 | .59 | 1.00 | |||||||||||
| V12 | .65 | .60 | .76 | 1.00 | ||||||||||
| T11 | .60 | .55 | .63 | .58 | 1.00 | |||||||||
| T12 | .63 | .59 | .68 | .63 | .72 | 1.00 | ||||||||
| E11 | .58 | .42 | .60 | .59 | .58 | .59 | 1.00 | |||||||
| E12 | .56 | .53 | .59 | .63 | .60 | .63 | .79 | 1.00 | ||||||
| R11 | .56 | .53 | .68 | .68 | .59 | .66 | .58 | .65 | 1.00 | |||||
| R12 | .59 | .62 | .67 | .67 | .64 | .73 | .63 | .70 | .77 | 1.00 | ||||
| D11 | .49 | .48 | .58 | .54 | .47 | .54 | .54 | .56 | .56 | .57 | 1.00 | |||
| D12 | .54 | .52 | .63 | .61 | .51 | .62 | .58 | .56 | .60 | .63 | .78 | 1.00 | ||
| C11 | .56 | .54 | .67 | .65 | .54 | .65 | .63 | .63 | .72 | .75 | .60 | .70 | 1.00 | |
| C12 | .56 | .54 | .58 | .58 | .53 | .60 | .50 | .59 | .63 | .67 | .53 | .61 | .78 | 1.00 |
| M | 6.38 | 6.02 | 6.21 | 6.10 | 6.12 | 6.26 | 6.46 | 6.34 | 6.37 | 6.22 | 6.31 | 6.26 | 6.37 | 6.26 |
| SD | 0.70 | 0.71 | 0.73 | 0.71 | 0.95 | 0.72 | 0.68 | 0.73 | 0.62 | 0.64 | 0.74 | 0.77 | 0.61 | 0.69 |
Acknowledgements
The author would like thank The Plank Center for Leadership in Public Relations and Heyman Associates for actively supporting leadership research in public relations and communication management.
Declaration of Conflicting Interests
The author declared no potential conflicts of interest with respect to the research, authorship, and/or publication of this article.
Funding
The author received no financial support for the research, authorship, and/or publication of this article.
Ethic Statements
The protocol of this study was approved by the Institutional Review Board at the Office of Research Compliance at the University of Alabama (IRB Project #: EX-08-CM-002) and by the Institutional Review Board at the Office of the Vice President for Research at the University of Georgia (IRB ID: STUDY00001472). Since the data collection was conducted and finished via an online survey, the consent was obtained from the participants after they read the consent statement and clicked the “agree and next page” button on the first page of the online survey.
References
Supplementary Material
Please find the following supplemental material available below.
For Open Access articles published under a Creative Commons License, all supplemental material carries the same license as the article it is associated with.
For non-Open Access articles published, all supplemental material carries a non-exclusive license, and permission requests for re-use of supplemental material or any part of supplemental material shall be sent directly to the copyright owner as specified in the copyright notice associated with the article.