
Abstract
COVID-19 has caused psychological trauma. However, it is unclear whether these stresses are comparable across ethnicities, across age groups, and vaccination hesitancy. Moreover, the relationship between the different types of stresses and their relationship to vaccination hesitancy has not been studied. Using rigorous statistical methodology (structural equation modeling), we examined the measurement invariance of five COVID stress factors: danger of contamination, socioeconomic consequences, xenophobia, traumatic stress, compulsive checking, by ethnicity and age, and investigated their relationship to vaccination hesitancy, ethnicity, age, and expectations of contracting COVID using structural equation models on a UK sample. The instrument showed measurement invariance both with respect to ethnicity and vaccination hesitancy. Subjects with more stress and worry about contracting COVID had no more enthusiasm for getting vaccinated than the less stressed. Ethnic minorities were less stressed despite suffering higher morbidity and mortality. As age increases, so does the hesitancy to be vaccinated despite younger subjects reporting more compulsive checking. Vaccination hesitancy was related to fear of side effects and safety concerns. Public health campaigns should target younger populations to address their fears about and stress due to compulsive checking for COVID-19. These campaigns should also be designed to reduce vaccination hesitancy to increase vaccination rates, decrease active and passive carriers of the virus, and ultimately attain herd immunity.
Keywords
Introduction
Coronavirus-2019 (COVID-19) has infected a total of ∼760 million individuals worldwide to-date (World Health Organization, 2020). The virus’s impact includes at least ∼6.87 million deaths and an unknown number of victims who will develop long-term symptoms (Cortinovis et al., 2021). The pandemic has also become a universal stressor (Cooke et al., 2020; Shevlin et al, 2020), with fear of contamination, fear of spreading the disease to loved ones (Shigemura et al., 2020; Taylor et al., 2020), excessive psychological (Alimoradi, Lin et al., 2022; Alimoradi, Ohayon et al., 2022; Brooke & Jackson, 2020; Hasannia et al., 2021; Olashore et al., 2021; Sandya et al., 2022) and physical stress (Taylor et al., 2020), mental distress (Park et al., 2020; Wang et al., 2020), social stigma (Patel et al., 2021; Sangma et al., 2022), and post-traumatic stress affecting the global population. Although Taylor et al. (2020) devised the COVID stress scale (CSS), only preliminary analysis was conducted to evaluate its validity. Thibault et al. (2022) investigated the different types of invariance of the CSS and found that the CSS showed configural and metric invariances but not scalar invariance between first and second year undergraduate students. However, what is of interest is whether these stress factors are comparable across different ethnic groups and age groups. This is because, just in the United States, ethnic minorities have had disproportionate rates of death, infection, and hospitalization; although the reasons for disproportionate rates are still being investigated (DeSimone, 2022; Geno Tai et al., 2021). It is important, therefore, to understand how ethnic minorities have been stressed due to COVID-19 and compare against their White counterparts. Therefore, the CSS needs to be validated for different ethnic groups using a psychometrically sound technique such as measurement invariance. Only after establishing measurement invariance by ethnicity can we make valid comparisons of COVID stress factors across different ethnicities.
In 2021, infections were highest in the 18 to 29 years age group (Statista, 2021). It is unclear why this age group has higher rate of infection than their elders and whether this affects their COVID stress factors. Therefore, different types of COVID stress can be compared for different age groups only after establishing measurement invariance by age group. Additionally, no study has conclusively shown through structural equation modeling the extent to which younger populations show COVID-related stress. Therefore, it is also necessary to understand how stressors vary by age.
A major preventative/attenuation measure against COVID-19 infection is vaccination. Before the vaccines were available, the reasons for vaccination hesitancy included fear related to side effects, efficacy, not wanting to be one of the first to get the vaccine, lack of adequate testing, need for additional information, lack of trust, and cost (Fisher et al., 2020). Misconceptions and fears about these vaccines remain barriers to their universal uptake (Fisher et al., 2020). Indeed, by the end of 2021, only 57.3% of the world population had received at least one dose and just 48.3% had received both doses of the vaccine; these numbers were 70.8% and 65% at the end of 2022 (World Health Organization, 2020). Although in general COVID vaccination acceptance has increased with time (e.g., Kukreti et al., 2022), many news reports have shown that individuals from some ethnic minority communities remain more hesitant to receive COVID vaccines despite experiencing higher rates of severe disease and death. In fact, vaccination rates are disproportionately low amongst ethnic minorities (HHS, 2021). Additionally, in the United States vaccine acceptance has been shown to be lower in Black/African Americans (Yasmin et al., 2021). A report by the NHS England and NHS Improvement—South East (2021) shows that Black people show most vaccination hesitancy in the UK. In contrast, in the United States, White people show more vaccination hesitancy than Asians, Blacks, and Hispanics (CDC, 2021). In fact, there were concerns that the Joint Committee on Vaccination and Immunisation (JCVI) had not considered ethnic minority status as a top priority issue as related to vaccination (Hanif et al., 2020; Martin et al., 2021; Razai et al., 2021; Robinson et al., 2021; Royal Society for Public Health, 2020; The OpenSAFELY Collaborative, 2021; Vizard, 2021). Younger populations have been reported to show more vaccination hesitancy than older populations. Therefore, it is necessary to investigate the incidence of vaccination hesitancy and the reasons for vaccination hesitancy amongst different age and ethnic groups. By extension, it is also necessary to investigate whether COVID stress factors are comparable across vaccination hesitancy, that is, those who are willing to be vaccinated and those who are not. Investigating this would help us understand whether any of these stress factors might be a reason for vaccination hesitancy.
Problem Statement
The COVID stress scale (CSS) was originally administered to 3,479 people in Canada and 3,375 people in the United States in 2020 (Taylor et al., 2020). The five factors include danger of contamination (DC, fear of being infected by contaminated objects or surfaces), socioeconomic consequences (SC, fear of grocery stores and pharmacies running out of stock), xenophobia (X, fear of foreigners who might be carrying infection), traumatic stress (TS, nightmares and intrusive thoughts), and compulsive checking (CC, seeking reassurance regarding pandemic-related threats). However, more analyses of the scale need to be conducted to evaluate its validity and the relationship between the factors. By validity, we are referring to whether COVID stress factors as measured by the CSS are comparable across age groups, across ethnicity, and vaccination hesitancy. Unfortunately, Taylor et al.’s CFA models had less than excellent fit; specifically, the comparative fit index (CFI) was between 0.92 and 0.93 whereas L. T. Hu and Bentler (1998) recommend a CFI value of at least 0.95 for excellent model fit. Secondly, although Taylor et al. (2020) corrected for non-normality of the data using robust maximum likelihood, they did not correct for the ordinal nature of the data. This can lead to inaccurate model parameters and eventually incorrect decisions about the model. Finally, the measurement invariance of the factors must be evaluated before group comparisons of factor means (i.e., average COVID stress factors) can be tested. Although Thibault et al. (2022) conducted measurement invariance, this was done for a college sample between first- and second-year undergraduate students. Unless there is a dramatic difference in how the students were admitted, these groups are reasonably comparable. What we really need is to know if the instrument functions well for people from different demographic groups such as by age groups, ethnicity, and vaccination hesitancy. Only after establishing measurement invariance by these variables shall the factors be rendered comparable across groups. Thus, more analyses are warranted before the instrument can be adapted for wider use. Once these equivalences are established it is necessary to understand how vaccination hesitancy, ethnicity, age, and COVID stress factors are related.
Purpose of the Study
The purposes of this study are: (a) to examine the measurement properties of CSS—specifically investigate if measurement invariance exists by ethnicity, age group, and vaccination hesitancy using multigroup confirmatory factor analysis; (b) to fit a structural equation model with the following relationships: how ethnicity predicts vaccination hesitancy, how ethnicity and age predict stress factors (model C, Figure 1a); (c) to fit a structural equation model on the data where the respondents indicated least to most likely to get COVID with the following relationships: whether fear of the likelihood of getting COVID predicts COVID stress factors, and whether fear of the likelihood of getting COVID predicts vaccination hesitancy (model D, Figure 1b); and (d) to identify the major reasons for being vaccination-hesitant across ethnic minorities and ethnic Whites and the younger generations descriptively.

(a) Structural model (Model C) and (b) structural model (Model D).
Material and Methods
Surveys
We administered the 36-item COVID stress scale (CSS) questionnaire that was measured on a 5-point scale (1—not at all, 5—extremely) to assess the various stress factors. Additionally, we administered the following questions related to vaccine uptake and perceptions.
Vaccination willingness/hesitancy: “As a vaccine for the coronavirus is now available, will you get vaccinated? Yes, no, not sure.”
Reasons for vaccination hesitancy: “If you answered ‘no’ or ‘not sure’ please select all applicable reasons: a. I am concerned about potential side effects b. I think COVID-19 vaccine may not be safe c. The best way is to let nature take its course d. I do not think that COVID-19 is dangerous to my health e. I am afraid of injections f. I believe in natural or traditional remedies g. I am against vaccination in general h. Religious reasons.”
Perceptions of likelihood of getting COVID: “What is your best guess as to whether you will get the coronavirus within the next 6 months? 1—least likely, 2—somewhat likely, 3—most likely, 4—I already had the coronavirus, 5—Even if I get the virus, I am a healthy young person.”
Thus, the questions covered demographics, vaccination willingness/hesitancy, reasons for vaccination hesitancy and perceptions of the likelihood of getting COVID.
Ethics and Data Collection
This study was ethically approved by the [redacted] University Department of Life Sciences Research Ethics Committee. Respondents were recruited via the researchers’ social media platforms, such as Instagram, snapchat, and WhatsApp; as well as via the university’s intranet system. The survey was administered via Qualtrics. The respondents were not involved in the design, conduct, reporting, or dissemination of the research. However, the respondents of the survey were given the researchers’ email addresses if they wanted to know the results of the study. Anyone over the age of 18 was included in the sample. There were no other exclusion criteria except age.
Sample
The Qualtrics link to the survey was clicked 712 unique times. However, 218 of these were empty. These were deleted resulting in a sample size of 494. The rest of the dataset did not contain missing information on any of the variables used in the present study. Demographic information is given in Table 1. All the respondents were from Western Europe where non-Whites are ethnic minorities. Therefore, non-White respondents were defined as ethnic minorities for the purpose of this study. Boomsma (1982, 1985) suggested a sample size of 100 or 200 for simple SEM analyses while Bentler and Chou (1987) suggested 5 to 10 observations per estimated parameter. Therefore, the sample size was deemed adequate for this analysis.
Demographics.
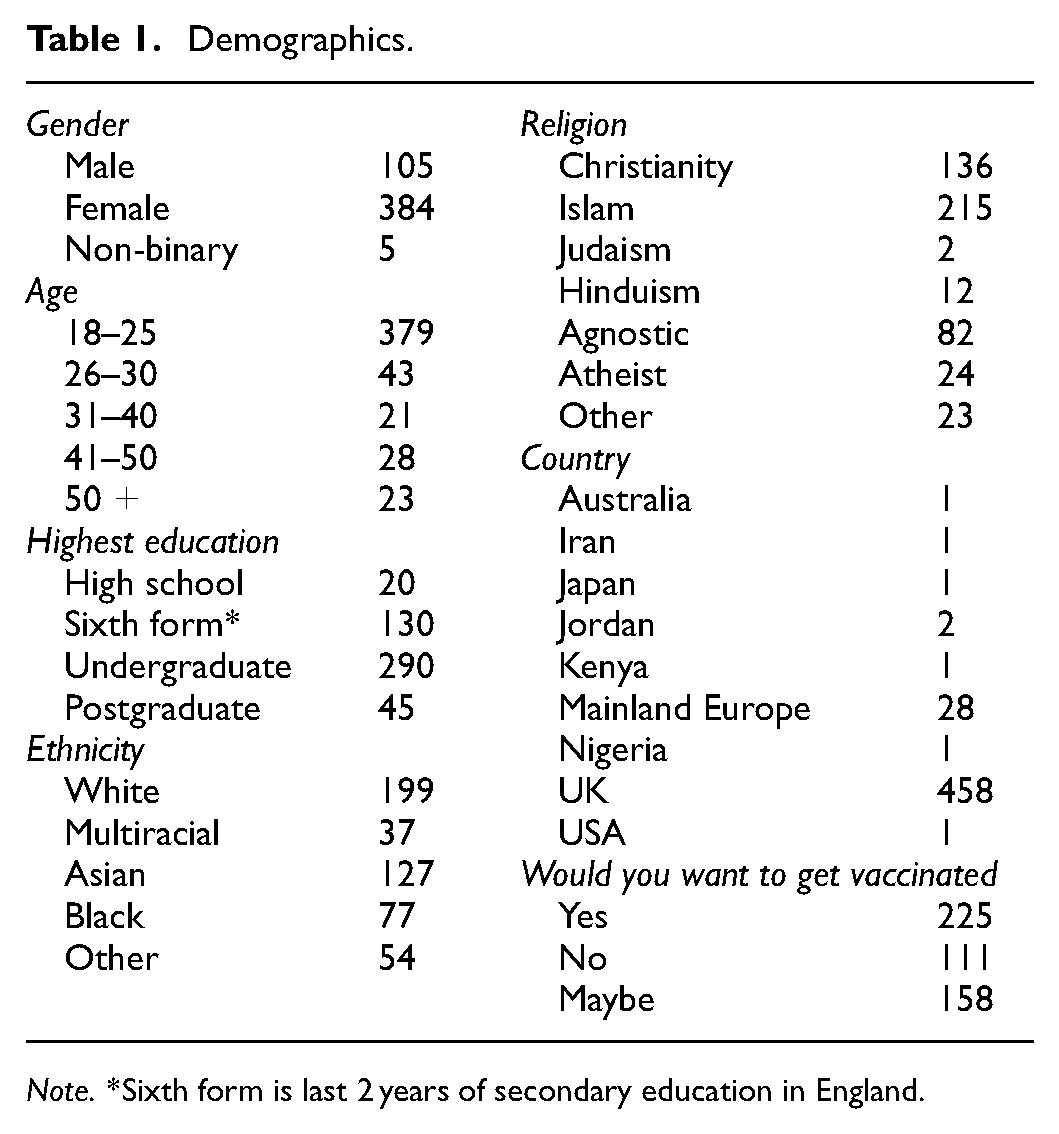
Note. *Sixth form is last 2 years of secondary education in England.
Analyses
Confirmatory and multigroup confirmatory factor analytic (CFA) models were fitted to the data in its entirety and to subsamples by ethnicity and vaccination hesitancy. Due to the sample size of individual ethnic groups being inadequate for a measurement invariance analysis, we combined all ethnic minorities into one group which yielded a sample size of 295 while the ethnic Whites group had 199 respondents. 225 respondents wanted to be vaccinated and 269 were unsure or did not want to be vaccinated. These group sizes were deemed adequate for the analysis. Measurement invariance by age group could not be tested because there were 379 respondents below the age of 26 and 115 above 25. The sample size was inadequate to fit the CFA for the group of respondents above the age of 25.
Because the data were ordinal, weighted least squares means and variances (WLSMV) estimator was used to fit the models in the R package lavaan (Rosseel, 2012). Model retention decisions were based on conventional guidelines (L. T. Hu & Bentler, 1998) such as comparative fit index (CFI), root mean square error of approximation (RMSEA), and standardized root mean squared residual (SRMR) estimates. CFI ≥ 0.95, RMSEA ≤ 0.05, and SRMR ≤ 0.08 indicated excellent fit; CFI ≥ 0.90 and RMSEA ≤ 0.08 indicated good fit. Model A was the five-factor model originally proposed in the CSS scale. The items that belong to this model are given in Table 2. The five factors are xenophobia, socioeconomic consequences, compulsive checking, danger of contamination, and traumatic stress. The errors of the items were not allowed to correlate in this model. The factors were allowed to correlate. Model B is a three-factor model that was retained following model modifications done to confirmatory factor analysis by discarding socioeconomic consequences and xenophobia. Model C was a structural equation model (SEM) where the three factors and vaccination hesitancy were regressed on ethnicity, and the three factors were regressed on the two age groups (i.e., below 26 and above 25). Model D was a SEM where the chance of getting COVID chance predicted the three CSS factors and vaccination hesitancy.
Standardized Factor Loadings and Reliability Coefficients from Model A.

Measurement invariance by ethnicity and by vaccination hesitancy was tested using a series of multigroup CFA models for configural invariance, factorial invariance, scalar invariance, and residual invariance (Meredith, 1993). Configural invariance refers to two groups having adequate model fit for the same model while allowing all parameters to vary freely. The series of invariance models factorial, scalar, and residual then add restrictions such as equality of factor coefficients, intercepts or thresholds, and the error variances, respectively across the groups. Model fit indices were tested not just between consecutive models but all also among all models. Chen’s (2007) criteria ΔCFI ≥ −0.005 and ΔRMSEA < 0.01or ΔSRMR < 0.025 (for configural invariance), and ΔCFI ≥ −0.005 and ΔRMSEA < 0.01 or ΔSRMR < 0.005 (for other model comparisons) were used to decide if the more restricted model was to be retained over the less restricted model. We also restricted the error correlations between the items (when present) to be the same across groups in the residual invariance model. Once measurement invariance was established, we fixed the factor covariances to be identical across groups. This is the factor covariance invariance model, which is a structural invariance model. After ensuring this model fitted well, a factor means model was fitted which restricted the factor means to be the same across groups. If this model had worse fit than the previous model, the standardized mean difference of the factor means between the groups was computed for each factor.
Next, a structural equation model (SEM, Model C, Figure 1a) was fitted to the entire data. Model D (Figure 1b) was fitted to the subsample containing only respondents who answered least likely, somewhat likely, and most likely to get COVID (n = 336). Frequencies were used to analyze the reasons for individuals who did not want to be or were unsure of being vaccinated. Cronbach’s alpha and McDonald’s omega were computed for each factor. All the factors had good reliability values (i.e., >.8). Reasons for vaccination hesitancy were listed by relevant demographic variables. Finally, Wald’s test of statistical significance for log of the odds ratios by age group for vaccination hesitancy was conducted for each pair of groups.
Results
Model A (the 5-factor model, Table 4) was fitted to the entire data and to each of the two subsamples (ethnic Whites and ethnic minorities). Standardized factor coefficients ranged from .56 to .96 (Table 2) and factor correlations ranged from .26 to .51 (Table 3). However, the five-factor model did not converge for either of the subsamples; the algorithm gave an error of non-convergence even after several thousand iterations. Therefore, after examining the correlations and modification indices it was clear that factors xenophobia and socioeconomic consequences did not fit the data and were therefore discarded. The main reason for discarding the factor is the extremely high correlation between the items within each of these factors (>.93). Even after these items were made to indicate the respective factors, model modification suggested extremely high error correlations among each pair of items within these factors (.92). This is not surprising given the nature of the items (e.g., I am worried about grocery stores running out of cold or flu remedies, I am worried about pharmacies running out of prescription medicines).
Correlations Among all the Factors.

Therefore, only three factors TS, DC, and CC fit the subsamples divided by ethnicity. In this three-factor model, the errors for two pairs of items had to be correlated. Specifically, the pair, I am worried that I might catch the virus from handling money or using a debit machine and I am worried that my mail has been contaminated by mail handlers had error correlation. This makes substantive sense that apart from fear of danger of contamination these items dealt with handling external materials. Secondly the pair, I am worried that I can’t keep my family safe from the virus and I am worried that our healthcare system won’t be able to protect my loved ones had error correlations. This is because these items dealt with loved ones which also includes family for most people. Therefore this three-factor model with two sets of error correlations (Model B) was fitted to the subsample only with ethnic Whites, the subsample only with ethnic minorities, and to the entire sample.
Table 4 shows that the highest level of measurement invariance, residual invariance held true for both sets of measurement invariance tests (i.e., ethnicity and vaccination hesitancy). Furthermore, Table 4 also shows that while factor means (i.e., COVID stress measured by the three factors) were the same irrespective of vaccination hesitancy, ethnic minorities scored statistically lower on danger of contamination (Cohen’s d = −3.03, b = −0.22, p < .01) and compulsive checking (d = −3.95, b = −0.31, p < .01); but had similar traumatic stress (d = −1.28, b = −0.131, p = 0.21) compared to ethnic Whites. Models C and D fit the data well. Respondents below the age of 26 scored statistically significantly higher on compulsive checking (b = 0.212, p < .05) than those above 25. Ethnic minorities showed statistically similar vaccination hesitancy compared to ethnic Whites (b = 0.214, p = 0.46). In Model D, respondents’ expectation of contracting COVID statistically significantly predicted CC (b = 0.189, p < .01), DC (b = 0.358, p < .01), and TS (b = 0.345, p < .01), but did not predict vaccination hesitancy (b = 0.035, p = .964).
Model Fit Indices for all the Models Fitted in the Study.
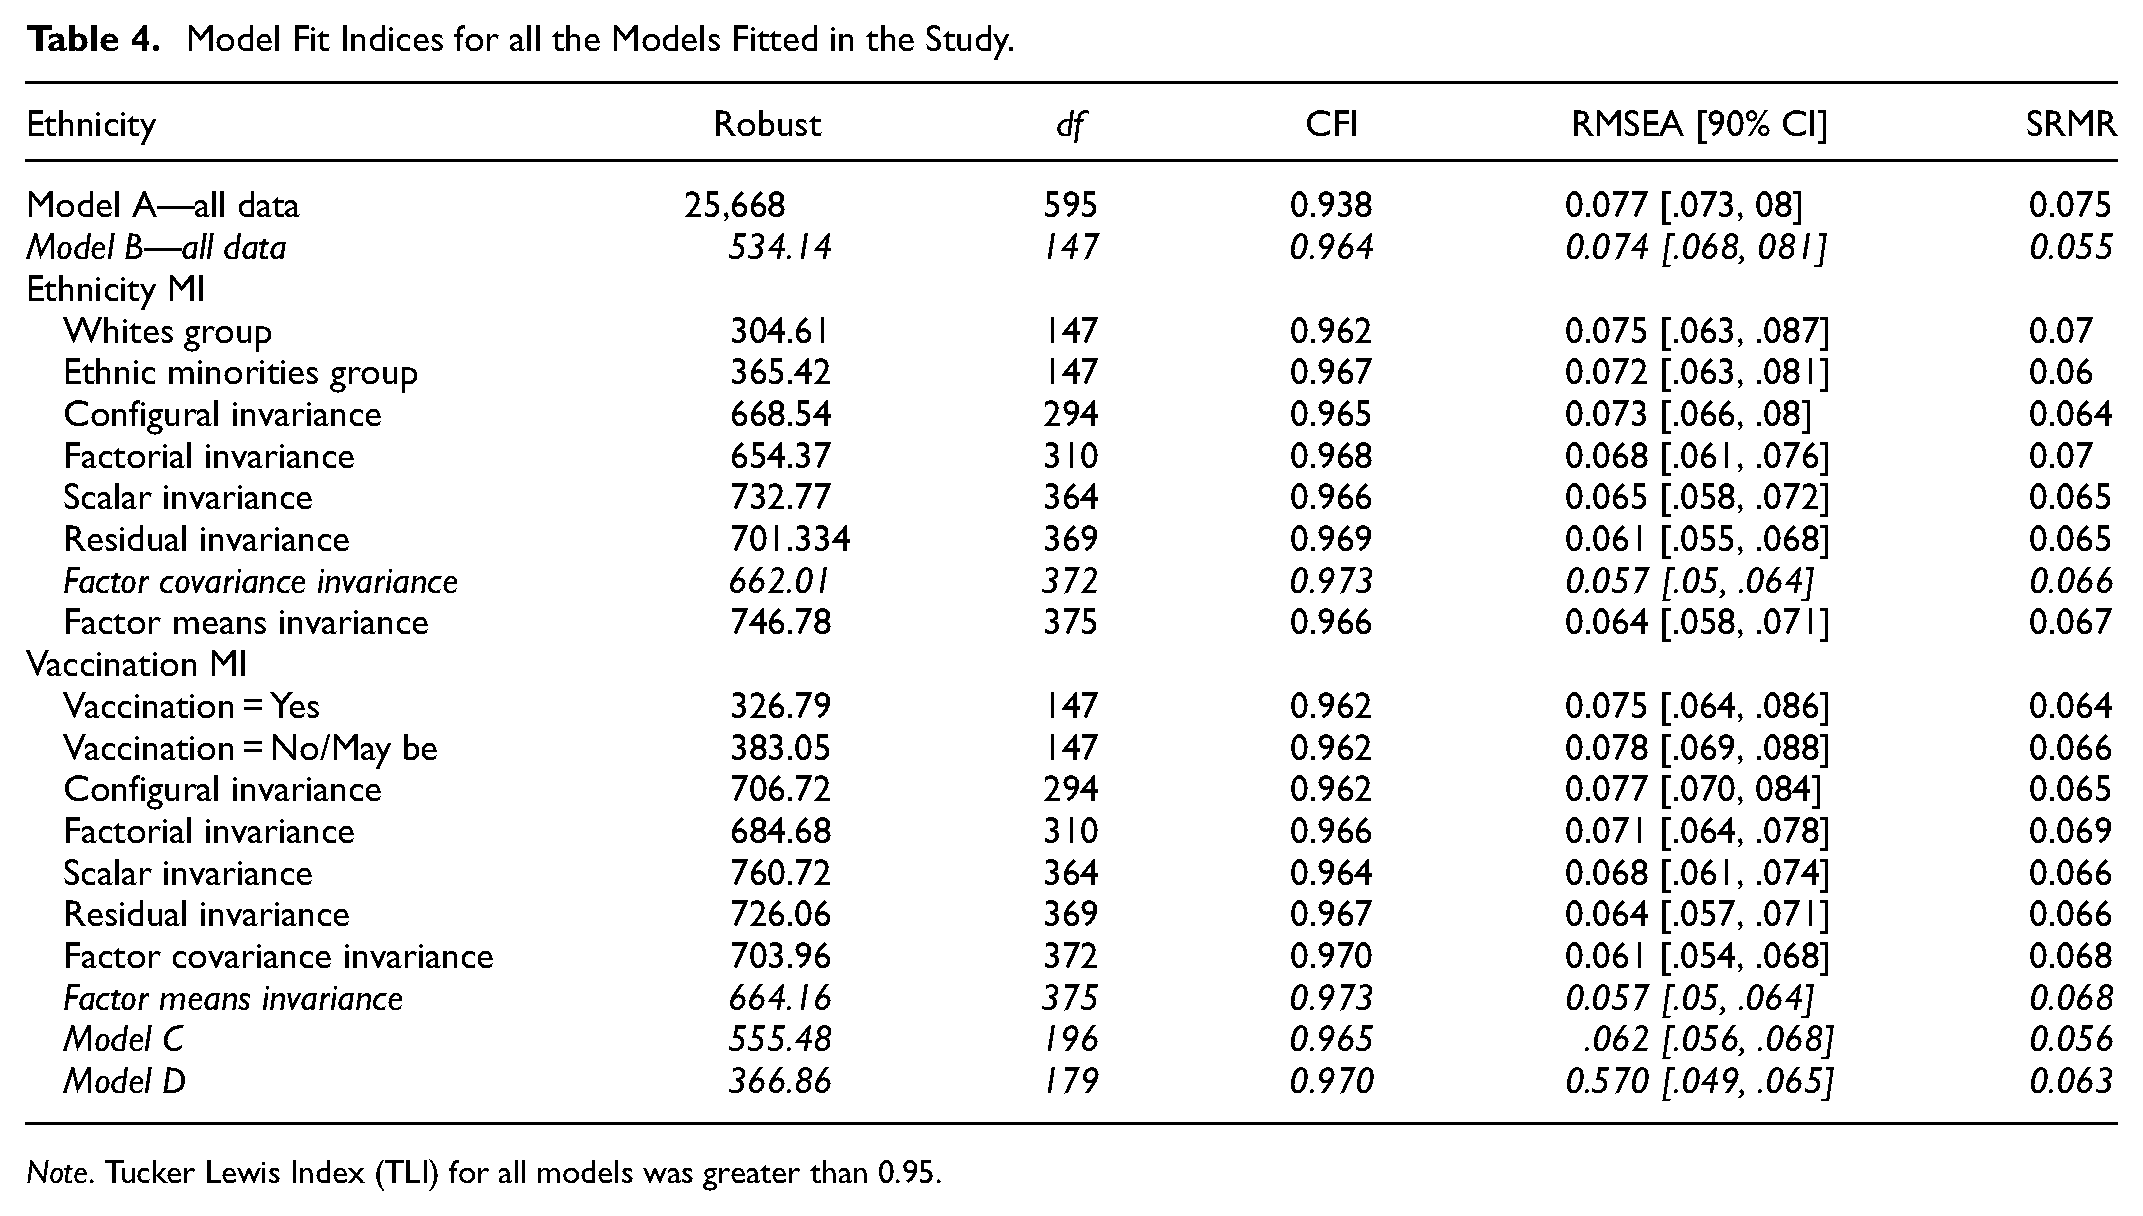
Note. Tucker Lewis Index (TLI) for all models was greater than 0.95.
Data on vaccination hesitancy for demographic groups are provided in Table 5. The reasons selected by respondents who were hesitant to get the vaccine included side effects (n = 226), safety (n = 136), letting nature to take its course (n = 40), COVID perceived as not dangerous (n = 42), fear of injections (n = 24), beliefs in natural or traditional remedies (n = 22), being anti-vaccines in general (n = 21), and religious reasons (n = 11). These reasons by various demographic factors did not show any clear patterns (Table 6).
Percentage of Responses Within Each Demographic Variable on Vaccination Hesitancy.

Percentage of Responses Within Each Demographic Variable on the Reasons for Vaccination Hesitancy.

Note. The reasons in column titles correspond directly to the reasons given in 2a to 2h in the text.
Wald’s test of statistical significance showed that the age group 18 to 25 was statistically significantly more hesitant to receive the COVID vaccine compared to 41 to 50 and 51+ age groups (Table 7, Figure 2). Similarly, age groups 26 to 30 and 31 to 40 were also statistically significantly more hesitant to receive the COVID vaccine compared to the 51+ age group. In fact, respondents over the age of 50 were 16 times more likely to want the vaccine compared to those under the age of 26. Also of interest is the fact that only 40% of those in the age group 18 to 25 wanted to be vaccinated. This is the only group with odds of less than 1 for receiving the vaccine.
Odds Ratios and Their Statistical Significance for Vaccination Hesitancy by Age.
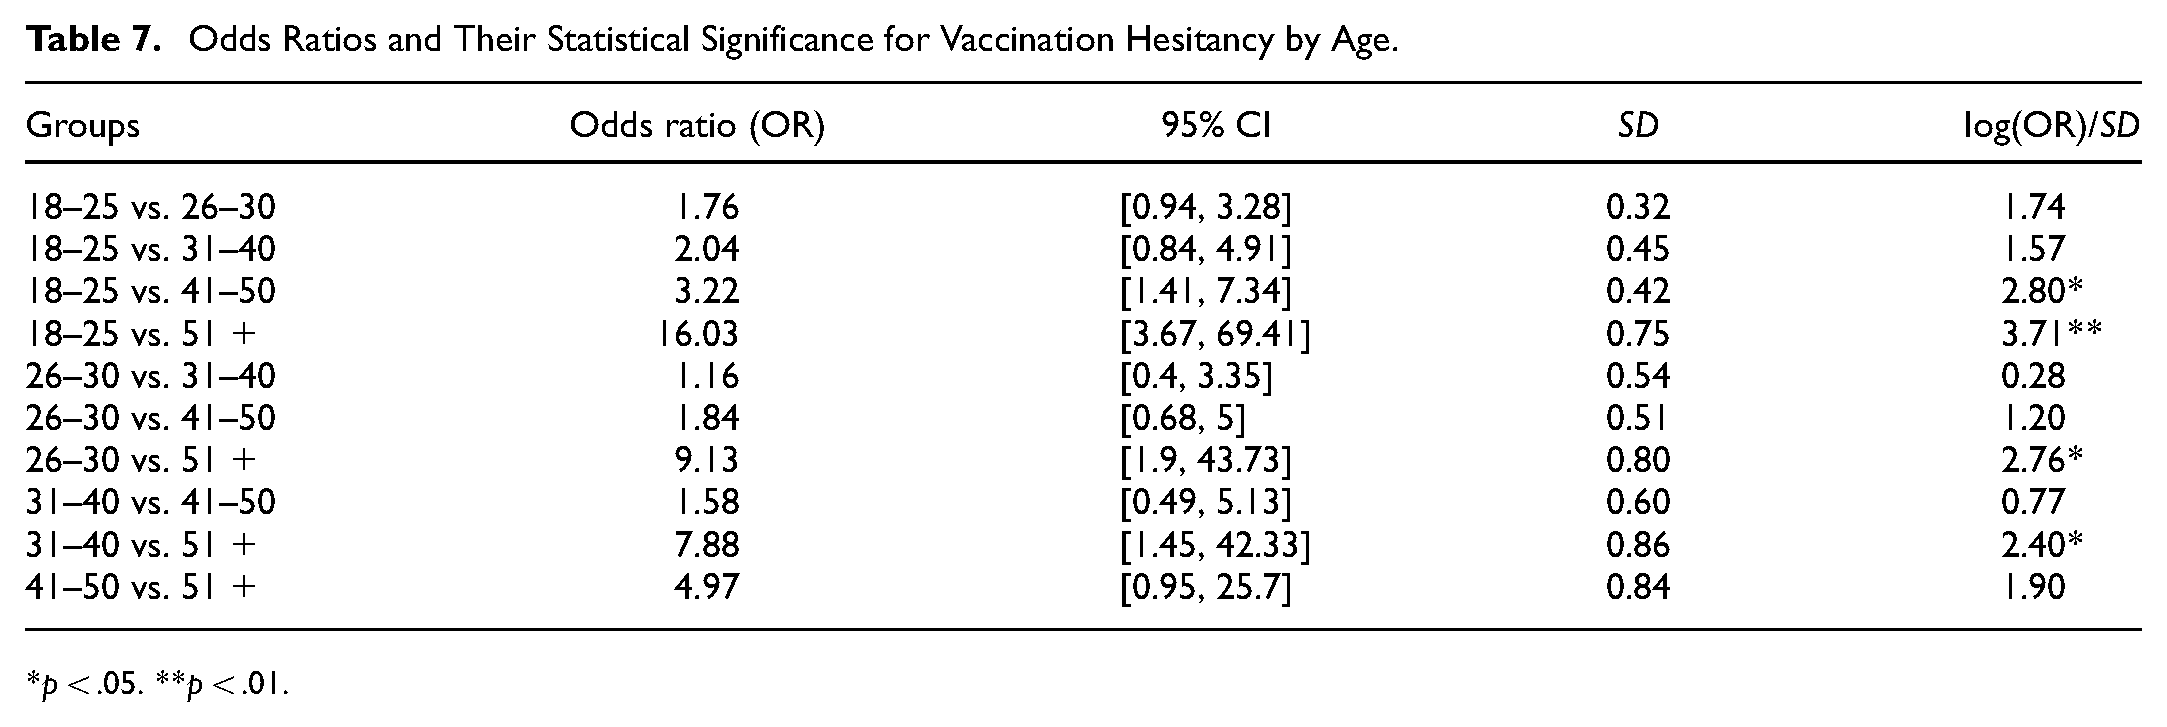
p < .05. **p < .01.

Vaccine acceptance by age group.
Discussion
Ethnic minorities reported statistically lower COVID stress on danger of contamination and compulsive checking, and younger populations show more stress due to compulsive checking than older respondents. It is important for mental and healthcare professionals to note that younger people showed more compulsive checking stress than their older counterparts. Although the younger populations use technology more than adults, the lack of social interaction and online education might have had a more negative influence on their COVID stress. A few more reasons might include the facts that the younger generation is more involved in social media and may be seeking information on COVID through these mediums more than the older generations. This should have an impact on professionals working with the younger generation. COVID stress levels were identical for groups that showed and did not show vaccination hesitancy. Respondents who believed they had a higher likelihood of getting COVID had significantly higher COVID stress on danger of contamination, compulsive checking, and traumatic stress. However, this did not manifest as willingness to get vaccinated. Policymakers need to target these populations and assuage their fear of the vaccine in order to improve vaccine takeup.
Wald’s statistical significance test of log odds show that younger age groups show more vaccination hesitancy. There seems to be a direct relationship between the age group and vaccination hesitancy with older people showing less vaccination hesitancy. This pattern is clearly visible in the COVID infection trends in the recent months which show that more people in the age group 18 to 29 (about 8.8 million in the US alone) have been contracting COVID than any other age group (Statista, 2021). In the current study, ethnic minorities had similar vaccination hesitancy compared to ethnic Whites. This trend might have been affected by the fact that while Asians show extremely low vaccination hesitancy, ethnic Blacks show high vaccination hesitancy (NHS England and NHS Improvement—South East, 2021). These two effects may have cancelled each other out when put together as a group. Studies with larger subpopulations might consider conducting these analyses by separate ethnic groups.
The main reasons for increased vaccination hesitancy relate to the fear of side effects and the safety of the vaccine. This was similar across ethnicities and age groups and showed that other reasons such as letting nature take its course, COVID perceived as not dangerous, fear of injections, etc., were trivial in comparison to the apprehension related to vaccine side effects and safety.
The results show that three of the five factors in the COVID Stress Scale are reliable and structurally valid for measuring stress due to COVID and making comparisons across ethnic groups and vaccination hesitancy status. Using these three scales might help practitioners examine COVID-19 related stress to inform assessment as well as clinical decision-making related to patients who demonstrate significant stress in their responses. More work needs to be conducted regarding the xenophobia factor because there have been several reports of cases of racist stereotypes with respect to COVID-19 (Le et al., 2020). Therefore, measuring this factor in a psychometrically robust manner is imperative.
As with any study, there are limitations to the present study. Although many scales have been developed since the administration of our survey, when we administered our survey there were no standardized or validated instruments to measure vaccination hesitancy or acceptance (e.g., Ahorsu et al., 2022; Pramukti et al., 2022). Lived experiences such as experiencing the infection oneself or by proximity can have an immense impact on infection stress. Therefore, these could be confounding variables on COVID stress. The data were obtained using convenient sampling. Given that social media and university listservs were an important part of how the data were obtained the sample might be less representative of all age groups and other demographic characteristics. This might be a threat to validity. Although we would have liked to have examined the difference between each of the ethnic groups, the sample size did not permit such a comparison. For decades researchers have combined ethnic minorities into one non-White category, and we acknowledge the problem in equity and representation with this approach. We hope that a solution for disparity in sample sizes can be obtained in methodological advancements that would allow us to make robust comparisons of highly unequal group sizes. As with any correlational study, care must be taken to not interpret the results from the present study as causal. Although we have reported commonly used indicators of reliability such as Cronbach’s alpha and McDonald’s omega, these should be interpreted as estimates of internal consistency and do not address all aspects of reliability.
Conclusion
Practitioners might benefit from understanding the patterns of stress factors their patients suffer. Knowing a younger patient has as much stress as an older patient (and in fact scores higher on compulsive checking) and yet is much less likely to desire vaccination is important. Knowing that vaccination hesitancy concerns regarding safety and side effects is also crucial. Addressing the fact that ethnic minorities do not demonstrate more stress despite being more vulnerable to the effects of the virus might help target education efforts. For this pandemic to end, immunity in a large fraction of the population needs to be achieved. Some reasons for delay and disparity in getting vaccines into the arms of ethnic minorities include vaccine accessibility issues such as vaccine scheduling, lack of transportation, and lack of awareness. The Advisory Committees on Immunization Practices (ACIP) recommended prioritizing high risk groups to be vaccinated first, but their recommendations did not include specific plans for equitable distribution of the vaccines to racial and ethnic minority populations. This is an important lesson to be learned on managing the pandemic, because the purpose should be to equitably make everyone safe. Black Americans tend to have more mistrust of the vaccine (Dembosky, 2021; Kum, 2020). However, Samuels (2021) contends that there are other reasons for lower vaccination rates including longer travel time to vaccination centers for Black Americans, limited internet access to make appointments for ethnic minorities, harder-to-teach populations who are not tech-savvy, and disproportionately being front-line workers who cannot request time-off easily for vaccination. Perhaps then it is not really vaccine hesitancy but a lack of investment in ethnic minority communities and overall health inequities that are the major barriers to getting the COVID vaccine. It has also been reported that COVID vaccine sites have been missing in some Black and Hispanic neighborhoods, especially in the South (McMinn et al., 2021). All of these, in addition to our findings show that there is a need to include racial and demographic factors when planning to combat a pandemic such as COVID-19. Our study demonstrates that people need to receive education that the vaccines are safe and have limited side effects and that it is vitally important that those vaccines get into arms, regardless of the color or age of those limbs.
Footnotes
Declaration of Conflicting Interests
The author(s) declared no potential conflicts of interest with respect to the research, authorship, and/or publication of this article.
Funding
The author(s) received no financial support for the research, authorship, and/or publication of this article.
Data Availability Statement
Due to the sensitive nature of the data, the actual data are not available. However, the correlation matrix is available upon request.