
Abstract
The investment development path theory delineates countries in stages I, II, III, IV, and V according to the level of development as developing, transition, and developed countries. The World Bank’s classification of countries by income, however, identifies countries as lower-income, lower-middle-income, upper-middle-income, and high income. In this paper, we test the investment development path theory for countries based on the level of income using data from 1980 to 2019. Africa offers unique data as it is the only continent made up of entirely developing countries together with countries that fit into all four classifications based on income. Income level classifications appear to enhance the position of countries within the investment development path ahead of that based on the United Nations classification. The use of income classification should complement that of the United Nations in the empirical testing of the investment development path theory for a more current investment development path status.
Keywords
Introduction
Cross border resources movements have become important in international economics and business owing to the benefits to be derived. Knoerich (2017), UNCTAD (2006), and United Nations (2020a) noted that outward foreign direct investment yield financial, intangible capability, and tangible capacity returns. These contribute to supporting the development needs of a country, such as by bringing in additional finance, supporting industrial growth and technological catch-up, enhancing production capacities, and providing stability needed to support the development process. On the other hand, de Mello (1997), Gallová (2011), and Oualy (2019) enumerated some benefits for inward foreign direct investment. (1) Stimulating local investment by increasing domestic investment through links in the production chain when foreign firms buy locally made inputs or when foreign firms supply intermediate inputs to local firms. (2) Augmenting the supply of funds for investment thus, promoting capital formation. (3) Increases export capacity, causing an increase in foreign exchange earnings. (4) New job opportunities and enhancement of technology transfer are associated with foreign direct investment thereby boosting overall economic growth.
As outward foreign direct investment and inward foreign direct investment contribute to economic growth and development, Dunning (1981a) put forward the investment development path framework. The investment development path theory uses the differences between outward foreign direct investment and inward foreign direct investment, the net outward foreign direct investment and gross domestic product (GDP) per capita to determine the stage of development of a country or economy. These stages have often been synonymous with the classification of countries into developing, transition, and developed (United Nations, 2020b). Indeed, all countries in Africa are classified as developing countries (United Nations, 2020b). World Bank (2020) also classifies countries based on gross national income (GNI) per capita. GNI is the sum of gross GDP and net foreign flows (Chu, 2020; Romer, 2018). The GNI per capita can be influenced by economic growth, inflation, exchange rate, and population growth. Updates to national accounts methods and data can also influence GNI per capita (Serajuddin & Hamadeh, 2020). The classifications result in delineations as lower (LI), lower-middle-income (LMI), upper-middle-income (UMI), and high-income (HI). Twenty three out of the 29 lower-income countries are in Africa. Whilst 19 out of the 50 lower-middle-income countries are in Africa, 5 of the 56 upper-middle-income countries can be found in Africa. Seychelles is the only African country of the high-income classification within the 83-country group. As the gross domestic product is a significant contributor to the GNI there must be some relationship with the GDP per capita and by extension, the two classifications; level of development and level of income. Therefore, we pose the question, does the classification of countries based on the level of income conform to the classification; developing, transition, and developed, in the investment development path theory?
Some studies tested the investment development path theory. Dunning (1986) and Satoglu (2017) for developing countries, Frenken and Mbuvi (2017) studied emerging and developed countries whilst Andreff (2003) examined 176 developing, transition, and developed countries. None of these explored the role of the level of income of countries or groups of countries. At the regional level, Boudier-Bensebaa (2008), Duran and Ubeda (2001), Gorynia et al. (2010a, 2010b), and Paul (2014) tested the investment development path theory for Central and Eastern European countries whilst Voica et al. (2020) focused on European Union countries. None of these examined Africa as a group. Not all countries are consistently classified in the two classification systems. However, the effect of these classification differences, particularly, that of the level of income in the case of the investment development path theory, is unknown. We fill these gaps by testing the investment development path theory for countries in Africa based on all income level classifications according to the World Bank. The Africa data is particularly useful for a couple of reasons. (1) All the countries are classified as developing countries by the United Nations (2020b). Thus, all are expected to belong to the same stage of development, according to the investment development path theory (Dunning, 1981a, 1986, 1988a, 1993; Dunning & Narula, 1994, 1996; Narula, 1993). (2) Countries belonging to all the income groups according to the World Bank are found in Africa, including Seychelles, the only high-income country (World Bank, 2021). Thus, it is possible to explore the stage of development for all income groups. (3) At the time of submitting this paper, none of the regional studies analysing investment development path theory studied Africa as a region independently.
The identification of the stage(s) of development in the investment development path, is an image of the international attractiveness of the given industry and indirectly of businesses expanding overseas from that industry and offers procedures for suitable economic policy response (Buckley & Castro, 1998; Dunning, 1981a, 1981b, 1986; Dunning & Narula, 1996; Gorynia et al., 2019). Traditionally, policy implications based on the IDP framework has been based on the level of development. The outcome for the use of the level of income would offer an alternative to the existing one. Moreover, the income classification tends to change more frequently than the trio classification of developing, transition and developed. Thus, policymakers would have both short-run and long-run bases for formulating policy.
As the use of the gross domestic product is ubiquitous in the literature, the use of the level of income designated by gross national income would show a clearer position of a country or countries in the investment development path. As the use of the level of income is more fluid than the level of development, its successful use in determining the position in the investment development path would be more current.
The rest of the paper proceeds as follows. Section 2 is the literature review. The data and methods are outlined in section 3, with the results and discussions presented in section 4. The last section is conclusions and recommendations.
Literature Review
Theoretical Review
The investment development path relates an economy’s net outward foreign direct investment to gross domestic product to determine the economy’s level of development (Dunning, 1981a, 1986, 1988a, 1993; Dunning & Narula, 1994, 1996; Narula, 1993, 1995). The stage of development can be explained by ownership, localisation, and internationalisation (OLI) (Dunning, 1981b). The theory proposed five stages of development, namely, stages I, II, III, IV, and V (Figure 1) (Dunning, 1981a, 1986, 1988a, 1993; Dunning & Narula, 1994, 1996; Narula, 1993, 1995). In stage I, the inward foreign direct investment exceeds outward foreign direct investment. This is because of the ownership advantages such as indigenous technology and consequently limited created assets. Also, the location advantages of the economy are inadequate to attract inward foreign direct investment. Further, internationalisation from local firms is almost non-existent. Developing countries are proposed to be at this stage.
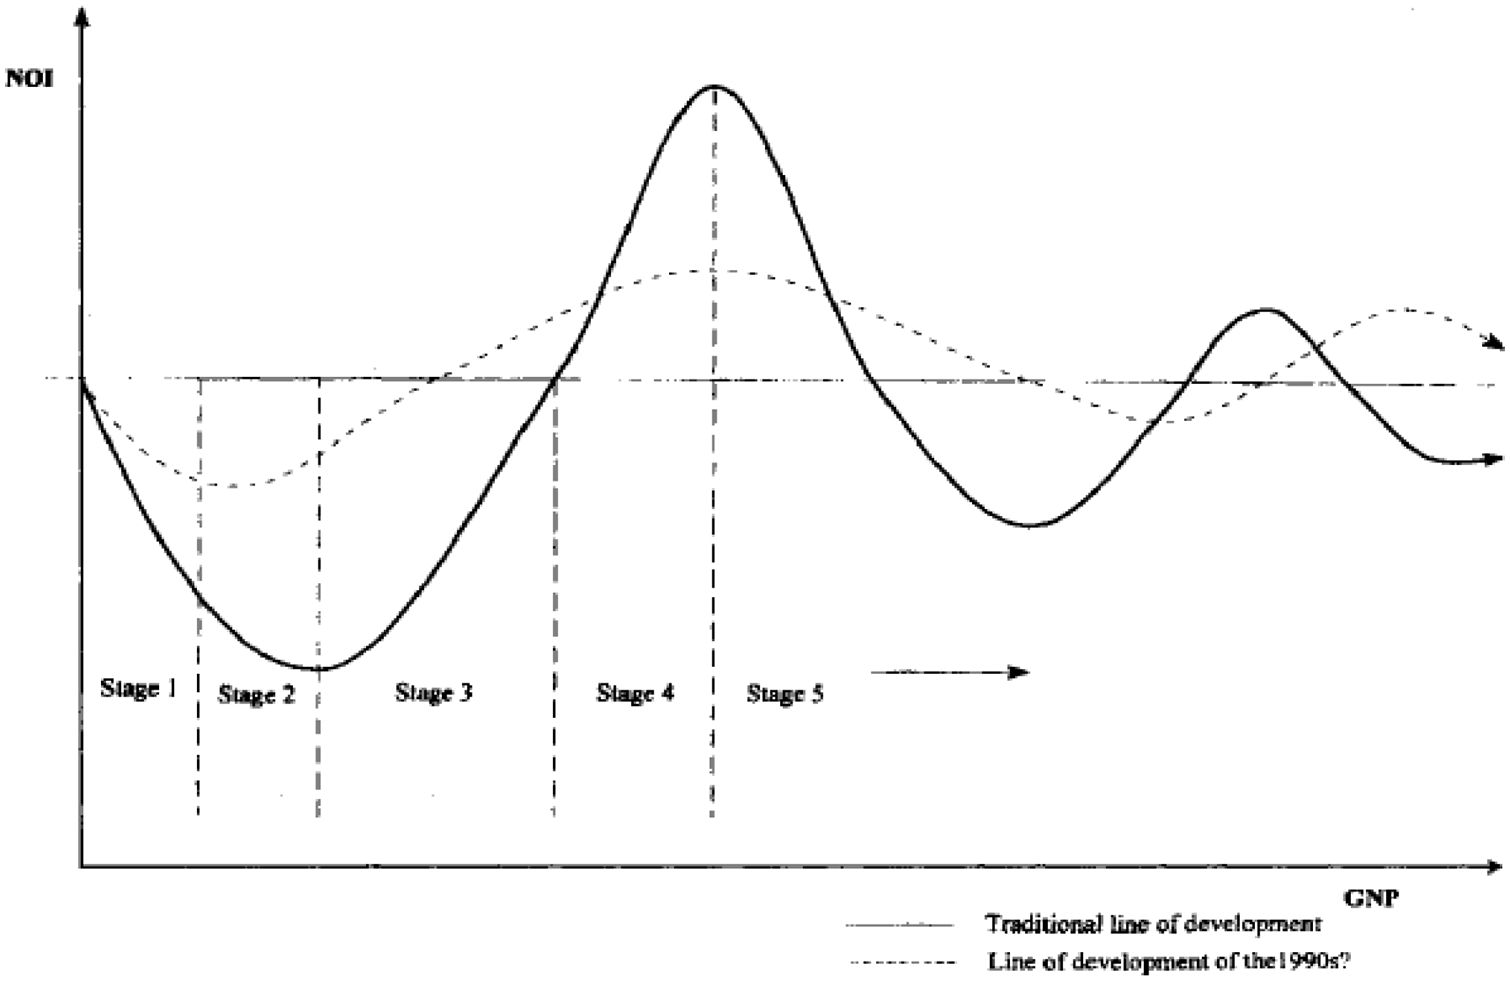
Investment development path (Dunning & Narula, 1996).
In stage II, designated for developing countries that have graduated from stage I, relates to a further increase in inward foreign direct investment relative to outward foreign direct investment. Here, there is some increase in ownership advantages and location advantages beyond those at stage I. The former results from the development of backing businesses whilst changes in the economic environment such as comparative cost of production explain the latter.
In stage III, the gentle decline in the inward foreign direct investment and rise in outward foreign direct investment results in a reduction in the negativity of the net outward foreign direct investment. This is attributable to the increase in the ownership and location advantages of indigenous firms. As a result, indigenous firms begin to invest abroad. Emerging economies are proposed to be in stage III.
When an economy’s outward foreign direct investment exceeds its inward foreign direct investment, net outward foreign direct investment becomes positive. This is stage IV. The ownership and location advantages would have grown significantly to engender large investments abroad by indigenous firms, that is internationalisation. Developed countries are hypothesised to be in stage IV.
In stage V, the influence of the ownership, location, and internationalisation advantages mature such that their effect on outward foreign direct investment and inward foreign direct investment leads to transient peaks and troughs in net outward foreign direct investment. No single country has overall control of ownership, location, and internationalisation influence. Multinationals tend to value their business interest above that of their country of origin. Thus, there is sharing of resources, production contracts, and products. The description mimics developed countries.
Empirical Review
Many studies have tested the investment development path theory empirically (Andreff, 2003; Boudier-Bensebaa, 2008; Djokoto, 2021; Gorynia et al., 2006; Kottardi et al., 2004; Kuzel, 2017; Voica et al., 2020). Gorynia et al. (2006) summarised these as multi-country studies using cross-sectional analysis and one-country study, either concerning all countries of the world or a group of countries that represent the main source and destination for foreign direct investment. The latter strand incorporates to a varying extent, spatial factors into the analysis of the investment development path theory. As our paper relates to Africa, a group of countries, the empirical review focuses on multi-country studies. Few large country studies have been reviewed, however.
Dunning (1986) studied 25 developing countries using cross-sectional data. He found that the coefficient of the gross national product for both the levels and log-transformed data were statistically significant. However, Dunning (1986) noted that a great majority of the developing countries are either in stage I or II. Using data on Mexico, Indonesia, Nigeria, and Turkey, Satoglu (2017) found a significant negative coefficient for the GDPPC and a significantly positive coefficient for GDPPC2 variables. Based on the data covering 1990 to 2013, Mexico, Indonesia, Nigeria, and Turkey were found to be in stage II of the investment development path. Frenken and Mbuvi (2017) similarly found stage II for emerging economies using data over the period 1994 to 2014.
For transition economies, Andreff (2003) analysed 26 of them in comparison to third world economies using data for 1998. Andreff (2003) reported a positive and statistically significant coefficient for gross domestic product. Consequently, the countries were assigned to stage III. It must be noted that Andreff (2003) used ordered logit, unlike the commonly used ordinary least squares.
Boudier-Bensebaa (2008), Duran and Ubeda (2001), Gorynia et al. (2010a, 2010b), Kalotay (2008), Paul (2014), Stoian (2013), and Voica et al. (2020) examined transition economies regarding the investment development path theory. Boudier-Bensebaa (2008) and Gorynia et al. (2010b) noted Central and Eastern European countries were either in stage I or II. Duran and Ubeda (2001) noted the Central and Eastern European countries were moving to stage II, whilst Kalotay (2004) and Paul (2014) showed that Central and Eastern European countries were firmly in stage II. Additionally, Paul (2014) found negative signs for GDPPC and GDPPC2 for the 1980 to 2008 data and significantly positive coefficients for the period 1980 to 2012. Only Gorynia et al. (2010b) reported stage III for Central and Eastern European countries.
Regarding developed countries, Duran and Ubeda (2005) and Frenken and Mbuvi (2017) reported some results. The former studied 24 developed countries for the period 1980 to 2000 and found these countries to belong to stage IV of development in the investment development path theory. The latter, using data for 1994 to 2014 found the developed countries in their data to belonged to stage III and IV.
Small states, classified as countries with a population barely exceeding 1.5 m, includes developing, transition, and developed countries. Djokoto (2021) investigated the stages of Small states within the investment development path framework. As a collective, developing Small states departed from the theory of the investment development path. As individual Small states, some of the countries also showed stages that were inconsistent with the theory and empirical evidence. Specifically, more than half of the Small states were in stages I and II, as the theory suggested. A little below half were found to be in stage III, a departure from the theoretical proposition. The developed countries of Estonia and Malta showed in stage II, another departure from the investment development path theory. The findings for Cyprus and Iceland in stage V were as expected from the investment development path theory. Stage V in the case of Cyprus was attributed to the financial crisis, the rate of growth of NOFDI had declined since 2009, except for 2015 (Djokoto, 2021). Indigenous firms could no longer invest across borders as their resources dwindled as the macroeconomy could not produce the enabling environment to do so (Djokoto, 2021; Floyd, 2019; Lütz et al., 2019; Ptasica, 2020). Djokoto (2021) recommended Small states needed to be studied as a collective and as individual countries.
It would be observed from the literature surveyed that the stage of development is not static. Countries (groups of economies) traverse the investment development path stages over time. Whilst developing countries tended to be confined to stage I and II as proposed by the investment development path theory, transition economies are in stage III. Indeed, some of the Central and Eastern European countries, at the time of analysis, and period of data used, were considered as economies in transition. Thus, their positions have varied from stage I to IV. The analytical approaches that used the NOFDI_GDPPC framework only tended to provide results consistent with theory unlike those that augmented the model. This is unsurprising as the early stages of development of the investment development path did not employ control variables. Indeed, the augmentation did cause some deviations from the theoretical stages of development in either direction.
Virmani and Amann (2015) and Verma and Brennan (2011) investigated the investment development path theory for India. Whilst the latter study covered 1991 to 2006, that of the former used data from 1980 to 2010. The latter found negative and positive coefficients respectively for GDPPC and GDPPC2 whilst the former reported a positive coefficient for GDP. Both studies found India to be in stage III of development in the investment development path theory. For China, stage III, and stages IV and V if factors other than GDPPC was incorporated into the estimated model. In the case of Brazil, Cechella et al. (2012) and Stal and Cuervo-Cazurra (2011) made some findings. Brazil was found to have moved from stage II to stage III in the investment development path where several companies were beginning to make investments abroad, but the country remained a net receiver of foreign direct investment. Stal and Cuervo-Cazurra (2011) specifically explained that pro-market reforms and the role of regulatory escape to tax havens were responsible. The former pushed companies to upgrade their capabilities beyond the level compatible with the development of the country, which helped them become multinational companies earlier than expected. The latter, also known as the escape response, explained multinational expansion as an attempt to avoid excessive regulations and institutional constraints in the home country.
Among the Central and Eastern European countries, Poland has attracted most attention regarding empirical testing of the investment development path theory (Ciesielska & Frąszczak, 2014; Gorynia et al., 2008, 2019; Kosztowniak, 2019; Kuzel, 2017; Majewska & Buszkowska, 2014). Whilst Gorynia et al. (2008, 2019) reported stage II, Kosztowniak (2019) and Kuzel (2017) reported early part of stage III. In the view of Ciesielska and Frąszczak (2014), Poland is well within stage III of development on the investment development path. For another CEE country, Romania, Birsan et al. (2011) reported stage II based on data for 1992 to 2009. Whilst confirming stage II, Maşca and Văidean (2010) reported the early part of stage III as well. Ferencikova and Ferencikova (2012) also found stage III for Slovakia. The only evidence of stage V was for the European Union. Iacovoiu and Panait (2014) found this using data from 2005 to 2011 for European Union—27. Specifically, the European Union—27 was found to have traversed stages IV and V.
From the review, it is apparent that evidence for stages I, II, III, and IV abound. That of stage V of the investment development path is rare. Whilst none of the one-country studies addressed an African country, none of the regional studies addressed Africa (although African countries are included in Small states, however, Small states do not constitute a region). Further, no study explored the role of the level of income, gross national income concerning the investment development path theory. We fill these gaps using data on African countries and explored the correlation between income level, as classified by the World Bank, and level of stages of development in the investment development path theory.
Data, Modeling and Estimation
The data for the study are net outward foreign direct investment per capita (NOFDIPC) and gross domestic product per capita (GDPPC). NOFDIPC was measured as the stock of outward FDI per capita (OFDIPC) less the stock of inward FDI per capita (IFDIPC). OFDIPC, IFDIPC, and GDPPC were obtained from UNCTAD (2020). The data is an unbalanced panel spanning 1991 to 2017 and for 41 African countries (Appendix 1). The data was categorised based on gross national income reported by the World Bank (2020). As our data ended in 2017, the classification of lower-income (LI), lower middle income (LMI) and upper middle income (UMI) were based on 2017 calendar data of the 2019 World Bank financial year.
The IDP theory posits a relationship between NOFDIPC and GDPPC. The theory illustrated by Figure 1 suggests a polynomial as a mathematical representation. Hence, equation (1).

Where i = 1, 2, 3. . .N and t = 1, 2, 3. . .T. βk, k = 0, 1, 2. . . .5 are parameters to be estimated.
The variables are as defined in the opening paragraph of this section.
From the literature (e.g., Paul, 2014; Satoglu, 2017), equation (1) rarely fits the data. Rather, pairs of powers of GDPPC are fitted. Consequently, we specified a permutation of the variables in equation (1). As the investment development path was based on the relationship between net outward foreign direct investment and gross domestic product per capita, it is appropriate that we follow that framework. We used a panel ordinary least squares estimator to capture the time and cross-sectional dimensions of the data. Specifically, fixed effects and random effects and the appropriate specification was identified using the Durbin-Wu-Hausman test (Durbin, 1954; Hausman, 1978; Wu, 1973). Potential violations of the regression model were tested: multicollinearity, heteroscedasticity, and serial correlation. Misspecification was not suspected because the explanatory variables include power terms. The use of the estimators stated was based on the structure of the data; the cross-section dimension (N = 41) is greater than the time dimension (T = 27). Moreover, the unbalanced character of the panel is such that some have periods as low as two.
Results and Discussion
Background of the Data
The original data involved 1,270 observations. A scatter plot revealed some outliers (Appendix 2). The data was then manually trimmed. We set out to remove 5% of the data. This was informed by the 5% percentile (Gould & Hadi, 1993; Hadi, 1992, 1994) resulting in Appendix 3. The descriptive statistics of the resulting data is reported in Table 1. Out of the total observations of 1,208, 43% is contributed from lower-income countries (LI), 35% by lower-middle-income countries (LMI), 20% by upper-middle-income countries (UMI) and the rest contributed by countries in the high-income bracket (HI). The mean of LI_GDPPC is 217. This is higher than that of HI_GDPPC, 57. The difference is HI_GDPPC had many zeros in the series that arose from the construction of the variable as an interaction between a dummy variable (HI = 1, 0 otherwise) and GDPPC. The standard deviation of NOFDIPC is 601, higher than the mean of −398. This suggests overdispersion as can be seen from Appendix 3.
Descriptive Statistics.

Estimation and Model Selection
Twelve specifications other than equation (1) were estimated for Africa as a whole. After screening for multicollinearity, diagnostic statistics of the eligible models are presented in the first panel of Table 2. All six models passing the multicollinearity test are random-effects models. However, these failed the homoscedasticity and non-serial correlation condition. Before correcting for these failures, we selected one model based on the lowest Akaike information criterion and Bayesian information criterion. The model with GDPPC powers of 1 and 2 was selected for further analysis. The data was then segregated into all four income groups using three dummy variables. Another was into three groups: lower income, middle income, and high-income with three dummy variables. A third segregation was accomplished: lower-income and lower middle income into one group and then upper middle income as well as high income, using two dummy variables. None of them passed the multicollinearity test (second panel of Table 2).
Regression Diagnostics of Models Screened for Multicollinearity.

p<.01.
Subsequently, the data for Seychelles, the only high-income country, was dropped resulting in 41 countries and 1,193 observations. The models that passed the multicollinearity test for Africa as one unit, is in the first panel of Table 3. As in the case of Table 2, all the models failed the homoscedasticity and no-serial correlation test. The model with the lowest Akaike information criterion and Bayesian information criterion is that with GDPPC powers of 1 and 2, hence selected for further analysis. The data was then segregated into three income groups: lower-income, lower-middle-income, and upper-middle-income, using two dummy variables. The results of the selected models based on the variance inflation factor cut-off of 10 (O’brien, 2007; Wooldridge, 2009) are shown in the second panel of Table 3. Unlike with models from the un-segregated data, there is a mix of fixed effects and random-effects models. All models also failed the homoscedasticity and no-serial correlation test. Within this error space, we selected the model with GDPPC powers of 1 and 5 using the Akaike information criterion and Bayesian information criterion. Subsequently, pooled ordinary least squares with Driscoll-Kraay standard errors were applied to address the heteroscedasticity and serial correlation violations.
Regression Diagnostics of Combined Models Screened for Multicollinearity Without Seychelles.
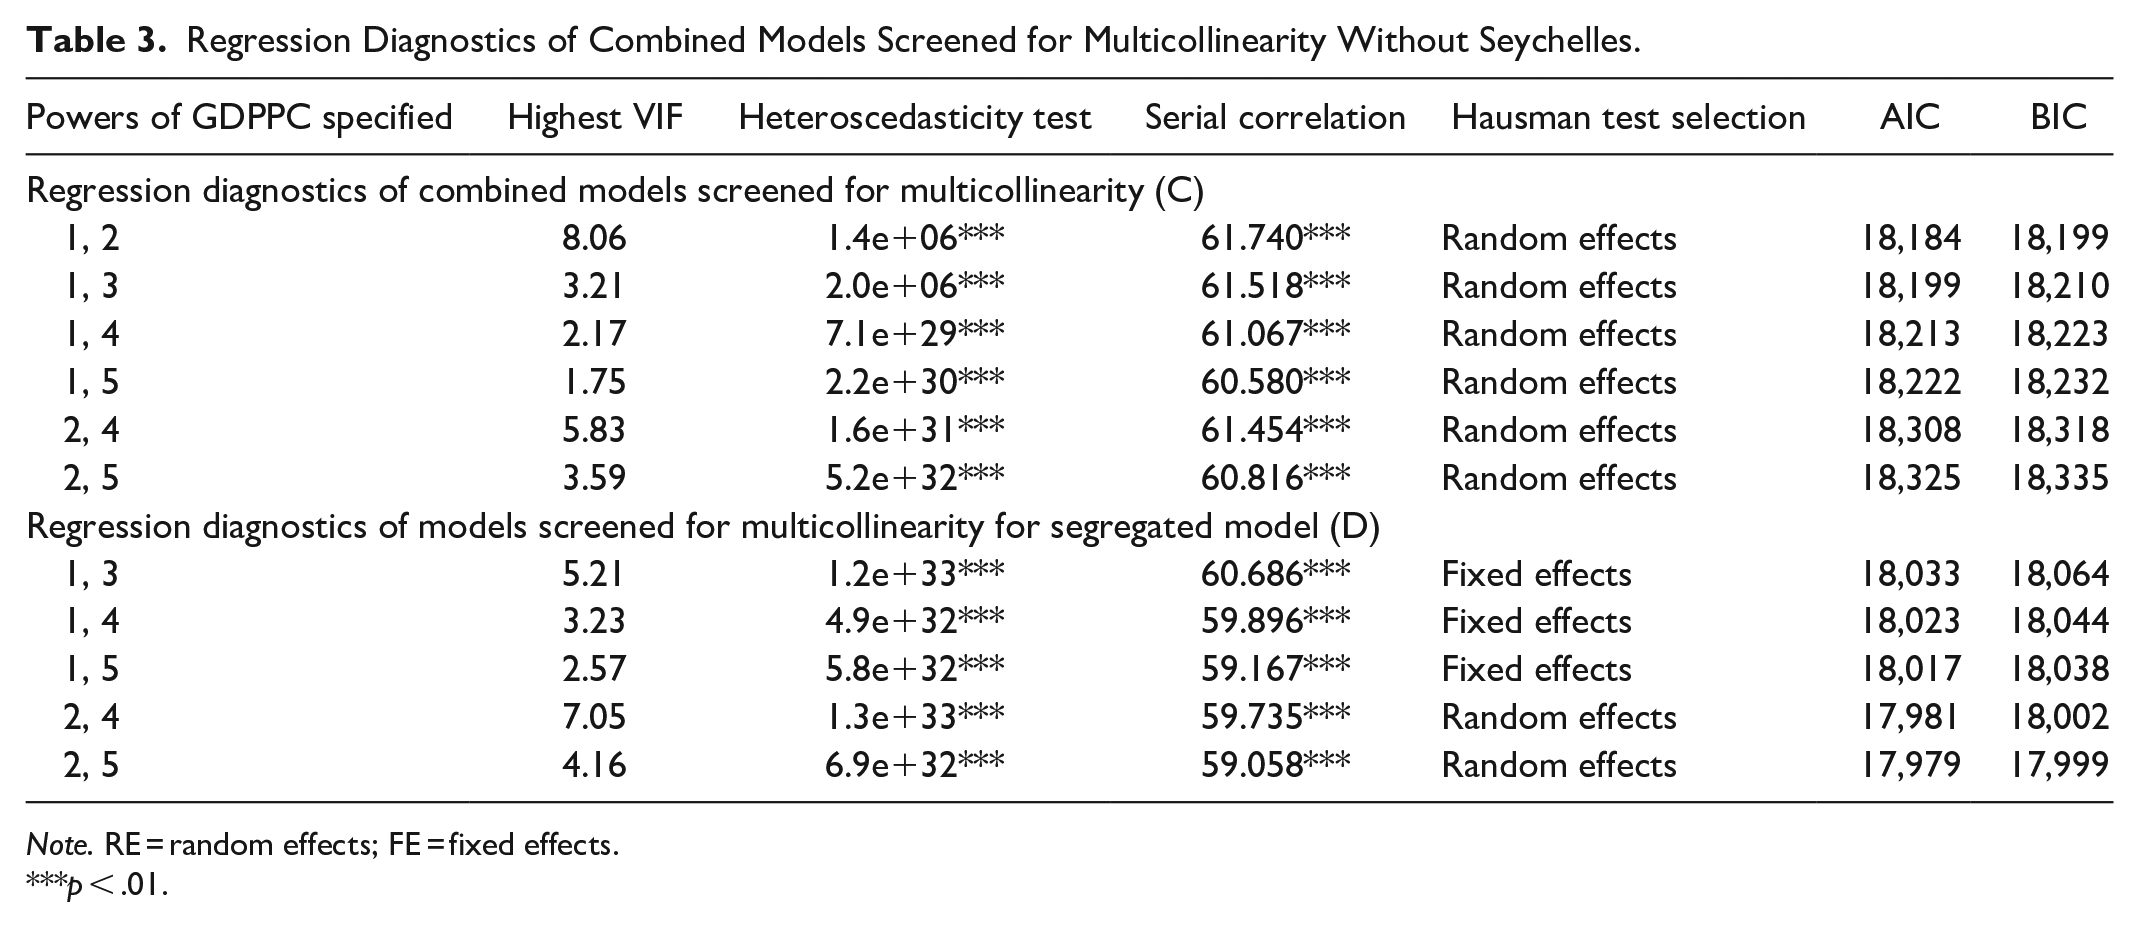
Note. RE = random effects; FE = fixed effects.
p < .01.
Discussion of the Selected Model
All F-test statistics are significant at the 1% level for all three models: A, B, and C. The R squared values are less than 40% (Table 4). This is unsurprising as there is high dispersion in the data, as stated earlier. Except for model C, the constants for all models are statistically insignificant. The sign and significance of the coefficients in model A suggest a quadratic curve for Africa, using the whole sample. The quadratic function was reported by Boudier-Bensebaa (2008) and Paul (2014) for Central and Eastern European countries and Satoglu (2017) for Mexico, Indonesia, Nigeria, and Turkey as a collective.
Pooled OLS With Driscoll-Kraay Standard Errors (DKSE).

p < .05. ***p < .01.
A quadratic function was established in the case of model C, the Africa sample without Seychelles, the only high-income country. A close examination of the magnitude of the coefficients suggests marginal shifts. For the GDPPC, there is a marginal shift toward the early part of stage I, whilst the GDPPC2 reveals a marginal shift toward the early part of stage III. As Seychelles is a high-income country, this finding implies the high-income country was contributing to a forward shift in the stage of the development, albeit marginal.
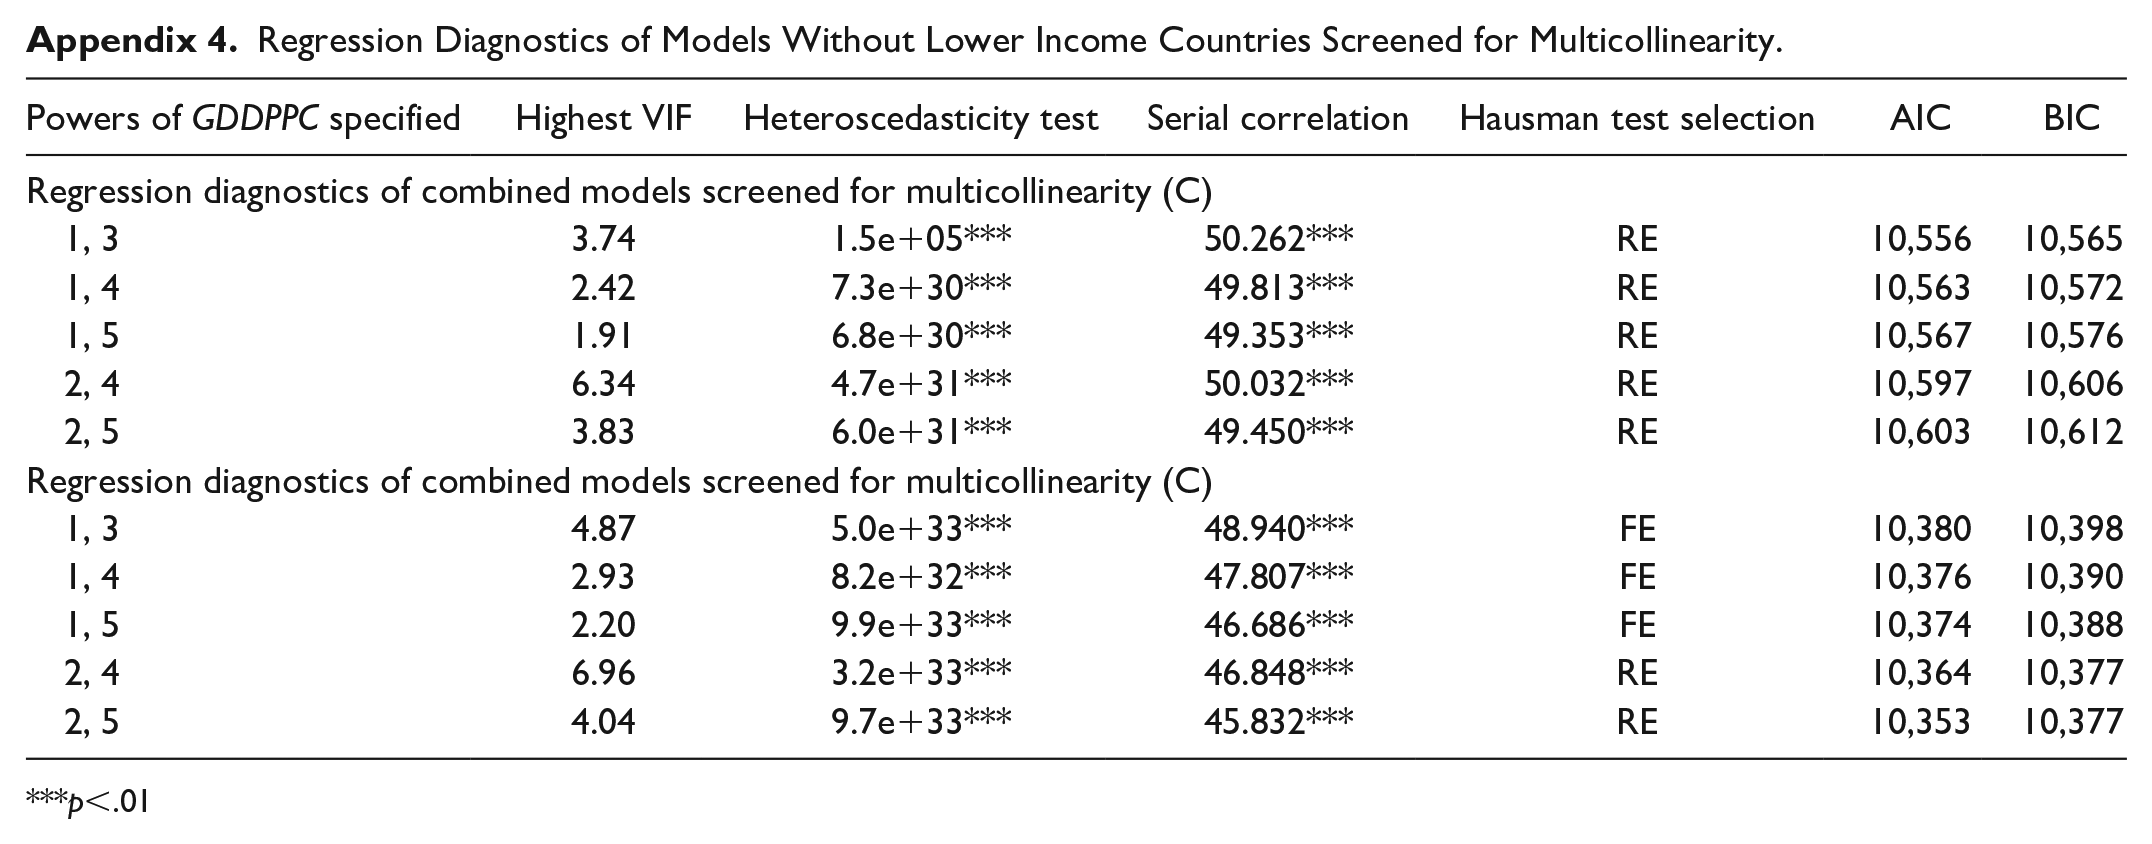
The coefficients for LMI_GDPPC2 and LMI_GDPPC5 and that for GDPPC2 and GDPPC5 are statistically significant. The GDPPC2 and GDPPC5 capture the total effects of upper-middle-income countries. It must be noted that in the definition of the dummies, the reference was the UMI. The statistical significance of the GDPPC2 and GDPPC5 are pointers to statistically significant Wald. The coefficients for LI_GDPPC2 and LI_GDPPC5 are statistically insignificant. This may be a pointer to the statistical insignificance of the Wald for LI. Given the statistical insignificance, dropping these variables would not have an appreciable effect on the prediction of the model. Consequently, we dropped data on the 19 lower-income countries leaving 672 observations. The diagnostics are in Appendix 4 and the estimation is model E for the combined and model F for the segregation based on the level of income.
Effects of the Level of Income on Stages of Development
The Wald statistics were computed based on the estimates in Table 4. The results are reported in Table 5. The Wald statistics are without enclosures. The standard error of the Wald is in parenthesis. Whilst the chi-square test statistic is in square brackets, that for the level of probability is in curly brackets. The chi-square statistic of Wald is important. As F statistic is to the t- or z-test, so the chi-square test is to the Wald test. The Wald statistics for GDPPC and GDPPC2 is negative and statistically significant at a p-value less than .01 likewise the chi-square test (model A). For model C, the Wald improves slightly. The same goes for model E although the chi-square test for Wald is not valid. Using the valid chi-squares tests, Africa is found to be in the early part of stage III of development within the investment development path framework. With time and as GDPPC grows, the level of negativity of NOFDI declines slowly.
Wald Statistics for the Coefficients of the Income Groups.
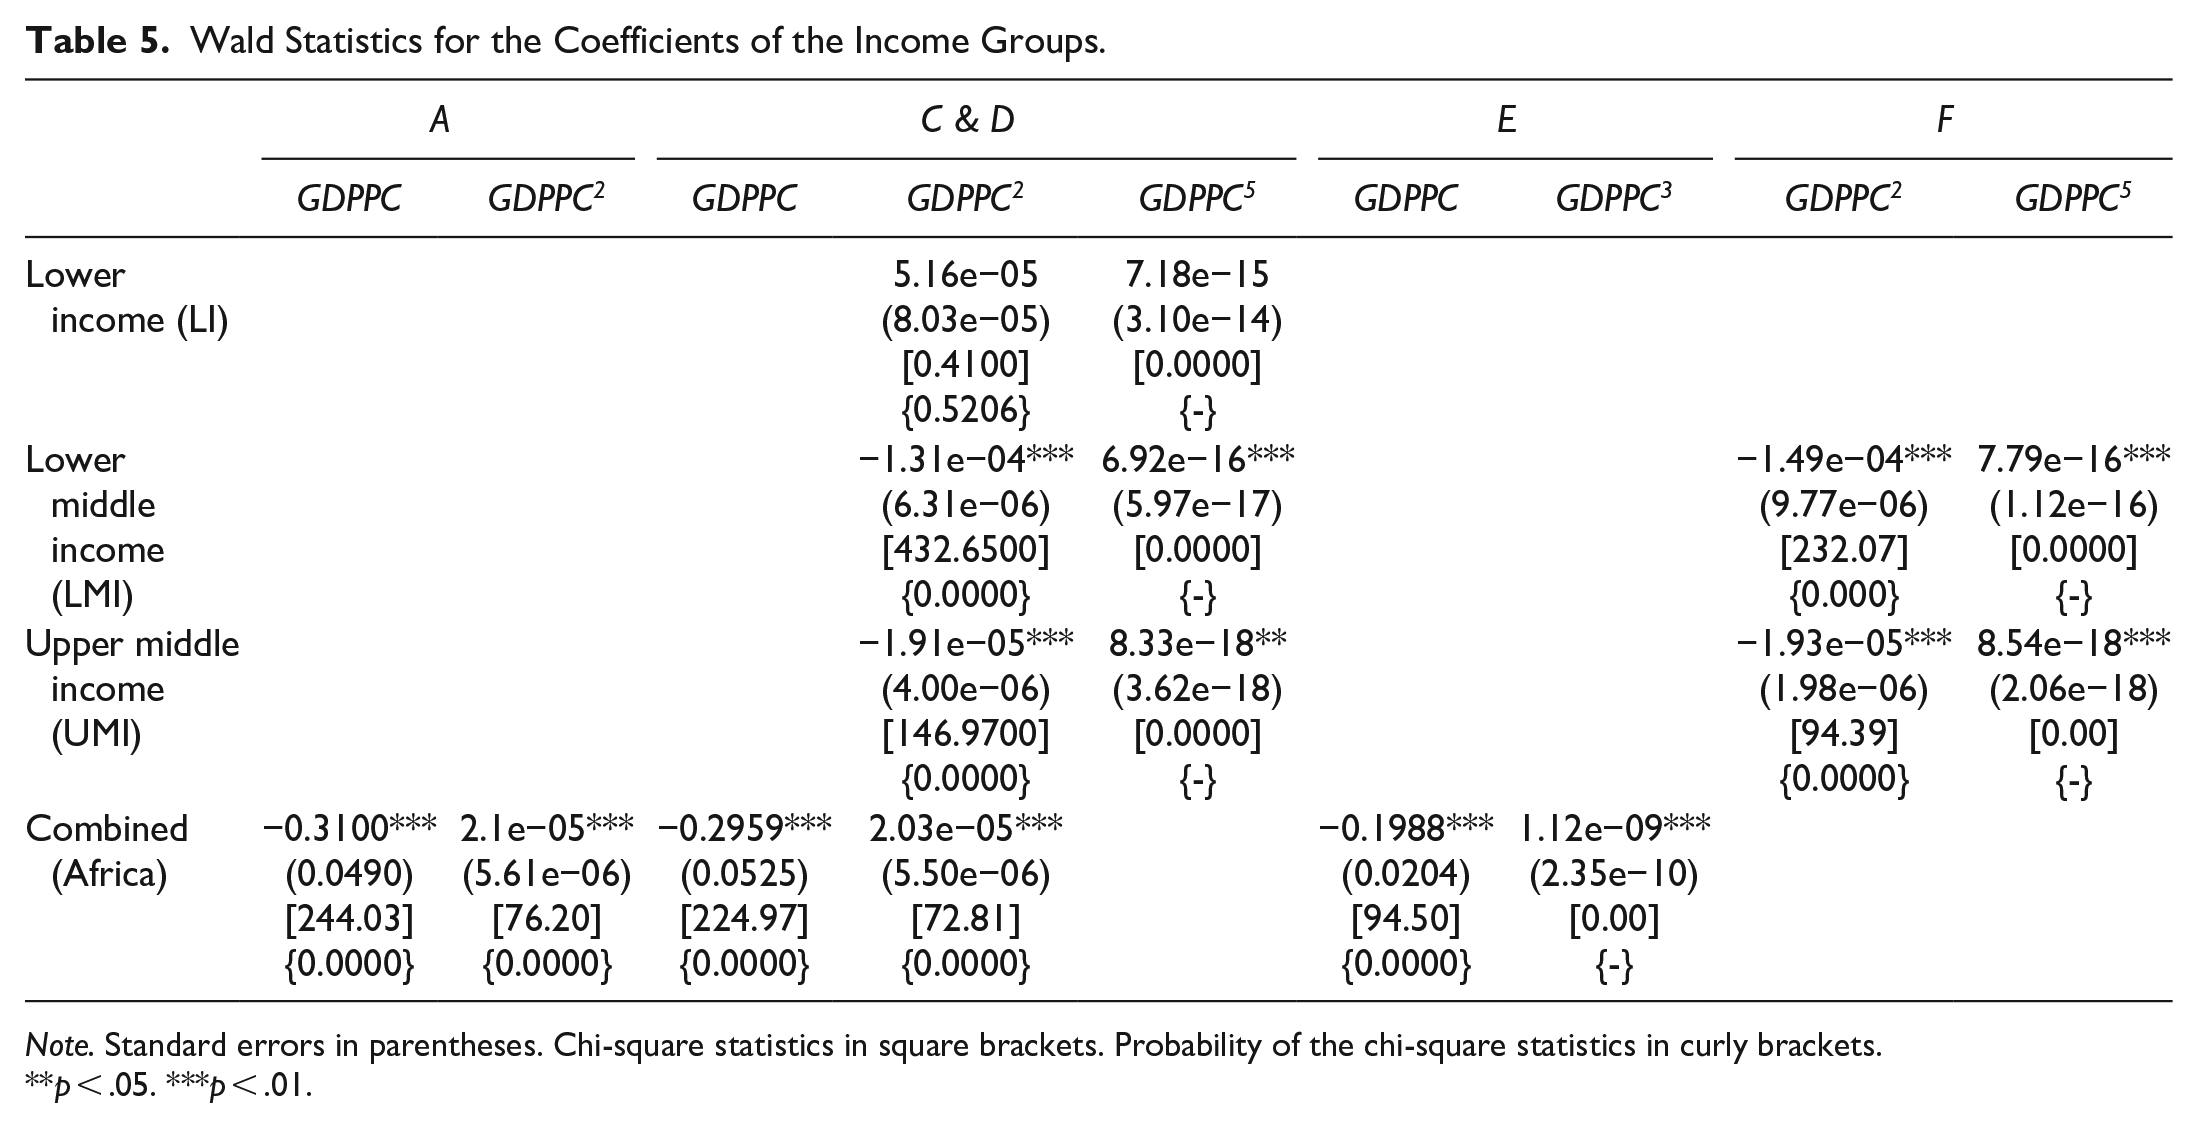
Note. Standard errors in parentheses. Chi-square statistics in square brackets. Probability of the chi-square statistics in curly brackets.
p < .05. ***p < .01.
Specifically, there is a gradual decrease in the rate of growth of inward foreign direct investment, and a surge in the rate of growth of the outward foreign direct investment. This results in increases in net outward foreign direct investment. This can be explained by the ownership, locational and internationalisation paradigm (Dunning, 1979, 1980, 1983; Dunning & Rugman, 1985). The technological capabilities of the economy are getting more geared toward the production of standardised products. As incomes rise, consumers tend to demand higher quality products, spurred in part by the increasing competitiveness among firms that supply the products. As a result, the comparative advantage of labor-intensive activities will decline, wages within the economy would rise, and outward foreign direct investment will seek a location in economies at lower stages in the investment development path (Dunning, 1981a, 1981b, 1982, 1988a, 1988b, 1986; Cechella et al., 2012). Also, the original ownership advantages of foreign firms start to get eroded, as firms in the domestic economy acquire their competitive advantages and compete with foreign firms in the same economic area. The competition from domestic firms would erode the initial ownership advantages of foreign firms. Due to increased expenditure on education, vocational training, and innovatory activities, created stock of assets of the host country would grow (Cechella et al., 2012; Dunning, 1981a, 1981b, 1982, 1988a, 1988b, 1986; Kuzel, 2017). As the domestic economy does not rely on natural resources but more and more on intangible assets, domestic firms begin to internationalise. This is done through exports and then develops into an outward foreign direct investment when they increase the sales in foreign markets or if the costs of production in the home country increase (Ciesielska & Frąszczak, 2014). Essentially, domestic firms look to efficiency-seeking and strategic asset-acquisition than to resource- or market-seeking investment. It must be noted though that those African countries may well be at the early stage of these occurrences.
Stage III found deviates from the investment development path theory that places developing countries in stage I or II. Dunning (1986), Frenken and Mbuvi (2017) as well as Satoglu (2017) found stage II for developing countries. This is one stage ahead of Central and Eastern European countries (Boudier-Bensebaa, 2008; Duran & Ubeda, 2001; Gorynia et al., 2010b; Kalotay, 2008; Paul, 2014). This finding is like the stage III reported for economies in transition (Andreff, 2003) and developed countries (Ciesielska & Frąszczak, 2014; Frenken & Mbuvi, 2017; Gorynia et al., 2019; Kosztowniak, 2019; Kuzel, 2017). It is worth noting that the stage of development in the investment development path theory is dynamic. Thus, with time, a country or group of countries can move from one stage to the next.
Turning to the Wald for the income categories, the chi-square tests for the GDPPC5 are not valid whilst those of GDPPC2 are. For the lower-income category, the Wald are −1.31e−04 and −1.49e−04 for models D and F, respectively. These values are close to 0, the turning point of the quadratic curve. Therefore, lower-middle-income countries are in stage II. The Wald (gradient) of the curve is smaller than the −0.2959 and −0.1988 respectively. This is evidence that the lower-middle-income countries show an enhanced position within stage II. Turning to the upper-middle-income countries, the gradients of the curve are −1.91e−05 and −1.93e−05. These are also higher than those of the gradient of the combined Africa estimation. This also means that upper-middle-income countries in Africa show an enhanced position compared to the countries combined. A close examination of the Wald shows minuscule increments in magnitude from model D to F. Also, the Wald for upper-middle-income countries is lower than those of lower-middle-income countries. This implies that, within the stage of development, upper-middle-income countries are ahead of lower-middle-income countries. This is not surprising as the gross national income of upper-middle-income countries is within the range of $4,046 and $12,535 whilst that of lower-middle-income is $1,036 to $4,045.
The stage of development shown by the Wald of the level of income categories is also the same as those determined by the combined estimation for Africa. Gross domestic product per capita is a component of gross national income per capita, the basis of the segregation of countries into income classes. Thus, there is a correlation between gross domestic product per capita and gross national income per capita. The coincidence of the investment development path stage of development with those for gross national income is therefore plausible. The difference in the specific positions shown by the levels of the gross domestic product per capita and gross national income per capita can be explained. Gross domestic product refers to all the outcomes of the production activities of all permanent units in a country or economy within a specified time frame. Thus, it sums the value-added created by all permanent economic units (Bender, 2020; Dornbusch et al., 2017; Song, 2019). On the other hand, the gross national income is the gross domestic product plus net factor income, which is factor income from abroad less income paid to foreign factors (Knibbe, 2019; Neipelt, 2019; Song, 2019). Interestingly, the net factor income includes profits or earnings from investments abroad. The net factor income component tended to shift the exact position of the income class further. Indeed, it better determines the exact position of the country group within the stage of development within the investment development path framework.
Conclusions and Recommendation
We tested the investment development path theory for countries in Africa based on all income level classifications according to the World Bank. The data used is particularly useful for a couple of reasons. First, all the countries are classified as developing countries by the United Nations. Thus, all are expected to belong to the same stage of development, according to the investment development path theory. Second, countries belonging to all the income groups according to the World Bank are found in Africa, including Seychelles, the only high-income country. Thus, it is possible to explore the possible stage of development for all income groups. Third, at the time of submitting this paper, none of the regional studies analysing investment development path theory studied Africa as a region independently.
We found that African countries are within stages II and early-stage III of the investment development path. The use of income levels generally agrees with that stage decided by the investment development path framework. However, that of the income classification enhances the exact position, it shifts the position determined by the investment development path to the right. As the gross national income contains information not found in the gross domestic product, but related to international business, its use to identify the stage of development should be encouraged. Also, regarding the determination of the stage of development in the investment development path theory, levels of income, as classified by the World Bank gives a slightly better picture of the stage of development in the investment development path theory than the use of the trio-development classification.
In the investment development path literature, the use of the gross domestic product is ubiquitous. The study contributes to the literature as it shows that the use of the level of income designated by gross national income presents a clearer position of a country or countries in the investment development path theory. As the use of the level of income is more fluid its successful use in determining the position in the investment development path would be more current.
African countries in stage II should develop supportive businesses, make changes in the economic environment such as competitive cost of production. Governments should encourage foreign direct investment into sectors with weak ownership advantage of indigenous firms but relatively strong location-bound advantages. On the other hand, governments should promote outward foreign direct investment targeted at industries or sectors in which firms in the African countries have strong ownership merit but weak location advantage. Sectors with declining industries must not escape the attention of policymakers.
We used data on Africa, whose members are all developing countries. It may well be the case that transition economies and developed countries may behave similarly. This may be explored by further research. Specifically, countries outside the African continent can be included in the data and estimated.
The study focused on the use of the key variables without introducing some control variables of the net outward foreign direct investment. Although we did not expect that to significantly change the results, it would have provided additional assurance to the estimates. We consider this a minor limitation.
Footnotes
Appendix
Regression Diagnostics of Models Without Lower Income Countries Screened for Multicollinearity.
| Powers of GDDPPC specified | Highest VIF | Heteroscedasticity test | Serial correlation | Hausman test selection | AIC | BIC |
|---|---|---|---|---|---|---|
| Regression diagnostics of combined models screened for multicollinearity (C) | ||||||
| 1, 3 | 3.74 | 1.5e+05*** | 50.262*** | RE | 10,556 | 10,565 |
| 1, 4 | 2.42 | 7.3e+30*** | 49.813*** | RE | 10,563 | 10,572 |
| 1, 5 | 1.91 | 6.8e+30*** | 49.353*** | RE | 10,567 | 10,576 |
| 2, 4 | 6.34 | 4.7e+31*** | 50.032*** | RE | 10,597 | 10,606 |
| 2, 5 | 3.83 | 6.0e+31*** | 49.450*** | RE | 10,603 | 10,612 |
| Regression diagnostics of combined models screened for multicollinearity (C) | ||||||
| 1, 3 | 4.87 | 5.0e+33*** | 48.940*** | FE | 10,380 | 10,398 |
| 1, 4 | 2.93 | 8.2e+32*** | 47.807*** | FE | 10,376 | 10,390 |
| 1, 5 | 2.20 | 9.9e+33*** | 46.686*** | FE | 10,374 | 10,388 |
| 2, 4 | 6.96 | 3.2e+33*** | 46.848*** | RE | 10,364 | 10,377 |
| 2, 5 | 4.04 | 9.7e+33*** | 45.832*** | RE | 10,353 | 10,377 |
p<.01
Declaration of Conflicting Interests
The author(s) declared no potential conflicts of interest with respect to the research, authorship, and/or publication of this article.
Funding
The author(s) received no financial support for the research, authorship, and/or publication of this article.