
Abstract
The main purpose of this study is to build from practice to theory by developing a flow chart of menu planning based on the practices of a single successful executive chef and then testing the generality of the flow chart by assessing agreement with flows by 10 other executive chefs working in similar environments. This paper involves deep observation of real-life practices of one 5-star executive chef and his associates using. Observation is based on the 5W2H1E approach. A flowchart of the menu planning process is developed based on data from observing. The research uses degrees-of-freedom analysis of responses from ten chefs in assessing acceptance of the flowchart structure. It is concluded that the flow chart is meaningful in that it is generally acceptable. Ideas from the research contribute to theory and have practical implications. Contributions and practical implications are discussed.
Introduction
Research Background
The puzzle of planning restaurant menus that are innovative, attractive, and within customers’ comfort levels for spending needs solving by continuous attention from executive chefs (Vargas-Sanchez & López-Guzmán, 2020; Victorino et al., 2005). Actions designed to solve the puzzle sometimes make it difficult for hospitality practitioners to differentiate their products and services from those of their competitors. Lack of differentiation can result in financial losses, market share losses, and other issues (Dan Reid & Sandler, 1992; Roy & Ballantine, 2020).
A menu communicates a restaurant’s values and capabilities to its customers (Ozdemir & Caliskan, 2014). Therefore, a menu impacts customer expectations and impressions (Antun & Gustafson, 2005; Kim & Magnini, 2020), influences buying decisions (Chang & Hou, 2015), and customer loyalty (Ryu & Zhong, 2012). In other words, menus are one of the key elements in the success of a restaurant (Chen et al., 2020; Mohammed Baiomy et al., 2013).
Research Problem of This Study
Based on the introductory commentary, one can see the importance of a restaurant’s menu to the restaurant being viable. In this context, if menu planning is a process that has a structure that can be recognized and if the structure has general applicability, finding a structure, and presenting it can have value. The literature shows processes exist in menu planning. One sees that planning involves multiple decisions, such as menu layout (Flessas et al., 2015), and presentation (Mohammed Baiomy et al., 2013). There are concerns such as when to change menu items, and who to involve in the decision making (Glanz et al., 2007; Hou et al., 2015; Ngan et al., 2020).
To capture the complexity of the phenomena of menu planning, a quantitative research method is problematic. The authors see the problem arising because quantitative analysis would involve assumptions about data structure where little is known. To avoid the quantitative analysis problem, a qualitative method employing inductive reasoning is used to obtain data that increases understanding of the menu planning process.
Purpose of This Study
The last section has introduced the idea that developing an understanding of the menu planning process has practical and theoretical value. Therefore, the main purpose of this study is to conceptualize the menu planning process in a useful way. The process can be examined from various perspectives. However, unless a restaurant’s offerings are controlled from outside the restaurant, a key player in menu planning is a restaurant’s executive chef.
This research could have proceeded by obtaining in-depth data from several executive chefs. However, we chose to get information from one executive chef. The information allows creating a menu planning flow chart that may be seen as applying to restaurants with similar planning needs. Our approach is to see if the flow chart of one successful executive chef, a flow chart which can be called a model, is in some respects used by others. In other words, testing that the flow chart of one successful executive chef is seen to be generally acceptable, at least for chefs operating in somewhat similar circumstances.
Our idea is that a flowchart for menu planning can help in dealing with the difficulty of knowledge transfer in the kitchen environment (Di Stefano et al., 2014), prevent loss of knowledge when employees leave, and help new employees adapt quickly to the menu related processes of their restaurant (Reichert, 2013; Seyfang et al., 2013). We see understanding the broad menu planning process as casting light on the dynamics of a general process for which recognizing details of subprocess can affect making menu change decisions.
Literature Review
Ozdemir and Caliskan (2014) conducted a review of restaurant menu literature. They listed five topics that are discussed in the literature: menu planning, menu pricing, menu designing, menu operating, and menu development. Some people see each of these as important. However, proceeding with research that is based on 5W2H1E, all five in one, would be material for a book, not a paper.
Studies on menu design (Horng et al., 2013; Lee et al., 2019) tend to focus on how to improve the creativity of employees. To the knowledge of the authors, research on menu planning processes does not appear in academic journals. There is a study of factors affecting menu planning in the hotel industry (Malik & Kumar, 2013). The study was conducted in North India, and thus the religion of the guests became an important consideration. Also, the need for healthier food is a major concern identified in that study, but despite the increasing awareness of healthy eating (Jeong et al., 2019; Sonnenberg et al., 2013) it was not mentioned during the interview.
Past studies can be found that tackle the menu planning issue by using different methods. Kivela (2003) develops a Menu Planning Qualitative Variable (MPQV) to assist restaurant employees in their menu planning process. The study compares a control group that uses a traditional menu planning method and a group using MPQV. The group using MPQV found the MPQV tool useful. Some studies investigate the criteria used for the selection of menu items (e.g., Dodds et al., 2014; Glanz et al., 2007; Ngan et al., 2020; Ozdemir & Caliskan, 2014).
Regardless, no studies were found that investigated the processes involved in menu planning. Therefore, this study addresses that matter. This is done utilizing case study research, which is an inductive research method that builds theory based on practical cases (Woodside, 2010, 2019; Woodside & Wilson, 1999) The study of food service remains predominantly quantitative (Goonan et al., 2014). Case study research with mixed-method design allows exploration of a complex phenomenon (Campbell et al., 2014).
Method
The Theory-Building Process
To achieve the main purpose of this study, this paper employs the following three steps: (1) deep observation of real-life practice based on the 5W2H1E method, (2) building a flow chart model based on 5W2H1E method data, and (3) testing the flow chart model deductively. A flowchart of the menu planning process is the prime output of the case study (Stage 2). Stated somewhat differently, interview and observation data for a case are the information for creating a flowchart of the menu planning process. Moving from a case to being more general is based on using information from ten restaurants operating with similar circumstances to confirm the flowchart structure (Stage 3). Figure 1 encompasses the ideas just presented in showing how this research proceeds.

The synopsis diagram of the theoretical model for menu planning.
Research Object for Inductive Theory Building
This article is based on information from an executive chef of a 5-star hotel restaurant, who also co-owns two other restaurants, and from some of his subordinates. The reason for the selection of a particular executive chef was the authors’ awareness of the chef’s knowledge, ability, and success. This chef knows about the menu planning process from extensive experience and diverse roles in the restaurant industry. At the time of data collection, he was just 43 years old but had already shown great abilities.
The key matter is that the particular executive chef chosen has extensive experience in menu planning and his success suggests what he does in menu planning works well. This means information from him allows creating a flow chart showing what works for him. Given it is possible to review that flow chart with other successful chefs operating in a similar environment, analysis can show if the flowchart of one chef largely shows approaches that other successful chefs employ. In other words, at least for the environment considered, the claim that the flow chart is a good guide for successful menu planning can be accepted or rejected.
The 5W2H1E Method and Interviewing
Formal interviews with an executive chef regarding menu change were conducted in a semi-structured manner. An expanded version of 5Ws was used. The 5Ws is an interview technique that aims to elicit the information required to understand the context of a particular situation by asking questions involving why, what, where, who, and when (Perera et al., 2014). To broaden information gathering, the technique is often accompanied by How questions. Rather than referring to 6Ws (Gentile et al., 2014), some researchers (e.g., Chiou, 2013) introduce the How much (H) Effect or Evaluation (E), resulting in the abbreviation “5W2H1E.” Applications are found in journalism, police investigations (Gentile et al., 2014), and marketing studies (Zhang et al., 2013).
Based on the 5W2H1E method, a set of questions was prepared to examine the menu planning process. These questions were used to initiate and define the scope of the interviewing. The questions formulated are:
A: “Why” which includes: (1) Why do you require menu planning? (2) Are there multiple factors that contribute to the decision to re-plan a menu? (3) Which factor is the most significant one and why?
B: “What” relates to: (1) What kinds of tasks are involved in menu planning? (2) Are there different stages involved in menu planning? (3) What are the considerations of menu planning?
C: “Where” involves: (1) Do you require special facilities or equipment to plan a menu? (2) Where does the menu planning normally take place?
D: “Who” includes: (1) Who decided that new menu planning should occur? (2) What people are involved in designing and planning a revised menu? (3) Who decides the final form of a revised menu? (4) Are there meetings for menu planning? If yes, which people are involved?
E: “When” addresses: (1) How often the menu planning occurs? (2) What triggers action on changing a current menu?
F: “How” is about: (1) Are there standard operating procedures for menu planning? (2) How is the menu planning conducted?
G: “How much” involves two quite different matters: (1) The financial and human resources the company devotes to menu planning and (2) there being company regulations that encourage employees to participate in menu planning?
H: “Effect or evaluation” includes related elements: (1) How is the effect of menu planning evaluated? (2) What are the obvious signs showing the degree to which menu planning works well or has problems?
Respondents and Deductively Testing a Model
It has been made clear that in this research developing a flow chart was only based on input from one executive chef and his subordinates. Although we indicate this is a case study, it is a case study in the sense that a model, flow chart, for the menu change process is developed for one case. However, input was obtained from an additional 10 executive chefs from different restaurants that present similar menu change challenges to those of the executive chef to whom the flow chart specifically relates. The context for chefs being similar was being an executive chef for a 5-star establishment. All 5-star establishments being in Taiwan causes a limit on generalizing about the applicability of the flow chart structure. Information relating to the 10 chefs being similar in general work and geographical situations is given in Table 1.
Context of Research Object and Respondents for Theory Building and Testing.

Note. Years = years of work experience relating to menu planning.
Woodside has been a person leading the way in some methods developments. His approach to dealing with generalization based on a case, such as relates to a flow chart based on a case, was to introduce using degrees-of-freedom analysis, DFA (Woodside, 2010). For DFA a prediction matrix is constructed. Based on the DFA approach, propositions based on a menu change flow chart are listed defining the rows of a matrix while responses about those propositions of agree or disagree are displayed in columns (e.g., see Table 3 in Wilson & Woodside, 1999). There are 10 columns for our 10 executive chefs that provide ratings. Our statistical analysis is based on the proportions of the 10 executive chefs that agree with particular propositions.
Results and Discussions
Data Collection and Developing a Flow Chart
Data collection from interviewing and observation of an executive chef and his associates took place during July and August of 2015. Data were collected in several ways. Primary data was, as already indicated, from extensive interviewing with one executive chef. Information from this chef was supplemented by information obtained by informal conversations with his subordinates. There were five interviews with the executive chef that ranged from 1 to 2 hours. The authors also sat in on two sessions of menu planning meetings. One of these was at the 5-star hotel restaurant where the executive chef providing flow chart information worked full time and the other was at one of the two restaurants he co-owned. Furthermore, there were about 20 hours of informal data collection involving conversations with subordinates and observation of the interactions between the executive chef and his subordinates.
Meticulous notes were kept so that information could be referred to later and the notes were computerized for use in content analysis. Where there were concerns about the accuracy of notes, accuracy was checked with information providers.
Inductive Theory Building: A Flow Chart From a Case
As introduced earlier, Figure 1 was prepared to provide an overview of the research approach being pursued. It shows moving from deep observation to inductive theory building. The key matter shown is that initial content analysis of information from interviews provided themes that support developing a flow chart.
In Figure 1, four stages relating to menu planning are shown. These are associated with the terms: “pre,” planning, implementation, and post. The pre-stage, according to the executive chef, is a regular activity. For him, pre-meeting issues tend to occur that quite regularly prompt monthly meetings to consider the need to decide on and, as necessary, plan for a menu change. During a monthly meeting, the appropriateness of the current menu is discussed. If the need for a revised menu is recognized, a planning process will commence.
What happens in the change consideration stage, which can involve planning for change, can be viewed as flowing from an initial, say monthly, meeting on the need for changing the menu. Work relating to revising a menu flows from considering making a change.
Given that action likely to result in changing a restaurant’s menu occurs, what is designated as the “implementation stage” is when action occurs that can result in a revised menu becoming the menu used. This stage involves information being collected to see if the revisions are having the desired consequences. The post-planning stage commences while a new menu is in use and involves evaluation using the information collected or being collected in the implementation stage.
Titles for stages are titles that need to be understood in the context discovered by the research. The sections that follow provide details about processes within stages and their relations that were recognized when information was put in the structured context shown in Table 2. In these sections, reference is made to components of Figure 2. Components can relate to continuing to the next stage or a consequence such as putting menu change on hold. In other words, the flow chart does not just address progress through stages but rather shows actions, considerations, and decisions.
Result Menu Planning Process.

Note. Probability given is probability based on a binomial test of .5, half, of the 10 chefs agreeing. The cumulative distribution function for the binomial distribution gives the probability of the number of agreements given or more as follows: for 10 p = .000; for 9 p = .001, for 8 p = .011, and for 7 p = .055. There is an issue of overall significance being due to chance. For example, with 30 responses if all are independent the chance of 10 occurring once is 30 times higher than if there is a single response. We do not pursue this because of the large number of .00 probabilities.
Means very significant.
Means significant.
Means not significant.
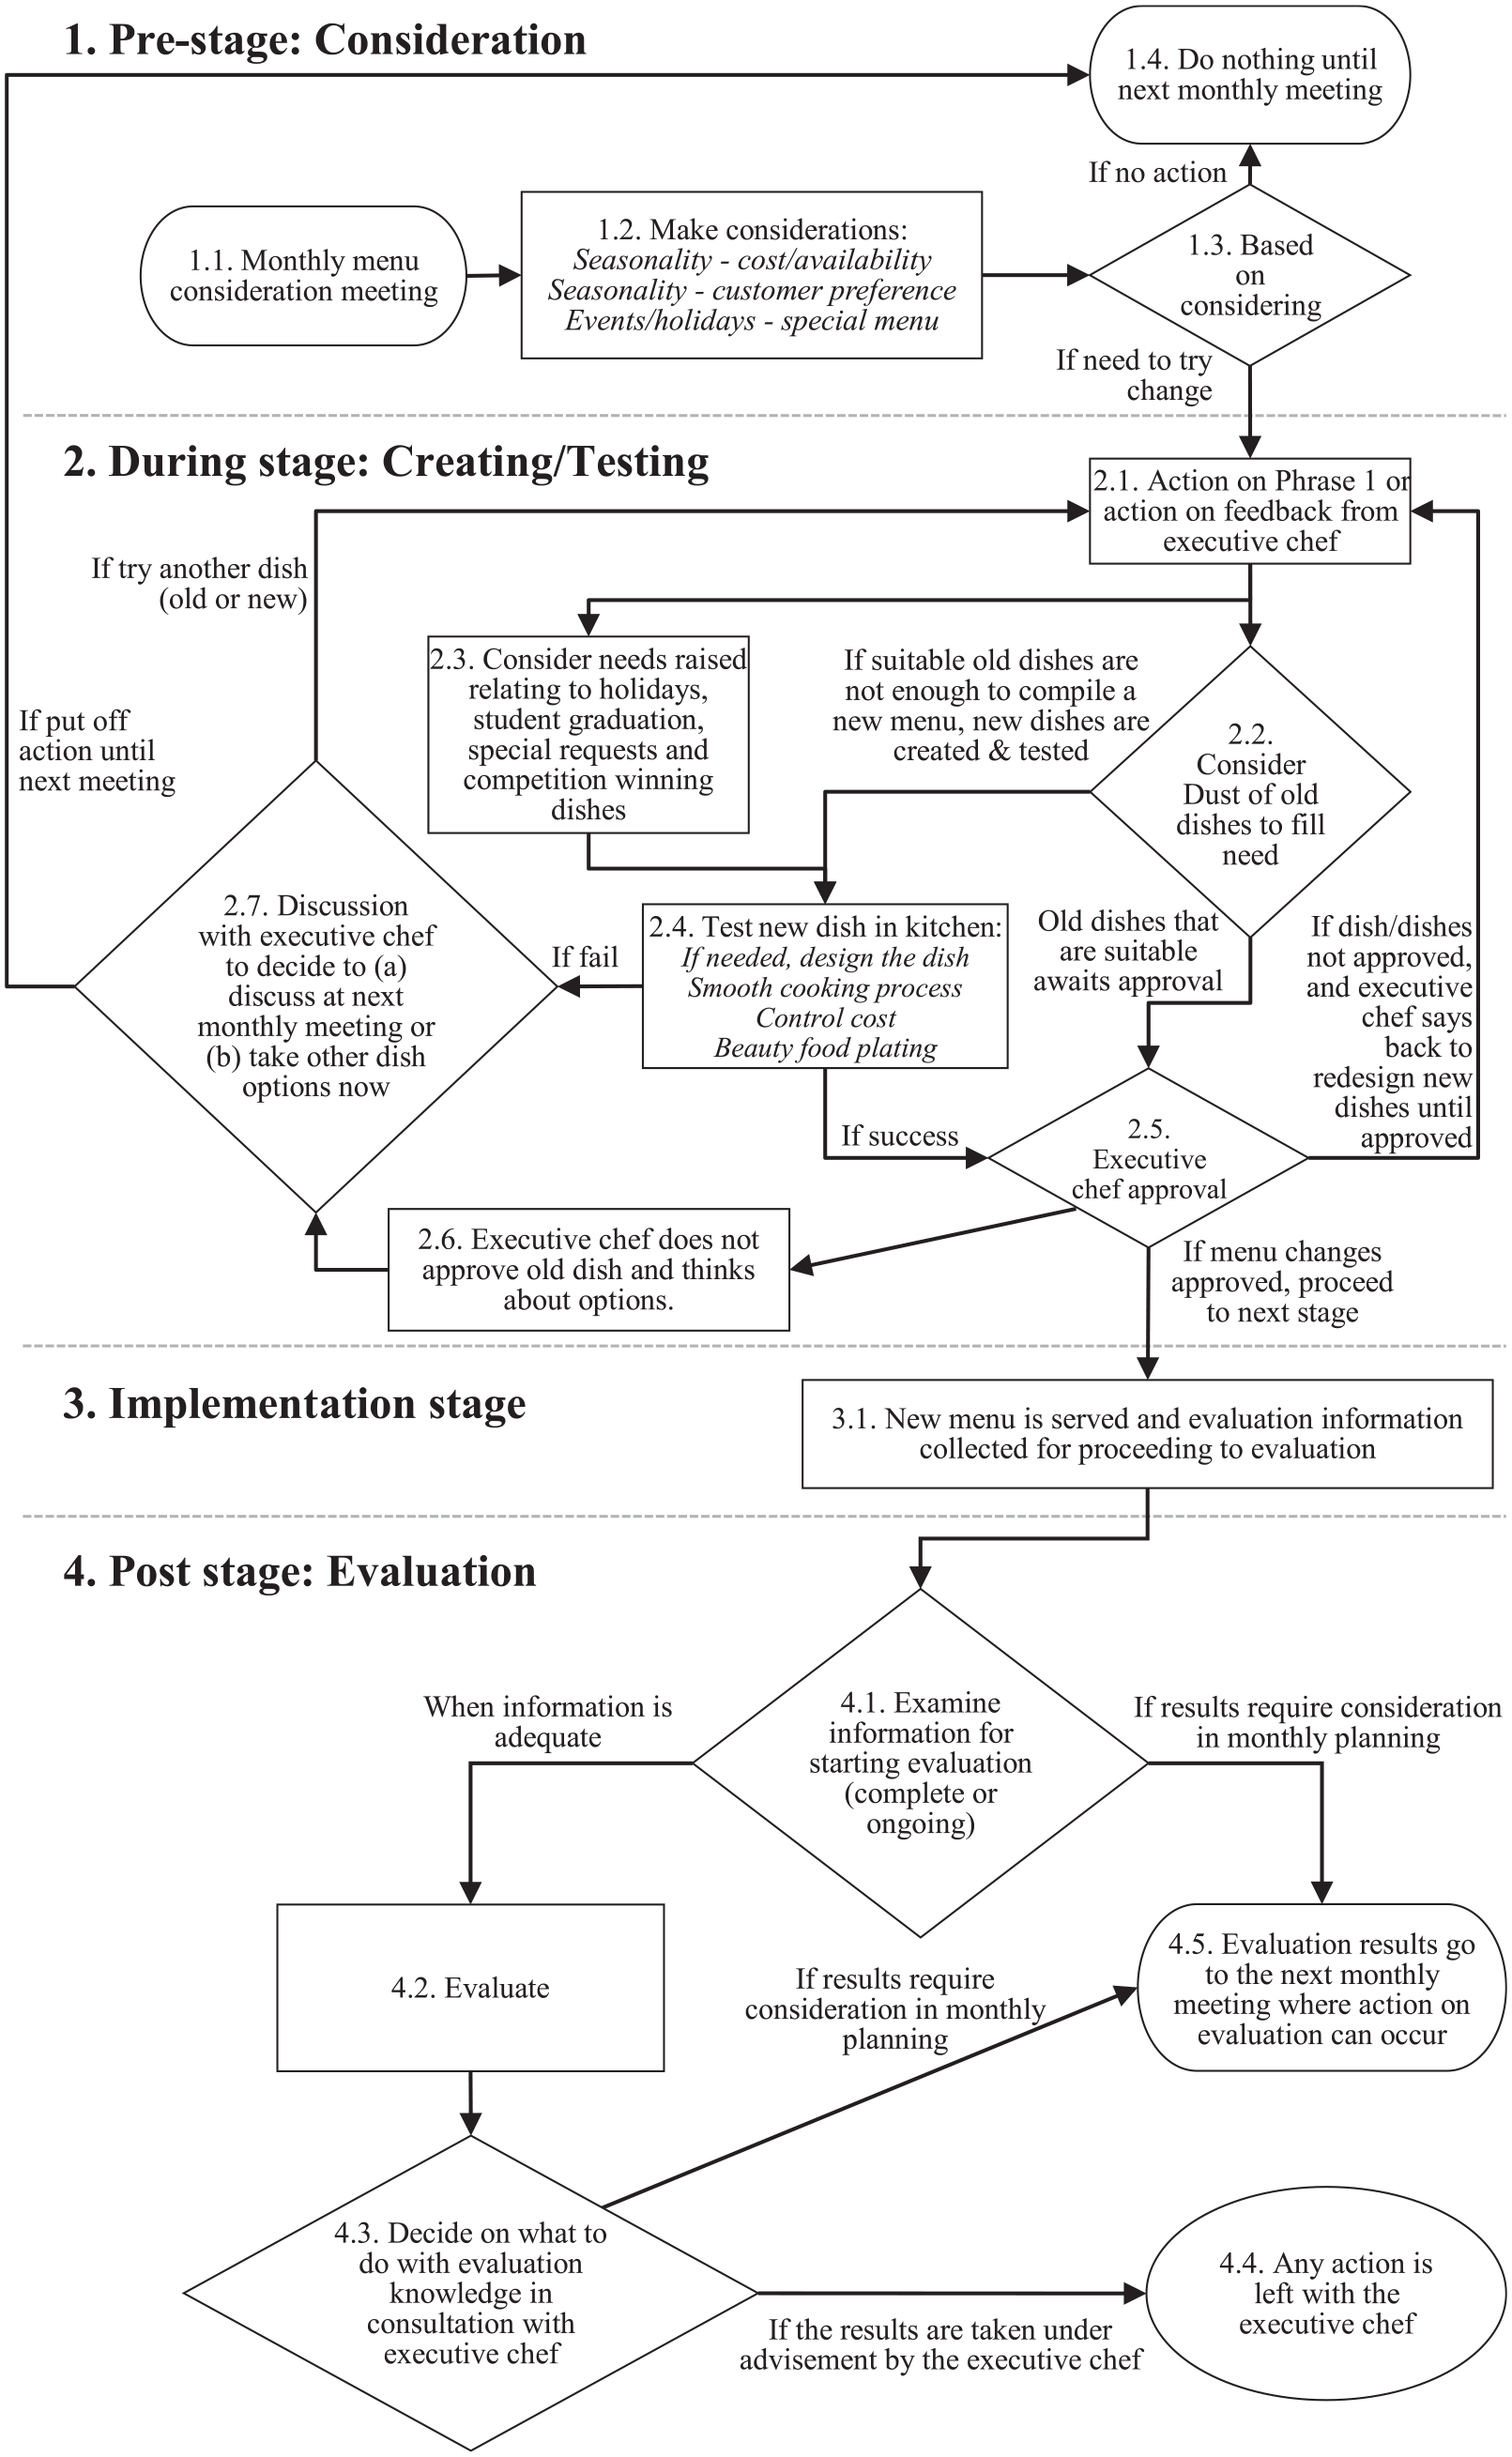
Menu planning process by the executive chef.
Structure in the pre-stage
The executive chef reported that topics regarding the need for a revised menu are a subject that comes up frequently. This can be during regular meetings or in more casual circumstances. This occurs even when reevaluating the suitability of a menu occurs almost every month (Step 1.1, Figure 2). When a meeting to consider menu modification occurs, topics raised before the meeting are typically part of what is discussed. There will also usually be a discussion of the changes in supply and consumer markets. It was noted that seasonality is often raised as a triggering factor that changes the cost and availability of raw materials. Seasonality also contributes to changes in customer preference. Furthermore, a consideration is taking advantage of events and holidays to offer a special menu to attract more patronage (See step 1.2).
Consideration leads to decisions on what is to happen. If it is decided that revising the menu should likely proceed or be seriously considered, the menu change process moves into the During Stage. In Figure 2 this is proceeding to step 2.1. Given consensus is that menu change should not be pursued at the given time no menu planning-related activity happens until the next meeting (e.g., a monthly meeting as per Step 1.4).
Structure in the planning, decision re menu change, stage: Creating and testing
Once the decision is made that changing the menu requires serious consideration, what has been designated as the planning stage (Figure 1) is entered. Here, planning has a broad meaning because changing a menu may not require much work or significant work may be needed to see if a change being considered is even wise to make. The very simple change is “dusting off (e.g., presenting differently)” one or more old dishes to achieve a revised menu (Step 2.2). Given old dishes that are suitable, particularly ones that can be presented somewhat differently, are proposed for change, this will be presented to the executive chef for approval (Step 2.5).
If making changes to old dishes is not seen as enough to meet menu change needs, planning involves considering one or more new dishes. The issue with new dishes is that they must be created and tested (Step 2.4). A somewhat separate line of consideration relates to holidays, student graduation, special requests, and introducing competition-winning dishes to a menu (Step 2.3).
One sees testing new dish steps converging at step 2.4. Information obtained showed that during Step 2.4, smooth cooking processes, cost control of menu item production, and beauty of plating are considered important in deciding on the acceptability of new dishes. When a dish is judged as acceptable, consideration of the dish must still proceed to the executive chef for approval (Step 2.5). If the executive chef does not approve a dish (Step 2.6), step 2.7 is taken.
Step 2.7 reflects the executive chef playing a guidance role. Given a dish is not approved, discussion with the executive chef is used to arrive at a course of action to pursue. What the executive chef can make clear is that with a menu in place, unless there is a serious (e.g., supply problem), it can be reasonable to decide to put off change. Given no new dish is accepted, nothing is “dusted off,” and an alternative new dish is not introduced, menu planning moves to the “pre” stage. In other words, the decision is that a menu change is off (i.e., moving to Step 1.4).
That an alternative dish to the one rejected should be considered may be raised but pursuing this action is an executive chef decision. Pursuing an alternative implies movement back to step 2.1. New considerations that are not introduced into the flow by the executive chef are potential topics for the next planning meeting (i.e., return to Step 2.1). Anyway, if menu change is approved by the executive chef, action on change moves on to implementation (Figure 1), which is Step 3.1 of Figure 2.
The implementation stage
As already introduced, the term implementation relates to more than giving a new menu to customers. Part of the discussion of menu change are reasons for it and expected consequences. After the executive chef approves a revised menu, the restaurant uses it. Using the revised menu is for at least a month before considering if using it results in desired consequences. Not having consequences justifying change makes changing the new menu a likely topic for the next menu planning meeting.
This research does not pursue decision-making about collecting information on if a revised menu is having the consequences expected. However, the executive chef and subordinates made clear that usually both formal and informal information collection about a menu being successful was planned for before a menu was handed to customers. Implementation, putting a menu in use, creates an opportunity to see both how customers react and if the costs and logistics relating to the menu change work out.
At this point, it needs to be made clear that the separation between the implementation stage and the evaluation or “post-stage” of Figure 1 (in Figure 2 stages starting at 3.1 and starting at 4.1) is not as clear as the figures may suggest. The very fact that some evaluation information comes from front-line customer service staff, some comes from the kitchen, and costing and revenue come from administrative sources means information streams that contribute to evaluating adopting a changed menu must be considered. Regardless, with implementation comes the collection of evaluation information for use in the “post” or evaluation stage.
The post-stage: Evaluation
As raised in the last section (4.2.3), evaluation is something that comes after making a new menu available to customers. It is when a menu is available and orders are being made that data collection for evaluation can begin. It may not take much time to find out a new menu causes unexpected kitchen or supply problems. Still, drawing management relevant conclusions about how a new menu is affecting patronage depends on why changes were made. If changes relate to special events or a season, it may be expected that customer reaction will only occur when the special circumstances that menu change caters to occur. When an impact is expected is a consideration in assessing kitchen, budget, and customer impacts.
The point is that Step 4.1 can be thought of as the beginning of evaluation but carrying out evaluation has multiple components. The executive chef reported on seeing a general process beginning while recognizing that he could be getting evaluative feedback from different sources at different times. He sees those involved in evaluation activities communicating when they see a need, which is not a detail we have tried to incorporate in the flow chart. He does sees himself, the executive chef, as the person to receive a variety of evaluations that he integrates.
In the context given, Step 4.2 is typically multi-component with components running on different tracks. Some information sharing is so natural it can be expected to occur. For example, kitchen problems were identified as having consequences for both customers and those serving them. Kitchen staff and serving staff are drawn into any evaluation by a matter of concern relating to both. Kitchen and accounting are drawn together in evaluation when costs are an issue.
When the information is adequate from the implementation of a revised menu, evaluation can start (Step 4.2). Deciding what to do with evaluation knowledge is part of the process. Consultation with the executive chef (Step 4.3) is where a final decision occurs. If the results of the evaluation require consideration in monthly planning, they go to the next monthly meeting where action can occur (Step 4.5). Ultimately, the executive chef decides what action to take and when.
The flow chart reflects information collected
What has been presented in this section shows how ideas presented by an executive chef and his associates lead to a flow chart for the menu change process. The approach has not been to explicitly provide material from interview transcripts and other information collected. The authors opted for the approach taken because the presentation approach used in Section 4.2 provides an easy-to-understand introduction to the flow chart. In pursuing options the authors found that trying to justify one thing after another by reference to notes or even using quotations hindered understanding the basis for the flow chart. The executive chef and his associates have seen what has been written and agree that it reflects what they said.
Testing the Flowchart Model Deductively
If this research stopped by presenting Figure 2 based on input from one executive chef and his subordinates, one would need to question the generalizability of the results. For that reason, though we refer to this as a case study, input from an additional 10 chefs was used to test the inductive model shown in Figure 2. Taking this step makes this a study using a mixed methodology.
Testing of “Figure 2” to see if 10 other executive chefs agree with the flowchart was done using degrees-of-freedom analysis, DFA (Wilson & Woodside, 1999, 2010). A prediction matrix was constructed based on the 5W2H1E questions used in interviewing and the preliminary general structure arrived at for the flowchart (Figure 1 and Section 4.1.1). The matrix has the four major components identified in Figure 1 as involved in the flow of the menu change process, which are the four major components of Figure 2 which are divided into “Steps.” Each step in Figure 2 was expanded into questions (shown in Table 2) that form the bases of the prediction matrix.
Members of the research team interviewed ten 5-star chefs with executive responsibility who worked in the Taiwan restaurant industry Taiwan and who had extensive experience in menu planning. Rather than confront these people with a questionnaire based on Table 2, some semi-structured questions were developed for conducting interviews. Furthermore, interviewees were asked whether factors or steps were missing from Figure 2. Finally, the interviewees were asked to complete a questionnaire with “yes” and “no” responses. The interviewers examined the yes-no questions to see if any follow-up questioning was required. The information and interview transcripts were computerized and shared among the members of the research team.
Tests associated with DFA were performed (Wilson & Woodside, 1999). Each row of the prediction matrix was assessed by considering the number of cases where the prediction is confirmed. For example, the first question is how often meetings regarding menu planning are held. There are 8 cases out of 10 showing that monthly meetings are consistent with their experience. The other two interviewees reported quarterly meetings. A level of significance associated with the proportion of positive responses was calculated based on the binomial probability of 8 out of 10 occurring by chance given p = .5. This is barely significant (Wilson & Vlosky, 1997). Still by the frequency of nine and 10 agreeing (Table 2) one sees there is general agreement with the menu planning process flow chart.
The interviewees reported two additional motives for revised menu planning. The first motive is the emergence of a trend. For example, healthier food is now a popular demand in many countries, which impacts food intake choices (Martínez-Monzó et al., 2013). The emergence of a new trend can be unpredictable. The trend can also have a very short life span. Still, restaurateurs tend to take advantage of a trend to boost their sales.
The second motive raised is some circumstances have been prominent recently. For example, a problem can arise with raw material sources. Animal diseases may affect restaurant patrons’ confidence in certain types of meat and change their dietary choices (Phuah et al., 2012). Another example is gutter oil (Lu & Wu, 2014), which is edible cooking oil manufactured from recycled waste oil collected from questionable sources. Dealing with the kinds of influences listed can force the restaurant industry to replace certain menu items.
Regarding the design phase of the menu planning process, the interviewees agreed with the processes shown in Figure 2. Some of the respondents; however, mentioned two other steps. One of them is “planning new inventory.” When a new dish is designed, it changes the amounts of ingredients required and so they have to re-plan what to stock in their inventories. The second step mentioned is “train and task assistants.” Cooking new dishes may require new procedures and the assistants need to be made aware of them.
The interviewees’ general agreement with the proposed flowchart for menu planning is evidence that the flow chart is appropriate to be applied to other cases.
Discussion
The interviews with chefs from different restaurants allow the study to arrive at conclusions about how chefs design new dishes. Creating new dishes require innovativeness and years of experience. As indicated in Figure 2, the study has divided the new dish creation into four stages, each with various steps. It should allow practitioners to design new dishes in a more structured way. Furthermore, having a flowchart for new dish creation allows chefs to share knowledge especially with younger chefs. This allows a restaurant to train chefs more efficiently.
Menu engineering is a complex endeavor with lots of decisions (Glanz et al., 2007; Hou et al., 2015; Ngan et al., 2020). If there are no standardized procedures and clear instructions to follow, the process can become disorganized. In accord with its purpose, this study provides guidelines for chefs in their new dish creation.
Conclusions, Contributions, Implications, Limitations, and Future Research
Conclusions
The main purpose of this study is to build from practice to theory by examining a case of menu planning from an executive chef’s perspective. What has been achieved shows the relevance of the well-known assertion of Lewin’s (1945) that “nothing is so practical as a good theory.” In so far as contributing to theory by building from practice to theory, one important step was showing one chef’s process had much in common with that of other successful executive chefs, at least in the case of 5-star hotel chefs in Taiwan. And, the authors feel Taiwan is not a necessary caveat but cannot prove that.
Presenting the process as a flowchart has facilitated understanding and communicating the process. Having one person’s process as a picture not only informs us of that person’s menu planning process but also helps us identify possible issues with the process. Still, since the ideas of the executive chef are corroborated by interviews with 10 chefs from other establishments, we can conclude that the flow chart is meaningful and ideas flowing from it have both theoretical contributions and practical implications.
Theoretical Contributions
The study contributes to the literature on building theory based on a practical case study research in several ways. First, it is among the first studies depicting the process of menu planning. It is the first based on lengthy in-depth interviews that allow the researchers to scrutinize details involved in the menu planning process in a way that a structured questionnaire never could. Furthermore, thought based on information from one executive chef and his associates, results are corroborated by results of interviews with 10 other highly experienced chefs.
Identifying the determinants that trigger the advancement of the menu planning process from one stage to the next is something else that is new to the literature.
Practical Implications
There are practical implications of this study for all business entities, restaurateurs, and hospitality professionals. Using a flow chart process model can be an efficient way to standardize a business’s procedures (Reichert, 2013; Seyfang et al., 2013). In the case of this study, it has been found that having the flowchart helps kitchen staff to understand what must be done during menu planning and what criteria need to be considered. More generally, businesses performing many different but interrelated tasks need information on the flow involved in performing those tasks or things can collapse when a key person leaves.
For all restaurateurs and hospitality professionals, though the idea may seem similar to that of the last paragraph, the flowchart proposed in this study can assist restaurateurs, at least high-end ones, and hospitality professionals in standardizing their menu planning process. It is not just “line” people and executive chefs that need to know what is going on in menu planning. The flow chart shows the involvement of people with a non-kitchen function. For example, for a new employee of a restaurant involved in purchasing, sales or other functions having the flow chart could be valuable as it guides their role in the menu planning including particular considerations that need to be made by them.
Limitations and Future Research
There are limitations for generalizing this case study research because the flow chart was developed based on one executive chef and tested by examination by another 10 executive chefs operating in similar conditions. Therefore, testing is needed in other conditions. For example, establishments that offer food and beverage can be categorized based on their characteristics. Characteristics influence menu planning. Haute cuisine restaurants to which the flow chart applies may be required to change their menu regularly while “burger joints” or other types of restaurants may have little need for change. This means research is needed on circumstances to which the flowchart is applicable. There may be a variety of flow charts that apply to different types of restaurants.
The data collection did not pursue important matters relating to trends, though interviews involved mention of trends. As we see it now, the study focused on the status quo. New studies need to pursue the dynamics of the menu change process. Restaurants are responding to trends such as having healthier food. This may affect menu planning at the level of quarterly or annual meetings. Consumer trends can be a topic to address with shareholders/owners or other non-kitchen-related personnel. Considering trends over a significant period involves developing an expanded model.
This study focused on and was limited to restaurant chefs and associates. It did not pursue a consumer-centric approach. Researchers (Thomas-Francois et al., 2017, 2020) indicated that a consumer-centric service approach had greater success in engaging customers throughout the value chain—both forward (toward consumers of foodservice) and backward (toward suppliers of foodservice). Future restaurants studies can incorporate a consumer-centric approach tying customer engagement to the executive chefs’ menu planning processes.
Abdelmassih and Arendt (2020) have emphasized that cultural diversity and creativity should be considered in menu development. They focus on meetings and events which were an opportunity for conveying cultural diversity and inclusion initiatives. Because this study was conducted in Taiwan, cultural diversity was not considered in this study. Future studies can address cultural diversity. Given the importance of creativity in the menu planning process shows it, can be considered. Creativity may be necessary to deal with situations where it is important to appeal to customers of different races, ethnicities, religions, socio-economic statuses, and geographical locations.
Footnotes
Declaration of Conflicting Interests
The author(s) declared no potential conflicts of interest with respect to the research, authorship, and/or publication of this article.
Funding
The author(s) received no financial support for the research, authorship, and/or publication of this article.