
Abstract
This paper explores the performance of the world’s largest employment guarantee program, the Mahatma Gandhi National Rural Employment Guarantee Scheme in India, both nationally and through a sub-national-level comparison based on key performance indicators viz. (i) financial indicators, (ii) physical performance indicators, and (iii) inclusiveness indicators. The paper is based on administrative data taken from the Ministry of Rural Development from 2006 to 2019. Despite sharp increases in fund allocation, total expenditures, and utilization rates, there was deceleration in majority of physical performance indicators after 2016, including total person-days employment and person-days of employment per household, with wide variation in sub-national level implementation capabilities. The finding also rejects the falsity of saturation of MGNREGA work in the rural areas, which is reflected in a strong positive correlation between fund allocation and employment generation. Its broader objective of social safety net for vulnerable people in rural areas shows an achievement, although with some gaps in implementation.
JEL classification: H53, J43, P25
Introduction
According to the United Nation’s Millenium Development Goal (MDG) program, 270 million, or 21.9% of people out of 1.2 billion Indians, lived below the poverty line of $1.25 in 2011–2012 (United Nations, 2015). Given the magnitude of rural poverty in India, the Mahatma Gandhi National Rural Employment Guarantee Act (MGNREGA) was introduced in 2006 to provide casual employment to rural households as a safety net; to provide a reasonable source of income through public works in rural areas where poverty is widespread and there are no employment and income opportunities either in agriculture and non-agricultural sectors (Carswell & De Neve, 2014; Das & Maiorano, 2019; Esteves et al., 2013; Fischer & Ali, 2019; Narayanan et al., 2017; Tiwari et al., 2011).
Another critical aspect of the MGNREGA is that it is universally implemented in every village across all districts in India (Reddy et al., 2018; Reddy et al., 2014). Under this program, in recent years government has been emphasizing decent work conditions. There are provisions to facilitate increased women participation by providing worksite facilities such as crèches, drinking water, shade, etc. According to operational guidelines of MGNREGA, 2013 (Ministry of Rural Development, 2013), it has also been suggested that at least 50% of the worksite supervisors at all worksites should be women and special works which require less effort, and those that are close to their houses are to be given to pregnant women and lactating mothers. In addition to women, the program also emphasizes the participation of Schedule Caste (SC) and Schedule Tribe (ST) households as these households were with a low level of income and employment generation assets and also suffering from multiple correlated problems like widespread poverty, illiteracy, and landlessness, etc. One estimate suggests that SC and ST households share in poor is 43%, whereas they constitute only 28% of the population in India (Panagariya & More, 2013).
However, one must bear in mind that MGNREGA is designed only as a rudimentary right. If we raise the question of whether “the right to work” as enshrined in the MGNREGA is a “right to a job” or “right to employment”, the answer is quite clear. MGNREGA does not guarantee a regular job. It only guarantees certain minimum days of work at an assured minimum wage to enable the underemployed or unemployed workers to earn a certain minimum supplementary income to overcome deprivation or distress migration. However, as a result of MGNREGA, the workers enjoy higher wages, and their holding of job cards has given them a sense of job security. Its effectiveness is clearly visible in providing employment to rural households and to migrant workers returning to the rural areas during the COVID-19 pandemic.
While the MGNREGA provides direct employment, the works executed are expected to increase the development potential by creating assets. The caveat is that quality of employment and productivity of work is critical in enhancing the content of any attempt toward the right to work (Rodgers, 2009). It has recently been proposed that under the scheme of MGNREGA, at least 60% of the works are to be taken up at the district level toward creating productive assets directly linked to agriculture and allied activities through the development of land, water, and trees.
Many studies (Drèze, 2008; Dutta et al., 2014; Khera & Nandini, 2009; Papola, 2005; Ranaware et al., 2015; Reddy et al., 2010, Nagaraj et al., 2018) on MGNREGA have concluded that the program has (i) reduced distress migration among rural poor, (ii) smoothened rural consumption in the lean season (iii) set high standards in transparency, (iv) addressed under-employment problem (v) created assets that improved livelihoods, (vi) gave a boost to the financial inclusion, (vii) strengthened local governance, (viii) improved the wage levels in rural areas and thereby increased the income levels of the poorest of the poor, (xi) set standards for decent working conditions, and (x) helped bring fallow lands into cultivation.
Given the complexities involved in the implementation of a rights-based program of the scale of MGNREGA and the differential implementation capabilities and success achieved by different sub-national (India was divided into 28 states) levels over time (Chopra, 2019; Das & Maiorano, 2019; Fischer & Ali, 2019; Narayanan et al., 2017; Varman & Kumar, 2020), this study explores the question of how the program has been performed since the time of its inception till date. We base the analysis of specific key performance indicators against the stated objectives of the program. Since it is essential to understand the utilization of funds and its outcome, the study also analyses the relationship between total expenditure, fund allocation, fund utilization with employment generation across states.
The specific research questions of the paper are as follows:
What is the extent of progress of MGNREGA since its inception in terms of budget allocation, utilization of funds, and output indicators?
To what extent does the MGNREGA program provide inclusion to the marginalized populations?
What is the trend of MGNREGA wages over time in real terms?
What is the extent of the inter-state differences in budget utilization, employment generation, and inclusiveness?
This paper is divided into four sections. The first section covering the introduction provides some stylized facts about the MGNREGA program. Section II deals with data sources and methodology. Section III provides insight into the macro-level implementation of MGNREGA in India based on critical performance indicators. Section III provides a comparative analysis of states implementing MGNREGA using the same arrows in the national-level study. Section IV ends with conclusions and suggestions for further research.
Data Sources and Methodology
This study is based on secondary data primarily drawn from the government of India official site of MGNREGA (https://nrega.nic.in/) covering the period 2006–2019. Data has been analyzed and computed using descriptive statistics. Also, compound annual growth rates have been calculated using standard procedures. Nominal values are converted into real terms by adjusting for inflation using agricultural labors’ consumer price index with 2001–2002 as the base year. Triennium Averages (TE) of the indicators are taken to smooth out the discrepancies in some instances. The ranking method has been used to evaluate the relative performance of the states. Also, Pearson’s correlation coefficient has been used to test the association among indicators. While assessing implementation performance, standard indicators used by the government of India for its performance information systems were used, which can be accessible from the MGNREGA website (https://nrega.nic.in/). The performance indicators were divided into (i) financial performance indicators, (ii) physical performance indicators, and (iii) social inclusiveness indicators. While calculating the financial performance, apart from the availability of funds, one of the key indicators for monitoring MGNREGA progress is observing its utilization. Therefore, allocation of funds, total expenditure, and percentage utilization are taken as financial performance indicators. While these indicators represent input variables, the wages paid per person day can be considered as output indicators under financial performance. The physical performance indicators included were total job cards issued, number of households provided employment, total person days of employment, number of households with 100 days of employment, number of MGNREGA work completed, and percentage of incomplete work. The social inclusiveness indicators included were the share of participation of SC, ST, and women. The performance of some indicators is also presented in graphs for meaningful state-level comparisons. The performance level is indicated through green, yellow, and red colours to indicate good, medium, and poor performance, respectively.
Results and Discussion
National Macro-Level Picture
Table 1 gives basic facts relating to the scheme coverage in terms of districts, person-days of employment generated, expenditure, and the extent of inclusion of social groups since its inception. Rapid progress is observed in the first 4 years from 2006–2007 to 2009–2010 because of the increase in the number of districts’ coverage. By 2009–2010 all the rural districts in the country were brought under the scheme, and by 2017–2018; 686 districts are under the ambit of this program.
Implementation of MGNREGS: A Macro Picture.

Source. Author’s estimation from MGNREGA data ( www.nrega.nic.in as of Feb 2020).
Note. We first provide a detailed analysis of financial performance indicators followed by physical and inclusiveness indicators in that order. HH = household; OB = opening balance.
Financial indicators
Figure 1 explains the allocation of funds, total expenditure, and the percentage of utilization that are overall reflected as input indicators. The allocation of funds trends shows a steady increase from 2006–2007 to 2010–2011. It declined from its level in 2010–2011 till about 2015–2016. It has, however, increased in recent years, touching the highest in 2017–2018. The total expenditure shows a similar trend. The total annual expenditure was reduced from Rs.39,778 crores in 2012–2013 to Rs.36,025 crores in 2014–2015, while for 2016–2017 and 2017–2018, expenditure increased up to Rs.58,063 crores and 63,649 crores respectively. The utilization rate of funds has been volatile, ranging between 73% and 83% between 2006–2007 and 2011–2012. It has increased mostly from 2012–2013 to 2017–2018 and after that remained stable.
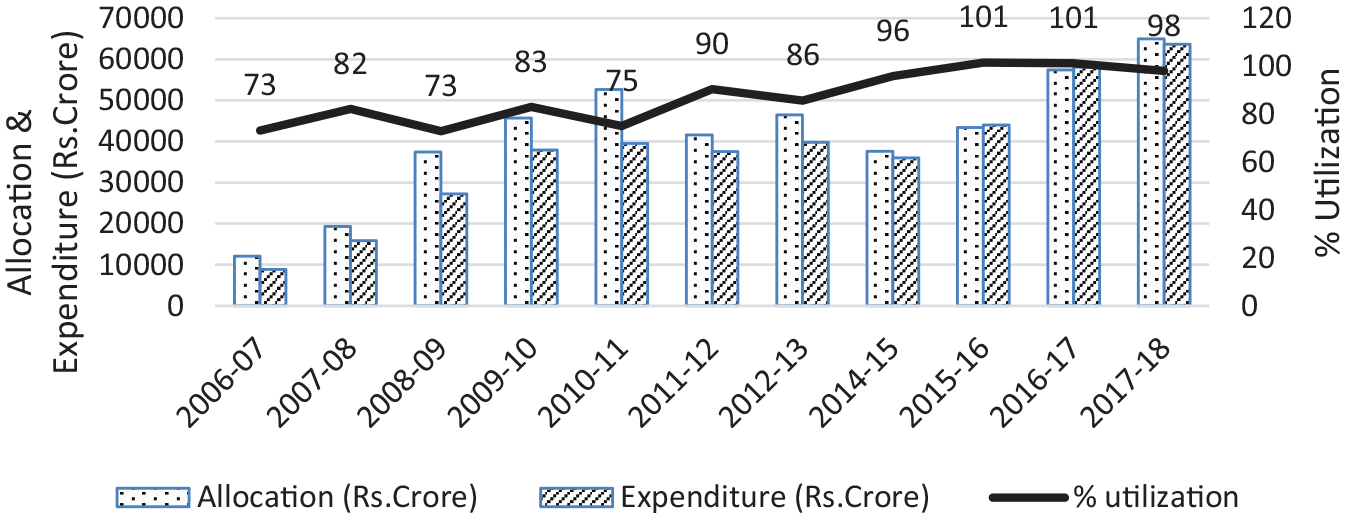
Total allocation of funds, expenditure, and % utilization.
In terms of money wage paid to MGNREGA workers, which works as an output indicator, the person day wage (in nominal terms) showed an increasing trend over the years, while the trend in real wage remained almost stagnant (Figure 2). To examine the difference in the growth rates of wages in nominal terms and real terms, compound growth rates are computed for two-period analysis (2006–2007 to 2011–2012 and 2012–2013 to 2017–2018) as well as for three-period analysis 2006–2009, 2010–2013, and 2014–2017) (Table 2). In both cases, nominal wage has been found to increase at a decreasing rate, while the real wage growth is negligible. Therefore, it is evident that there is not much change in wage rates in real terms. Sometimes it is argued that MGNREGA has been one of the factors contributing to an increase in rural wages (CACP, 2012). But a study has also found that MGNREGA is not the sole factor responsible for the observed rural wage increase. The non-farm wage growth has outpaced the MGNREGA wage impact (Nagaraj et al., 2016).

Trend in MGNREGA wage: nominal and real wage (Rs./day).
Compound Annual Growth Rate (%) of Nominal Wage and Real Wages.
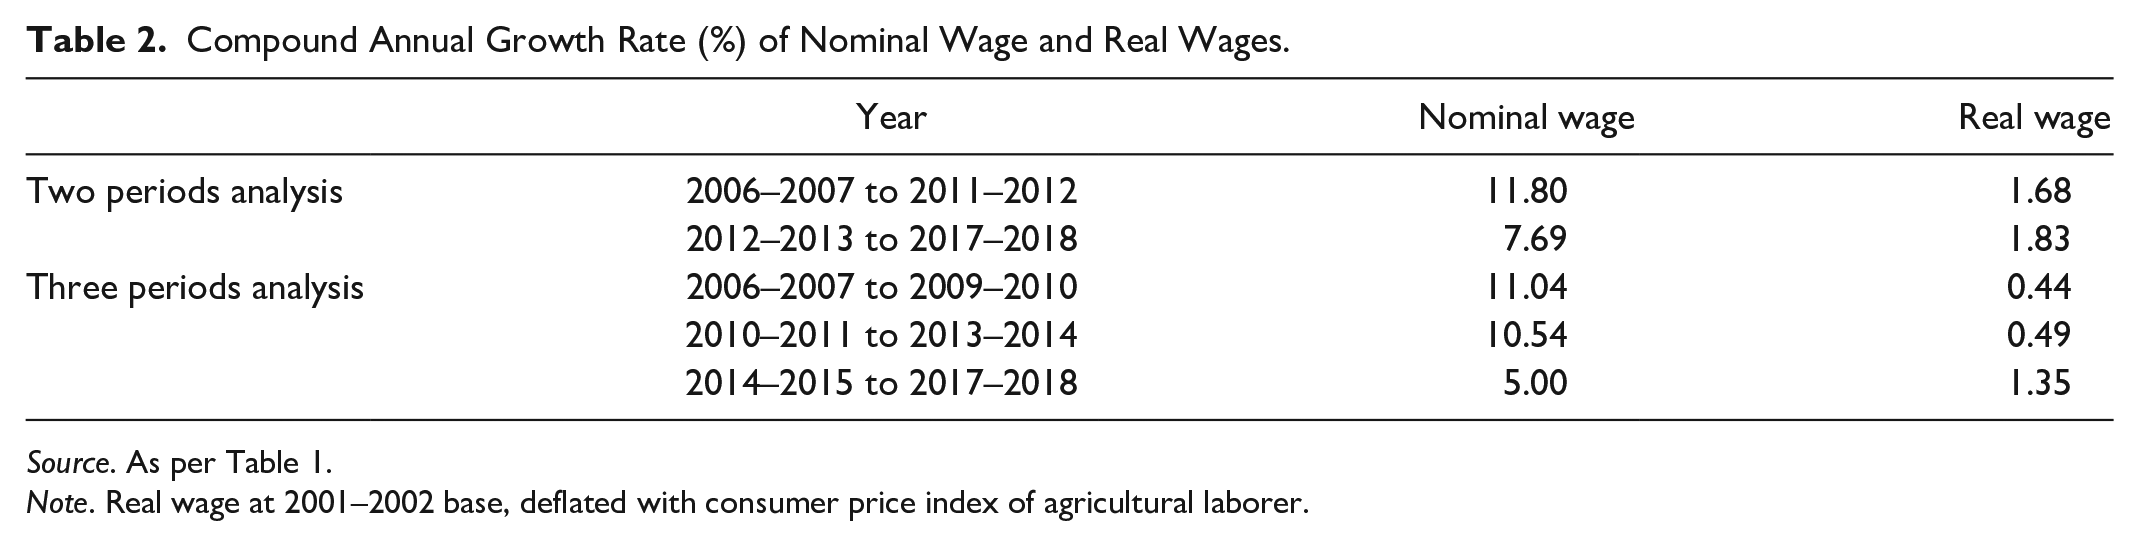
Source. As per Table 1.
Note. Real wage at 2001–2002 base, deflated with consumer price index of agricultural laborer.
Physical indicators
A look into the activities taken under MGNREGA shows that, during the initial implementation periods from 2006–2007 to 2009–2010, shows around 50% of the works got completed out of the total works (Figure 3).

Proportion of MGNREGA work completed (2006–2007 to 2017–2018).
In 2009–2010 the ratio hit the maximum (67%). After that, the proportion continued to decline and reached its lowest at 14.5% in 2014–2015. In recent years, 2017–2018, it shows a moderate increase of 18%.
The total number of job cards issued has been found to increase at a much higher rate in the initial three years, after which the growth slackened. (Figure 4). The program had started by issuing 3.78 crores job cards in 2006–2007, and gradually it had reached a maximum of 13.14 crore in 2013–2014. It has been hovering between 12.6 and 13.3 crores between 2013–2014 and 2017–2018, recording the lowest in 2014–2015. It indicates the saturation of job cards issued by the year 2013–2014.

Implementation of MGNREGS: total job cards issued (in Crore).
Table 1 shows that between 2006–2007 and 2017–2018, the number of households benefiting from this program has increased more than double. Figure 5 indicates that the number of households provided employment in India has gradually increased from 2006–2007 to 2010–2011. Although there is a decline from 2014–2015, the overall picture suggests that the demand for work under MGNREGA has increased and the number of households obtaining MGNREGA benefits has also increased. But, the number of households benefited reached the peak to 5.25 crore in the year 2009–2010, then reduced a little bit and stayed there even up to 2017–2018. Under the MGNREGA, every job card holder is eligible for wage employment against the demand for work. But it is disheartening to note that the actual households benefited (or provided employment) were consistently below the half-mark of the households’ job cards. Figure 5 compares employment generated under the program and the percentage growth in Gross National Income (GNI) during the same period. Theoretically, employment generation has to have an inverse relation with growth in national income as MGNREGA is basically a social safety net against low economic growth. However, Figure 5 shows that there is no strong association between employment generated and national income growth. Efforts should be increased to make MGNREGA a part of automatic stabilizers of employment which will respond to a decline in economic growth.

Number of households provided employment (in Crore) and % growth of gross national income (GNI).
Figure 6 depicts the total number of person-days generated. Total person-days of employment have increased steeply from 90.5 crores in 2006–2007 to 283.6 crore in 2009–2010. The decline was also steep between the years 2009–2010 and 2011–2012. The lowest, as with all other indicators were recorded in 2014–2015 (166.3 crores), after which it quickly regained to 235.2 crores in 2015–2016 and has remained stable thereafter. The decline in 2014–2015 could be attributed to the lower allocation of funds for the program compared to the previous year. The allocation of funds has declined from 42,103.9 Cr to 37,588.0 between 2013–2014 and 2014–2015. Since 2014–2015 was a pre-election year, political instability and government change might have contributed to low allocation.

Implementation of MGNREGS: total number of person-days generated (in Cr.)
In terms of the average person-days of employment per household, the value has increased from 43 in 2006–2007 to 54 in 2009–2010 but decreased thereafter (47 in 2010–2011, 46 in 2017–2018) and the trend has shown not much of variability after the increase of 2009–2010 (Table 1).
The proportion of households with 100 days of employment shows that the percentage was maximum in 2009–2010 (13.5%) (Figure 7). After that, it started falling and reached its lowest in 2014–2015, where only 6% of the MGNREGA households are getting 100 days of work. Though in 2015–2016, it starts to encompass more households with 100 days of work, but it has reached the lowest recently (5.84% in 2017–2018).

Implementation of MGNREGS: household with 100 days of employment under MGNREGS from 2009–2010 to 2017–2018.
Inclusiveness indicators
It is also evident that the social inclusiveness of the MGNREGA program has reduced over the years. Figure 8 depicts the participation of SC in the MGNREGA program. Person-days of SC employment increased steeply from 2006–2007 to 2009–2010, when it crossed 80 crores and significantly declined afterward. Concerning percentage share of SC in total person-days generated, we see that the first four years showed a moderate year-on-year increase. It significantly declined from 30.6% in 2010–2011 to 22% in 2011–2012. It has remained stable since then, right up to 2017–2018.

Implementation of MGNREGS: inclusion of marginalized population (Scheduled caste).
Person-days of ST employment initially increased for the first four years from 2006–2007 to 2009–2010, the highest being 60 crores approximately (Figure 9). After that, it has declined continuously to touch its lowest in 2014–2015, after which it increased slightly and remained stable between 2015–2016 and 2017–2018. It was roughly 40 crores only in 2017–2018. There is a steep decline in the percentage share of ST in total person-days from 36% in 2006–2007 to 16.3% in 2013–2014. It picked up marginally to 17.2% in 2014–2015 and has more or less remaining relatively stable.

Implementation of MGNREGS: inclusion of marginalized population (schedule tribe).
However, the program succeeded in making it gender-inclusive. Person-days of female employment have steadily increased between 2006–2007 and 2009–2010, it experienced a decline and hit the lowest in 2014–2015 (Figure 10). A rise has been observed again since 2015–2016 and has remained relatively stable since then. The percentage share of women in total person-days of employment generated by MGNREGS has been encouraging at about 40% since the commencement of the program, considering the fact that all India rural female labor force participation rate has always been below 40% since 2006 and has steeply declined to 23.3% in 2017–2018 according to Periodic Labor Force Survey report released by National Sample Survey Organization (NSSO) in May 2019.

Implementation of MGNREGS: inclusion of women.
Overall, notwithstanding the progress, especially in the first 4 years (2006–2007 to 2009–2010), there is a certain deceleration in the scheme in subsequent years. The total person-days employment and person-days of employment per household and share of SC and ST started decelerating after 2009–2010. The average expenditure per district too decelerated after reaching a peak in 2010–2011. The signs of deceleration within five years of launching the scheme are disconcerting especially when what is expected is acceleration with the experience gained. Most alarming is that deceleration has not stopped even during the drought years of 2014–2015 and 2015–2016.
Inter-State Comparison
Since India is a large and diverse country, the development path is not homogeneous across states, and some states are better in implementation capabilities than other states; a state-level disaggregated analysis with a national-level picture as a base help differentiate the factors that make a difference in performance.
Financial and physical indicators
Table 3 presents the performance of states concerning financial indicators and their association with important physical indicators. Other than fund allocation and expenditure separately, the effective utilization of funds can be judged more meaningfully through a change in net balance and percentage utilization of funds. The top three states incurring the highest spending in MGNREGA work in 2017–2018 are West Bengal, Andhra Pradesh, and Tamil Nadu.
Performance of States in Financial and Physical Indicators (2017–2018).
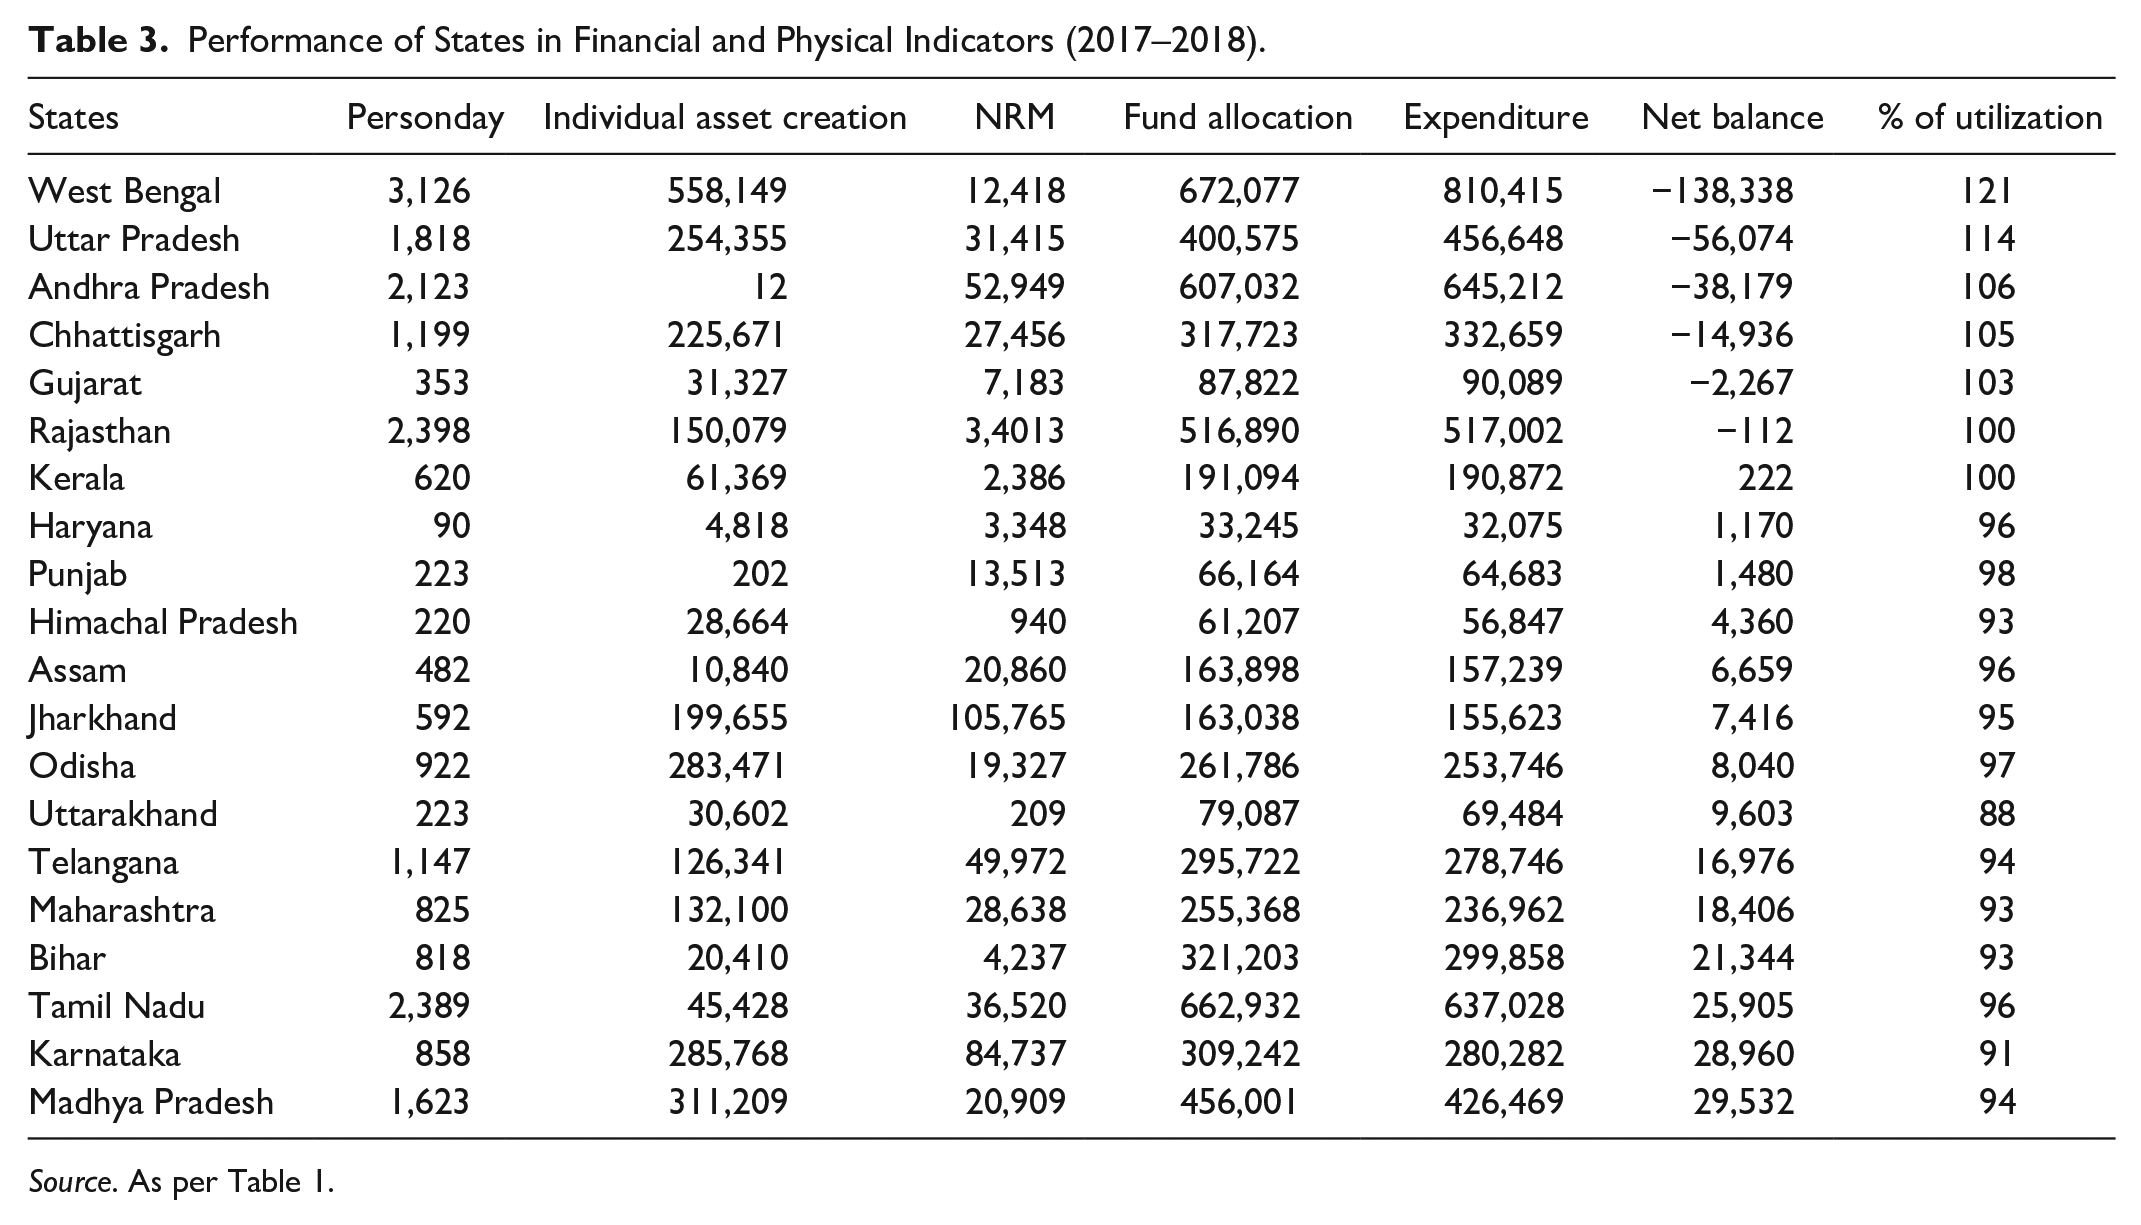
Source. As per Table 1.
If the potential for creating employment is a measure of the program’s success, West Bengal also ranked first in person-day employment generated, followed by Rajasthan and Tamil Nadu. Of course, only employment generation is not enough to negate saturation levels. The total asset creation through MGNREGA work is physical evidence of the utilization of funds. The asset creation through MGNREGA work is largely registered with Natural Resource Management (NRM) activities and individual asset creation. NRM activities include soil and water conservation-related works (including non-water-related works), ground water recharge-related works, irrigation-related works, drainage and other related works, plantation-related works, land related works for livelihood support. Individual asset creation activities include works for improving land productivity, plantation related works, rural housing and related works, and Infrastructure for the promotion of livestock. The possible association among the financial and physical indicators is presented in the following (Table 4) correlation coefficient matrix.
Correlation Coefficient Matrix With Financial and Physical Indicators Across States.

Source. Author’s calculation.
Indicates significance at 1% level.
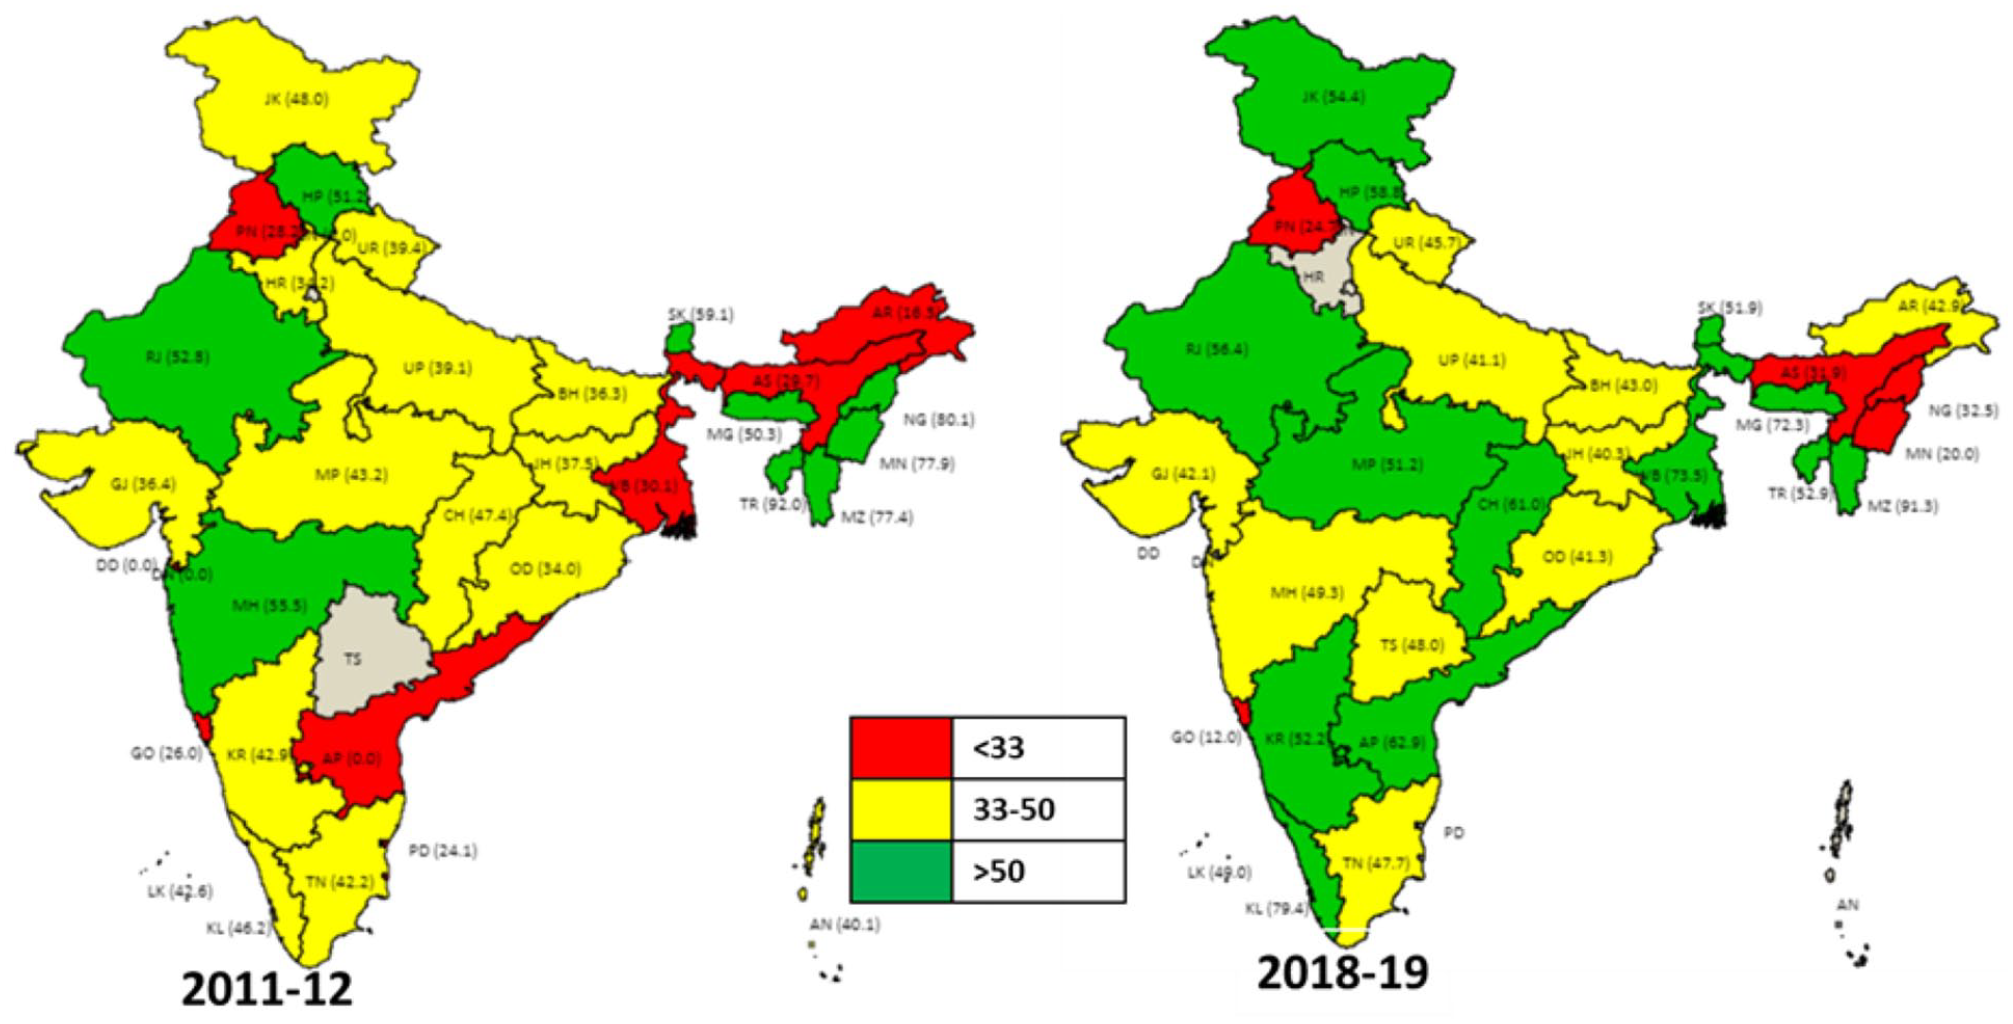
A positive association is observed between expenditure and personday generation. However, a strong positive correlation has also been found with fund allocation and employment generation outcomes. This finding rejects the falsity of saturation of MGNREGA work in rural areas. Again, this argument is strengthened by the positive and significant correlation of fund allocation with Natural Resource Management work and individual asset creation. Also, it is noticeable that overall, the net balance has a significant and negative association with personday generation, NRM activities, and individual asset creation, indicating that underutilization of funds leads to a lower outcome. The reverse is also true for few states like West Bengal, Uttar Pradesh, Andhra Pradesh, and Chhattisgarh, the overutilization of resources led to higher personday generation and NRM activities. Those states are also ranked higher with respect to personday generation than other states, which implies that funds allocated for MGNREGA work for such states are insufficient, and states are managing the cost of MGNREGA work from some other sources. Surprisingly, though Bihar and Karnataka are in two extreme poles in development parameters, they are similar in fund mobilization and person day generation. Karnataka did a commendable job with regard to individual asset creation and NRM activities. However, that work has not translated into economic opportunity and efficient utilization of funds. Another explanation could be given based on the proportion of incomplete work across states (Figure 11). Overall, it provides a convincing picture as there are no states with more than 80% incomplete work in 2018–2019. However, Both Bihar (49%) and Karnataka (44%) have less than 50% unfinished work. Higher asset creation, lower the proportion of incomplete works and could indicate higher saturation levels in Karnataka-hence, justifying the state’s deceleration in persondays and presence of unutilized funds. While in Bihar, the deceleration in personday with lower asset creation indicates the continual need for MGNREGA. Further, an in-depth study is required to understand the phenomenon.

Percentage of incomplete work (2011–2012 to 2018–2019).
Table 5 presents a comparative study of MGNREGA progress across states regarding the number of households provided employment, person-days generated, and person-days of employment per household during an average of triennium ending (TE) 2012–2013 and TE 2017–2018. To smooth out the discrepancy over the years, the triennium averages are taken. The states are arranged in descending order of person-day per household.
Progress of MGNREGA: A Comparison of TE 2012–2013 and TE 2017–2018.

Source. As per Table 1
Among the three top-performing states in terms of the number of households provided employment, Tamil Nadu (63.3 lakhs) ranked first, followed by West Bengal (56.9 lakhs) and Andhra Pradesh (50.6 lakhs) in TE 2012–2013. A similar position continued in terms of person day generated. In TE 2017–2018, Tamil Nadu and West Bengal maintain their first and second positions in employing households by the amount 60.6 lakhs and 58.6 lakhs, respectively. The reason could be attributed to the greater allocation of funds for both the states. While studies like Sharma and Didwania (2013) found a positive impact of MGNREGA in Haryana based on field survey, the present study shows that Haryana is experiencing deceleration in major physical indicators like number of households provided employment, personday generated, person-days per HH, etc (Table 5). In 2017–2018, Haryana had the lowest personday generation (90 days) as presented in Table 3 despite 96% utilization of funds. One reason could be the lowest allocation of funds (Table 3). At the same time, further studies need to be conducted to know whether the state has reached the work saturation level or still scope is there to the extend the program in this state.
On the other hand, states like Punjab have experienced the highest increase in the number of households provided employment by 83.7% change over the years, followed by Karnataka (38.9%) and Odisha (37.5%). In terms of person day generated, Punjab is showing the maximum increase (by 98.4%) followed by Arunachal Pradesh (by 80.2%), Assam (by 74.2%), and Odisha (44.5%), respectively. In terms of the third indicator, the average person-days of employment per participating household, all the North-East states (except Arunachal Pradesh) came forward. The reason could be that the number of participating households is significantly less in those states and family size, in general, is considerable. Therefore, generating more person-days of employment in comparison to other states is possible. Within North-East states, Mizoram succeeded in creating maximum person-days generation, 78 days in TE 2017–2018 which is 26.5% higher than TE 2012–2013, followed by Tripura and Sikkim. On the other hand, Manipur has experienced a decline in average days over the periods.
We now present a state-wise analysis of households’ percentage with 100 days of employment (Table 6). Tripura has the highest percentage of households with 100 days of employment followed by Meghalaya and Jharkhand. Andhra Pradesh maintained its most elevated 4th position over TE 2014 and TE 2017. Surprisingly, Jharkhand has moved up its rank from 19th in TE 2011 to 3rd in TE 2017, while Kerala’s position has slipped to 10th in TE 2017 compared to its 2nd rank in TE 2014. Perhaps North-eastern states Tripura, Sikkim, and Meghalaya excel in terms of the proportion of households achieving 100 or more days of employment. Though Punjab progressed significantly with regard to the number of households that were provided employment (increased by 83.4% between TE 2011 and TE 2017) and person day generation (increased by 98.4%), however, the state perhaps requires lesser days of MGNREGA works that too only in off-seasons. The state is progressive with respect to higher level of farm and non-farm employment opportunities which offers more than double the wages for a casual labourer under MGNREGA. In Punjab, only 1.2% of the MGNREGA households got 100 days of employment in TE 2017 (Table 6). Under the given socio-economic conditions prevailing in Punjab, only those in real distress are likely to opt for works under the MGNREGA Scheme. These may not be relevant to Punjab as a measure of social protection.
Household With 100 Days of Employment (in %) Under MGNREGS With Relative Ranking of the States.

Source. As per Table 1.
Note. TE 2011: average of 2009–2010, 2010–2011, 2011–2012; TE 2014- average of 2012–2013, 2013–2014, 2014–2015, and TE 2017- average of 2015–2016, 2016–2017, 2017–2018.
A state like Gujarat showed lower performance than Kerala in many indicators of the performance of MGNREGA, although Gujarat’s rural wage rates are less than Kerala. This may be explained partly by the vibrant industrial development in Gujarat. But still, it seems Kerala’s grassroots level awareness, local governance, and active social movements must have contributed to better performance (Breitkreuz et al., 2017; Isaac & Sadanandan, 2020). In terms of the number of households provided employment and person-days generation, the state progressed by 22% to 25% during the study period. Still, only 2% of households are with 100 days of work.
Figure 12 gives a pictorial representation of the percentage of households with more than 100 days of employment concerning households provided employment. The high saturation of work in Karnataka is also evident with a greater proportion of households with more than 100 days’ work. The position of Andhra Pradesh has remarkably moved up with this respect. The higher fund availability, greater personday generation, and overutilization of funds of Andhra Pradesh support this positive move.

Percentage of households with more than 100 days of employment with respect to Households provided employment (2011–2012 and 2018–2019).
Similarly, Figure 13 shows the percentage of households that worked less than 15 days with respect to households provided employment, which has decreased between the two time periods. Notably, West Bengal has performed well in this respect. While in 2011–2012, more than 20% of households were employed for less than 15 days in West Bengal, the proportion had reduced by less than 10% in 2018–2019. The performance of physical indicators in West Bengal justifies this.

Percentage of households employed for less than 15 days with respect to households provided employment.
Inclusiveness indicators
We shall turn to social inclusion regarding the share of SC and ST households in the employment generated under MGNREGS. Similarly, the inclusion of rural women who share a major part in supporting livelihoods would indicate the program’s reach to the deserving category. Table 7 shows SC households in the total person days of employment created under MGNREGS during 2006–2007 to 2017–2018. The assessment of SC household’s participation in the MGNREGS should also factor in the relative share of the SC population in each of the states. The proportion of SC population varies from as low as 6.8% in Assam and 6.6% in Gujarat to as high as 37.5% in Punjab and 27.5% in West Bengal. For the country, there was a deceleration in the share of SC households in the total person-days of employment from 26.2% in TE 2009 to 21.7% in TE 2017. The decline in SC participation is maximum in Tamil Nadu (29.2%), followed by Bihar (26.2%) and Uttar Pradesh (23.2%). However, in all these years and almost all the states, the SC share in employment is higher than their population share. This is expected because most landless and land-poor rural areas that depend on wage labor belong to SC households.
Percentage Share of SCs, STs and Women in Total Person Days of MGNREGS Employment.

Census 2011.
As per Table 1.
Report on Employment and Unemployment Survey 2011–2012, Ministry of Labor and Employment. Usual Principal and Subsidiary Status.
The higher participation of SC households appears to happen at two ends of development. There is a kind of bi-polar tendency. On the one end, there are relatively better-off states where most of the MGNREGS participants are SC households. To this upper end of the pole belong Punjab, Tamil Nadu, and Haryana. At the bottom end are the relatively poor states, where the share of SC households is high. Uttar Pradesh and Bihar belong to this category. This suggests that at both ends of the development spectrum, these households suffered extreme exclusion. The first level of assessment is their inclusion in wage employment under MGNREGA, which is positive. The second level may be to assess the extent of benefits that flow to them through asset creation in their lands specified under the MGNREGS, and this needs field-level assessment, which is beyond the scope of this paper.
As per Census 2011, the share of the ST population to total population is 8.6%. What is striking is that the share of ST households in the total employment created starts off initially in 2006–2007 at a disproportionately very high level (33.7%)– more than four times their population share – but then declines. It declines by 16.1% between TE 2009 to TE 2017. Figures 14 and 15 depict the SC and ST person-day generated per household. It is also interesting to observe that states that are inclusive with respect to SC participation (more than 50%) are equally inclusive with respect to the ST population.

SC person-day generated per household (2011–2012 to 2018–2019).
ST person-day generated per household (2011–2012 to 2018–2019).
Concerning female participation in MGNREGS, the rates are very high in Mizoram (69%), Himachal Pradesh (66%), Andhra Pradesh (61%), Chhattisgarh (60%), and Tamil Nadu (50%) (Table 7). At the same time, the rates are much lower than the national average in Punjab (9%), Uttar Pradesh (14%), Haryana (15%), Bihar (20%), and Kerala (23%). While the program failed to increase SC and ST participation over the years, the program succeeded in making it gender-inclusive. At the all-India level, women’s participation has increased from 43.4% in TE 2008 to 55% in TE 2017. Table 7 shows that regardless of cultural differences, in most states, women’s share in MGNREGS employment has been higher than work participation rates in these respective states. In Gujarat, Jharkhand, Karnataka, Orissa, Madhya Pradesh, and Uttarakhand, the difference between work participation rate and participation rate in MGNREGA was less, indicating cultural rigidities to participate in MGNREGA work in these states.
Figure 16 gives a pictorial representation of the Women’s share of Employment and evokes the same story. The majority of the states, except for Uttar Pradesh and Jammu & Kashmir, have female participation more than 50% in 2018–2019.

Women’s share of employment (2011–2012 to 2018–2019).
Conclusions
This paper explores the performance of MGNREGS, both nationally and through a state-wise comparison based on key performance indicators for the period 2006–2007 to 2017–2018. The key indicators were analyzed in terms of (i) financial indicators, (ii) physical performance indicators, and (iii) inclusiveness indicators. Though there are some signs of improvement, the overall performance of MGNREGS leaves much to be desired.
At the all-India level, both the availability of funds and expenditure share a similar trend of increasing in the initial period of up to 2010–2011, then declining and reaching highest by 2017–2018. However, concerning to utilization of funds, it exhibits volatility, ranging between 73% and 83%, and remains stable from 2015–2016 onward. In terms of money wage paid to MGNREGA workers, which works as an output indicator, the person day wage (in nominal terms) exhibits an increasing trend over the years, while the trend in real wage remains almost stagnant. This trend is restabilized through the change in compound growth rates of nominal and real wage in two-period analysis.
Despite sharp increases in fund allocation, total expenditures, and utilization rates since 2015–2016, the study has found deceleration in most physical performance indicators. These findings corroborate some other studies, which point to slower growth in physical performance indicators due to slower growth in fund allocation despite 100% utilization of allocated funds (Das & Maiorano, 2019; Raabe et al., 2010). Physical performance indicators like person-days of overall employment generated and person-days employment generated per household have decelerated, particularly during 2010–2011 to 2017–2018. Under the MGNREGA, every job card holder is eligible for wage employment against the demand for work. But it is disheartening to note that the actual households benefited (or provided employment) were consistently below the half-mark of the households’ job cards. Also, the employment under MNREGA has not kept pace with increases in gross national income growth. Performance of MGNREGA with the inclusiveness indicators is mixed. The percentage of SCs and STs employment in total employment decelerated while women’s share showed impressive growth. Regardless of cultural differences, in most states, women’s share in MGNREGS employment has been higher than work participation rates in these respective states.
The proportion of work completed has shown a declining trend over the years, and as a mirror image, the proportion of incomplete work across states has shown an increasing trend. This contradicts the findings of some studies (Farooqi & Saleem, 2015; Goparaju & Shome, 2011; Reddy et al., 2014), which point to high saturation levels concerning MGNREGA projects. Regarding remuneration paid to MGNREGS workers, though the person day wage showed a rising trend over the years in nominal terms, no significant change is observed in real wages. Although some studies (Farooqi & Saleem, 2015; Goparaju & Shome, 2011) point to high saturation levels concerning MNREGA projects, the present study finds a strong positive correlation has also been found with fund allocation and its outcome through employment generation. This finding rejects the falsity of saturation of MGNREGA work in rural areas. This argument strengthens the positive and significant correlation of fund availability with Natural Resource Management work and individual asset creation. It points to the need to allocate higher budgets by respective state governments rather than resist increasing budgetary allocations.
At the state-level analysis, the top three states incurring the highest spending in MGNREGA work in 2017–2018 are West Bengal, Andhra Pradesh, and Tamil Nadu. If the potential for creating employment judges the program’s success, West Bengal also ranked first in person-day employment generated, followed by Rajasthan and Tamil Nadu. An apparent positive association is observed between expenditure and personday generation. However, a strong positive correlation has also been found with fund allocation and employment generation outcomes. This finding rejects the falsity of saturation of MGNREGA work in rural areas. Again, this argument strengthens by the positive and significant correlation of fund availability with Natural Resource Management work and individual asset creation. Also, it is noticeable that overall, the net balance has a significant and negative association with personday generation, NRM activities, and individual asset creation, indicating that underutilization of funds leads to a lower outcome. The reverse is also true for few states like West Bengal, Uttar Pradesh, Andhra Pradesh, and Chhattisgarh, the overutilization of resources led to higher personday generation and NRM activities. Those states are also ranked higher concerning personday generation than other states, which implies that funds allocated for MGNREGA work for such states are insufficient, and states are managing the cost of MGNREGA work from some other sources. Among the top-performing states regarding the number of households provided employment, Tamil Nadu ranked first, followed by West Bengal. A similar position continued in terms of person day generated. The reason could be attributed to the greater allocation of funds for both states. In terms of average person-days of employment per participating household, all the North-East states (except Arunachal Pradesh) came forward. The reason could be that the number of participating households is significantly less in those states and family size, in general, is considerable. Therefore, generating more person-days of employment in comparison to other states is possible.
It is encouraging to find that MGNREGA has done well concerning social inclusion. Women’s participation in most states in these projects is higher than women’s overall work participation rates in those states. With its thrust on equal wages for men and women, the program’s employment within a 5 km radius and provisioning of creche or child care facilities at work sites has enabled women to participate in the paid labor market. We also find an improvement in the performance of all states concerning persondays of employment generated per households for SCs and STs. However, we see an exception with some North-eastern states. Nagaland and Manipur have worse-off outcomes concerning person days employment generated for SCs and STs between 2011–2012 and 2018–2019. This is alarming considering the high proportion of STs in these states. There might be political economy explanations for the same, considering that these states have been experiencing ethnic conflicts as well as political struggles with the concerned state and central governments.
Further studies should examine state-specific factors responsible for negative changes over time and replicate other states’ success stories for better implementation. However, keeping in mind the extensive coverage of the MGNREGA implementation and its complexities on data validation, it is always suggested to conduct specific field surveys need to be undertaken for policy indications. It is possible that structural changes in various states, can alter the demand for work itself and affect several other performance parameters. Besides, the idea of decent work itself may be undergoing a change based on people’s changing aspirations. The supply of work through MGNREGS should focus on lagging areas, in other words, the ones with the lowest completion rates. Given the pandemic and many migrants returning home to villages in rural India, MGNREGA will be depended upon more than ever to absorb the shocks to their livelihoods, income, and sustenance.
Footnotes
Declaration of Conflicting Interests
The author(s) declared no potential conflicts of interest with respect to the research, authorship, and/or publication of this article.
Funding
The author(s) received no financial support for the research, authorship, and/or publication of this article.