
Abstract
There is a higher than chance representation of autistic people and people with elevated autistic traits in Science, Technology, Engineering and Mathematics (STEM) industries. Medical students, despite studying a STEM subject, have lower autistic traits than other STEM students. Medicine is heterogenous, covering technique-oriented specialties (e.g., surgery) with little patient interaction, person-oriented specialties (e.g., pediatrics), and general practice. We present an online survey in which 502 UK university students (medicine, n = 344; STEM, n = 94; non-STEM, n = 64) reported their study area and career aspirations and completed the Autism Spectrum Quotient (AQ), a quantitative self-report measure of autistic traits. Our main findings were that medical students had significantly lower AQ scores than other STEM (p < .001, d = 0.614) and non-STEM students (p < .001, d = 0.874), and that medical students aiming to pursue technique-focused career paths had significantly higher AQ scores than medical students aiming to pursue person-oriented career paths (p = .009, d = 0.318). Each of these effects remained statistically significant after adjusting for alpha inflation. The findings of this study corroborate those of previous research reporting a link between autism and STEM; they also provide evidence that autistic traits are a predictor of medical students’ career ambitions, with those students with high AQ scores being more likely to pursue technique-focused (as opposed to person-focused) roles. This may be informative for developing and optimizing the strengths of individuals with differing levels of autistic traits.
Introduction
Autism spectrum conditions (henceforth “autism”) are characterized by impairments in social communication and interaction, as well as restrictive and repetitive behaviors and persistent narrow interests (American Psychiatric Association, 2013). Traits that are closely associated with autism are normally distributed throughout the non-clinical population (Baron-Cohen et al., 2014; Sucksmith et al., 2011), with only those severely impaired in their daily functioning receiving a diagnosis. There are also marked sex differences: approximately 4.2 males are diagnosed as autistic for every 1 female (Fombonne, 2009), and, within the general population, males have higher levels of autistic traits compared to females (Baron-Cohen et al., 2001; Ruzich, Allison, Smith, et al., 2015).
Autism and elevated levels of autistic traits may be associated with specific profiles of strengths and weaknesses, which could be particularly relevant regarding employment and career choices. Autistic people are more strongly represented in Science, Technology, Engineering and Mathematics (STEM) subjects and occupations than in non-STEM occupations such as finance, retail and publishing (Ruzich, Allison, Chakrabarti, et al., 2015; Wei et al., 2013). Additionally, fathers and grandfathers of autistic children are more likely than chance to work in engineering (Baron-Cohen et al., 1997), and geographical regions associated with information technology employment have elevated rates of autism (Roelfsema et al., 2012). These effects appear to extend to the general population; for instance, students studying science subjects have higher autistic traits than students studying non-science subjects (Baron-Cohen et al., 2001; Hoekstra et al., 2008; Pisula et al., 2013; Wakabayashi et al., 2006), and those studying physical sciences and mathematics tend to score higher than those studying biological science or health (Austin, 2005; Baron-Cohen et al., 2001; Wakabayashi et al., 2006). Although these findings suggest a link between autistic traits and scientific study, they do not clarify the nature of the relationship. For instance, it could be that the effect is driven by a preference for systemizing or a desire for reduced social interaction, both of which may be characteristic of pursuing scientific disciplines (Morsanyi et al., 2012). However, an association between autistic traits and STEM subjects could be relevant in explaining why males are more strongly represented than females in these disciplines.
Autistic Traits and Medicine
Although studies have examined links between autism and STEM, it should be considered that the “STEM” label encompasses considerable heterogeneity. Notably, medicine is included within the UK government’s current list of STEM subjects (Science and Technology Committee, 2012), though differs from others such as engineering, as it centers around social interactions. The General Medical Council (2018) emphasizes the need for communication and empathy in medical graduates, as well as knowledge of the scientific principles underpinning practice. Research suggests that medical students have lower AQ scores than students of other STEM subjects. It also appears likely that medical students have lower AQ scores than those of humanities students (Pisula et al., 2013; Wakabayashi et al., 2006), although the evidence for this is less clear (Baron-Cohen et al., 2001).
While medicine is often conceptualized as a single discipline, this may be overly simplistic as physicians can pursue a diverse range of specialties. There are currently 65 specialties and 31 sub-specialties in the UK (General Medical Council, 2019), and these can differ so much as to be recognized as separate occupations (Woods et al., 2016). For example, a public health doctor aiming to improve population health has a very different role to that of a surgeon using practical techniques to treat problems in individual patients. Such heterogeneity within medicine could potentially explain the contrasting results across studies comparing AQ scores of medical students with those of students from other disciplines.
Identifying the factors that influence specialty choice is important for those training or advising doctors on their career paths, as well as for policymakers aiming to address shortages in certain specialties (Smith et al., 2015). Despite much research, the process of medical career decision making is not fully understood (Querido et al., 2016), though some contributory factors have been identified. Some of these include perception of the specialty (Crewther & Cook, 2020; Hill et al., 2014), actual experience (Woolf et al., 2015), job characteristics (e.g., working conditions and location; Cleland et al., 2017), as well as individual difference variables such as age, gender, and personality (Lambert et al., 2018; Lepièce et al., 2016; Querido et al., 2016). Some of these factors may also interact: for example, compared to men, women have more negative experiences of surgery during medical school (Hill et al., 2014), and tend to prioritize working hours that are compatible with their domestic situation rather than with attaining prestige (Querido et al., 2016; Smith et al., 2015).
Personality and Medical Specialty Choice
There are well known stereotypes associated with certain medical specialties, many of which seem to center around communication and the interaction of doctors with patients and other healthcare professionals (Oxtoby, 2013). As lower social and communicative skills are associated with autistic traits, preferences for working in a specialty with less patient interaction could be linked to higher Autism Spectrum Quotient (AQ; Baron-Cohen et al., 2001) scores. For instance, it has been found that internal medicine physicians have greater interest in working with people than do surgeons or anesthetists, who typically prefer working with data or tools (Borges & Savickas, 2014).
As far as we are aware, no published articles have yet examined whether autistic traits are associated with medical specialty choice. However, under the assumption that one’s personality causes a gravitation toward certain occupations by developing interests that lead to job skills (Woods et al., 2016), some researchers have examined differences in personality traits between practitioners in different areas of medicine. Although there is a consensus that personality traits are associated with medical specialty choice (Bexelius et al., 2016; Borges & Gibson, 2005; Borges & Osmon, 2001; Borges et al., 2004; Sievert et al., 2016; Woods et al., 2016), findings have not always been consistent. It is also difficult to compare these observations as the studies involved utilized a wide variety of personality measures as well as different criteria for categorizing medical specialties (Borges & Gibson, 2005). However, it is notable that psychiatrists report higher empathy than other physicians (Hojat et al., 2002), and in particular, surgeons (Dehning et al., 2014), and that “people-oriented” physicians measure higher on empathy than do “technology-oriented” physicians (Hojat et al., 2001). Some of the descriptions of personality factors studied in this area may also be akin to autistic traits. For example, people in technique-oriented specialties were more likely to have high scores in Cognitive Structure and Aggression, suggesting that physicians could be described as “more precise, exacting, rigid, needing structure and perfectionistic” (Borges & Gibson, 2005, p. 15). Also, “person-oriented” specialties attracted more people with “Social” traits. “Social” occupations are described as providing personal services with more social contact, and people with Social traits are typically empathic, warm, and friendly (Borges et al., 2004). These “technology-oriented” and “person-oriented” traits are broadly comparable to systemizing and empathizing, respectively, and may therefore share similarities with some of the features of autism (Baron-Cohen, 2009).
Hypotheses
The current paper presents findings from an online survey of autistic traits (as measured by the AQ) and career choices in a sample of UK university students. The research proceeded with the following hypotheses: (i) autistic traits would be higher in STEM students compared to non-STEM students, (ii) autistic traits would be lower in medical students than in students of other STEM subjects, (iii) medical students would have different levels of autistic traits to non-STEM students, (iv) medical students intending to specialize in surgical and technique-oriented areas (e.g., radiology, anesthetics) would have higher levels of autistic traits than students aiming to specialize in person-oriented areas (e.g., pediatrics, general practice, hospital medicine). Evidence in support of these hypotheses may provide new insights into factors affecting specialty choice within medicine. This could in turn form the basis for new educational methods and policies in higher education.
Method
Participants
Six hundred seventy-two people accessed the online survey (hosted by Qualtrics), 508 (75.6%) of whom completed the AQ. The only inclusion criteria were that participants be over the age of 18 and currently studying at a UK university. Three (0.4%) participants indicated they were high school students rather than university students, and so their data were removed before further analysis. Of these 505 participants, 396 (78.4%) were female, 106 (21.0%) were male, 2 (0.4%) were transsexual, and 1 (0.2%) preferred not to report their sex. Because our main analyses used sex (male or female) as a predictor variable, these latter three participants were not included in subsequent analyses, meaning that the final sample consisted of n = 502. The age range was 18 to 38 years (n = 501, M = 21.91, SD = 2.68); 15 (3.0%) reported an autism diagnosis, and 55 (11.0%) suspected they could be autistic.
Apparatus/Materials
Demographic questionnaire
Participants were asked their age and sex (“male,” “female,” “transsexual,” “intersex,” “other,” or “prefer not to say”) and whether they were a medical student (yes/no). We prompted any intercalating medical students (i.e., those taking a year out of their medicine course to obtain an additional Bachelor’s or Master’s degree in a different subject) to select “yes,” as their main degree was medicine and they would still be choosing a specialty once fully graduated. Medical students were asked if they had obtained a degree before medicine (“No,” “Yes and entered a Graduate Entry medicine course” or “Yes and entered an Undergraduate medicine course”). They then indicated their current year of study, and, if they selected “intercalation,” were asked to state which year of medicine they last completed. As the survey was distributed toward the end of the academic year, the last completed year of medicine was equivalent to the current year of study for non-intercalators. Therefore, intercalators were coded as their last completed year of medicine (i.e., if intercalating after their fourth year, they were counted as fourth years) as the amount of medical training they had would be equivalent. Finally, medical students selected one specialty that currently appealed to them the most. The options presented were: “Surgery,” “General practice,” “Medical specialties” (i.e., any specialty based in a hospital that does not involve surgical procedures, such as neurology or cardiology), “Psychiatry,” “Emergency medicine,” “Anaesthetics,” “Obstetrics & gynaecology,” “Paediatrics,” “Radiology,” and “Other” (participants who selected “Other” were then asked to specify further via a free text response).
Non-medical students were prompted to report their subject area in a free text box as well as their current year of study (“1”–“5,” “postgraduate,” or “other”). We then asked what career they would most like to pursue once graduated (in a free text box), though did not analyze this information further as it was not the focus of the study. At the end of the survey, all participants were asked if they had been diagnosed with an autism spectrum condition (including Asperger’s syndrome) and could select “Yes,” “No, but I suspect that I have an autism spectrum condition,” or “No, and I do not suspect that I have an autism spectrum condition.” This question was administered at the end of the survey to ensure that it did not prime participants’ responses to the AQ.
Autism Spectrum Quotient
The Autism Spectrum Quotient (AQ; Baron-Cohen et al., 2001) is a validated self-report measure used to quantify autistic traits in individuals with average or above-average IQ. It consists of 50 statements to which participants respond on a four-point Likert scale (“definitely agree,” “slightly agree,” “slightly disagree,” or “definitely disagree”). One point is scored for each response consistent with the presence of autistic traits, regardless of whether “definitely” or “slightly” agree/disagree is selected. The scale is designed so that approximately half the responses corresponding to an autistic trait elicit an “agree” response, and the other half a “disagree” response. The AQ has good test-retest reliability (Baron-Cohen et al., 2001), is able to differentiate between autistic and non-autistic populations (Baron-Cohen et al., 2001; Ruzich, Allison, Smith, et al., 2015; Woodbury-Smith et al., 2005), and has shown consistent results across cultures (Hoekstra et al., 2008; Pisula et al., 2013; Wakabayashi et al., 2006). The internal consistency for the full-scale score in the current study was high (Cronbach’s α = .851).
Design and Procedure
The current study utilized a correlational design. The survey, which took approximately 10 minutes to complete (no time limit was imposed), was distributed via social media (e.g., Facebook), student forums (e.g., The Student Room) research participation groups (e.g., SurveyCircle.com, and Newcastle University’s School of Psychology Research Participation Scheme). We contacted all UK medical schools for which we could obtain a general enquiries email address (n = 29), and five confirmed that they had made the survey available to their students. To recruit participants for the non-medical student comparison groups, we advertised the study via social media and by contacting other departments at the host institution.
All participants provided written informed consent before they could complete the survey. Ethical approval was obtained from the Faculty of Medical Sciences Research Ethics Committee, Newcastle University (approval number: 1688/12248/2019), and all procedures were conducted in accordance with the Declaration of Helsinki (1964). Participation was incentivized with the opportunity to win a £25.00 Amazon voucher. An explanation of the AQ was provided in the debrief, along with a link to the National Autistic Society’s website.
Statistical Analysis
Statistical analyses were performed using IBM SPSS Version 26. Findings are considered statistically significant at p < .05, and effect sizes are interpreted according to widely accepted criteria (Cohen, 1988): small (d = 0.20,
Results
Association Between AQ Score and University Degree Subject Area
We used the Joint Academic Coding System (JACS) 3.0 (Higher Education Statistics Agency, 2012) to categorize participants’ degree subject area. Participants were then assigned to one of three groups (medicine, STEM, or non-STEM) based on the list of STEM subjects determined by the JACS codes used by the UK government (Science and Technology Committee, 2012). Any student studying joint honors would have been categorized by the first subject listed, though none studied subjects from opposing groups. Table 1 displays a breakdown of subject categories assigned to the three groups, as well as the frequencies of students present within each category. A one-way ANOVA showed no significant difference in age between the three groups, F(2, 498) = 0.619, p = .539,
Frequency of Participants Stratified By Subject Area According to JACS 3.0 Codes.
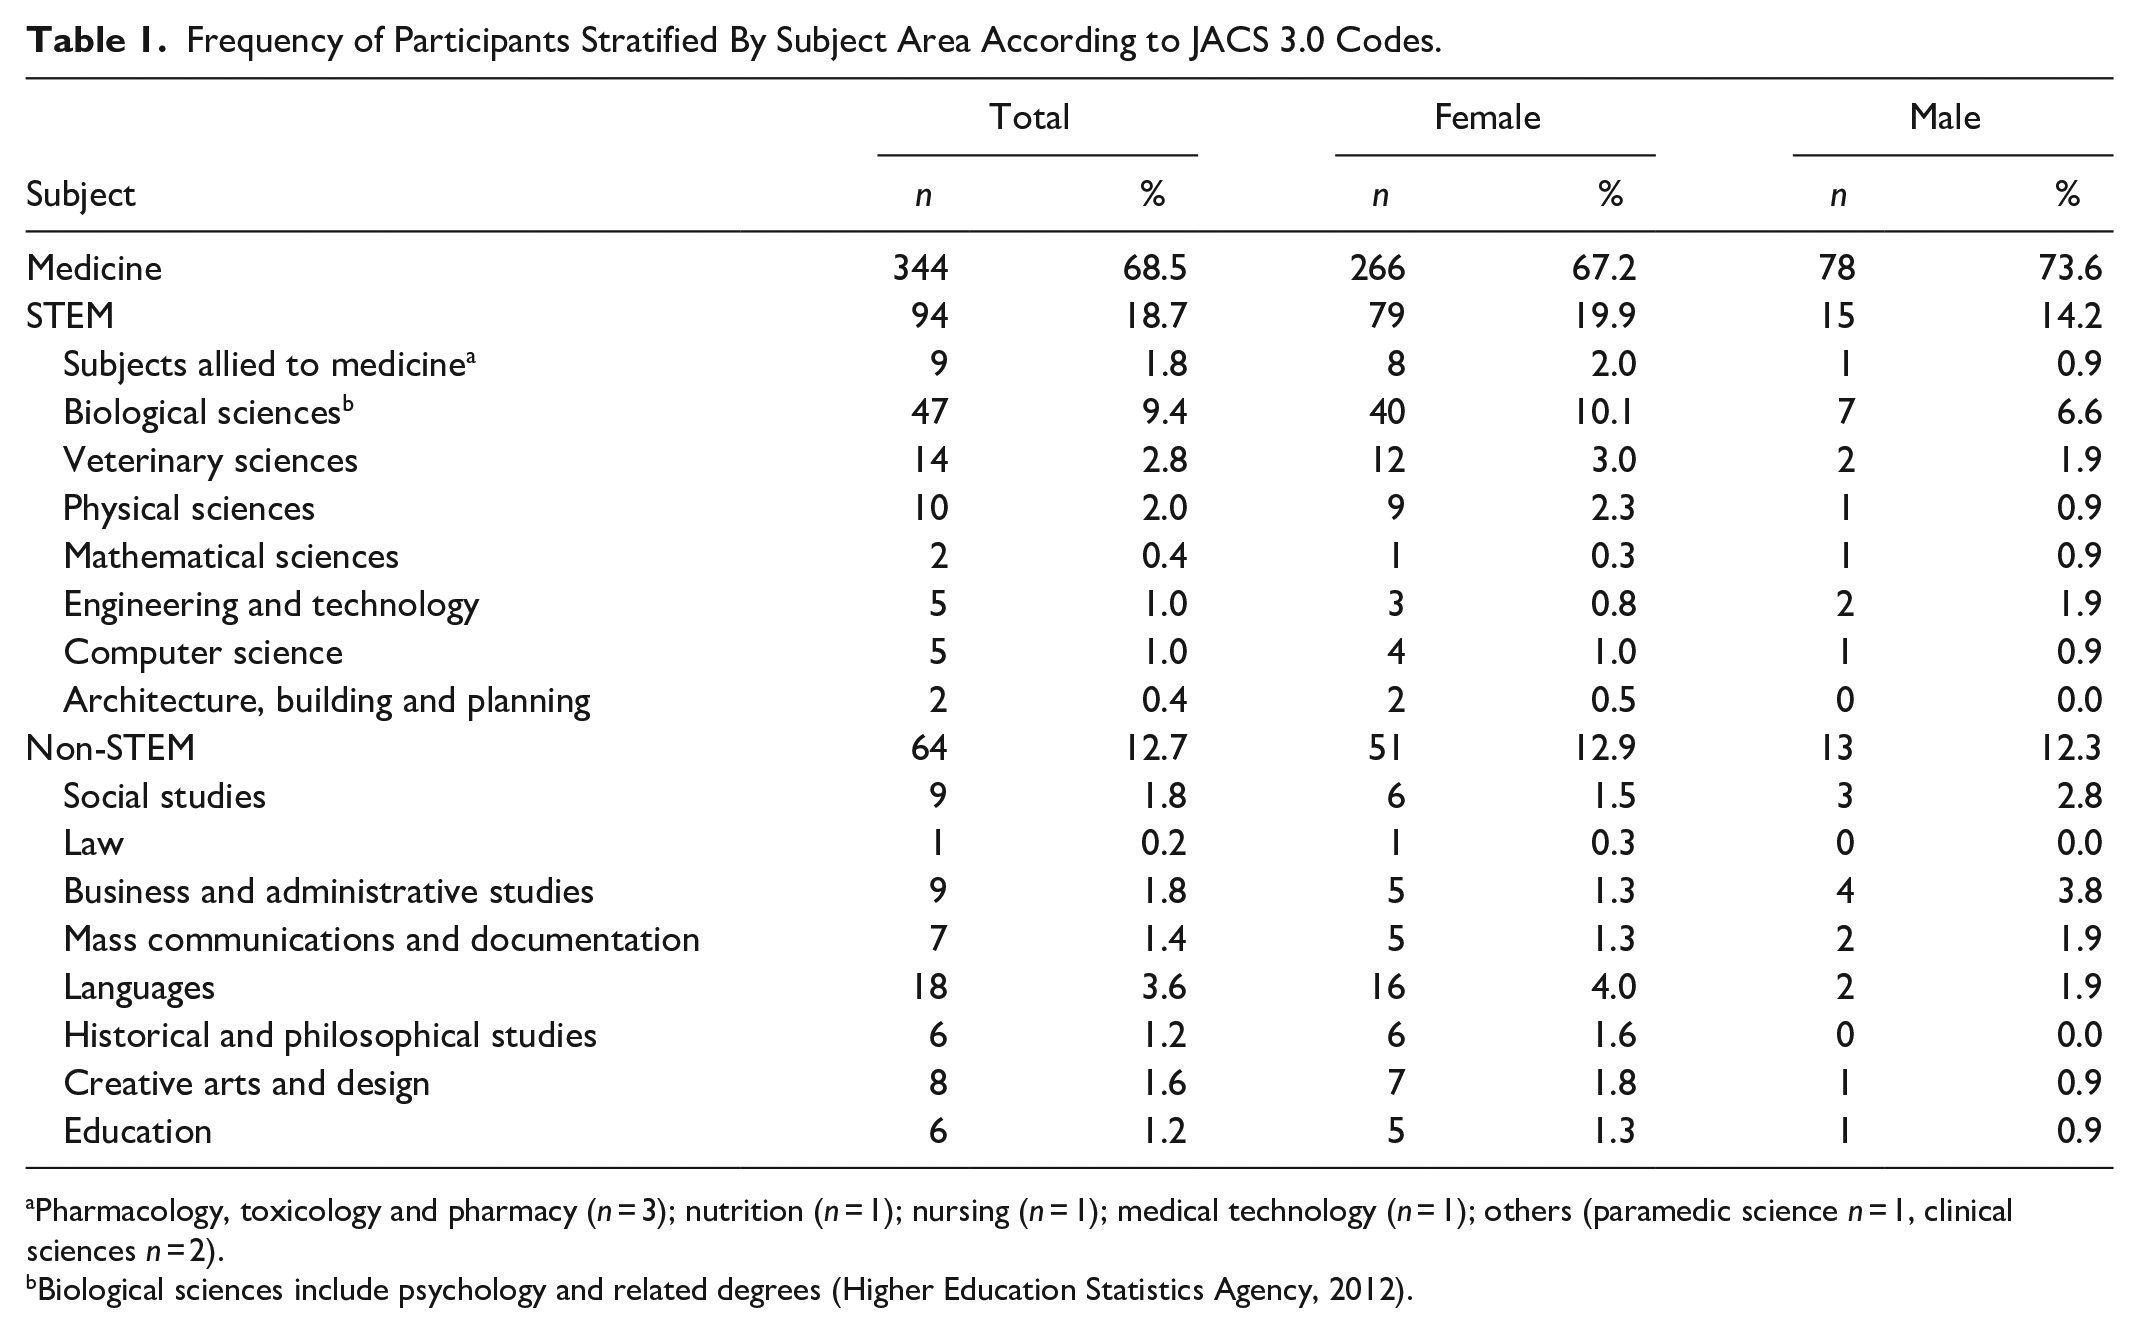
Pharmacology, toxicology and pharmacy (n = 3); nutrition (n = 1); nursing (n = 1); medical technology (n = 1); others (paramedic science n = 1, clinical sciences n = 2).
Biological sciences include psychology and related degrees (Higher Education Statistics Agency, 2012).
AQ total scores stratified by subject area and sex are presented in Table 2. A three (subject: medicine, STEM, or non-STEM) ×2 (sex: male or female) factorial ANCOVA with autism status (diagnosed, suspected, or no autism) as covariate was conducted on the outcome variable of AQ total score (Figure 1). The ANCOVA revealed significant main effects of autism status, F(1, 495) = 65.004, p < .001,
Means and Standard Deviations for AQ Score for the Overall Sample and Stratified By Sex and Subject Area.


Total AQ score as a function of study area.
Three post hoc independent samples t tests were conducted, and the required alpha level was corrected using Bonferroni adjustment (required p < .017). These revealed that, contrary to our hypothesis, non-STEM students had the highest AQ scores (n = 64, M = 22.25, SD = 7.50), followed by STEM (n = 94, M = 20.70, SD = 8.96), although the difference between these groups was not statistically significant, t(156) = −1.137, p = .257, d = −0.185). However, medicine students (n = 344, M = 16.22, SD = 6.78) had significantly lower AQ scores than both STEM students, t(123.587) = −4.515, p < .001 (equal variances not assumed), d = –0.614, and non-STEM students, t(406) = −6.426, p < .001, d = –0.874, the effect sizes being medium and large, respectively.
Association Between AQ Score and Medical Specialty Choice
The medical students were assigned to different groups depending on their specialty choice. Participants who answered in the free text box were recoded depending on the closest match (e.g., “palliative care” was assigned to “medical specialties”) on the NHS Health Careers list (NHS Health Education England, 2018a). The three groups for analysis were the commonly used “person-oriented” and “technique-oriented” specialties (Zeldow et al., 1990) in addition to general practice (GP) (details shown in Table 3). This is based on a taxonomy from the 1960s, and, although the role of physicians has inevitably changed since then, a recent review found a consensus with these groupings in current physicians (Borges & Richard, 2018). However, this taxonomy determines specialties based on treatment approach rather than by social interaction. We therefore separated general practice from person-oriented specialties, as GPs often have different interactions with patients, dealing with multiple issues simultaneously, and occasionally performing home visits (NHS Health Education England, 2018b). AQ score was not associated with year of academic study, rs(337) = −0.042, p = 0.438, and the prevalence of diagnosed or suspected autism did not differ between the three medical specialty groups, χ2(6, 344) = 2.070, p = .913, Cramér’s V = 0.055.
Frequency of Medical Students Stratified By Specialty Choice.

Medical specialties was presented as a specific option that participants could select, but also includes any free text responses indicating a specialty based in a hospital that does not require surgical training (e.g., neurology, cardiology, palliative care).
Table 4 displays a summary of AQ total scores by specialty choice. A three (specialty choice: person-oriented, technique-oriented, or general practice) ×2 (sex: male or female) factorial ANOVA was conducted with AQ score as the outcome variable. As well as one participant who was not male or female, two further students were removed from this analysis because they stated “undecided” in the free text box for “other” specialty preference. The ANOVA revealed a significant main effect of specialty choice, F(2, 336) = 3.994, p = .019,
Means and Standard Deviations for AQ Score in Medical Students Stratified By Sex and Specialty Choice.


Total AQ score as a function of sex and medical specialty choice.
We used three post hoc independent samples t tests to examine where the differences lay between the three areas of medical specialty, and corrected the required alpha using Bonferroni adjustment (required p < .017). These revealed that students choosing technique-oriented specialties had the highest total AQ scores (n = 130, M = 17.35, SD = 6.99); these were significantly higher than those of students choosing person-oriented specialties (n = 145, M = 15.24, SD = 6.29), t(273) = −2.639, p = .009, d = −0.318. Students aspiring to be GPs (n = 67, M = 15.93, SD = 7.16) did not differ from those of person-oriented students, t(210) = −0.704, p = .482, d = −0.105, or technique-oriented students, t(195) = −1.348, p = .179, d = –0.201. We used an additional six simple effects tests (Bonferroni adjusted alpha p < .008) to investigate the interaction between specialty choice and sex. These revealed that female technique-oriented students had higher AQ scores than female person-oriented students (p = .028) and that male person-oriented students had lower AQ scores than male students who aspired to be GPs (p = .013), although neither effect survived Bonferroni correction. No other comparisons were statistically significant at the p < .05 or p < .008 levels.
Discussion
The current study provides a preliminary investigation of the prevalence of autistic traits in UK medical students. The main findings are that medical students have lower AQ scores than other STEM students and non-STEM students, and that those medical students who have a preference for technique-focused career specialties tend to have higher AQ scores than those medical students who prefer person-focused roles.
Autistic Traits, STEM, and Medicine
As predicted, we found that medical students had significantly lower AQ scores than other STEM students. Likewise, we found that medical students had a significantly different mean AQ score than non-STEM students (also lower). These findings may reflect the requirement for highly developed social and communication skills in medicine, though could also relate to non-social elements of autism, such as differences in cognitive function and motor skills. Although, at its core, medicine is the scientific study of the human body, medical education focuses on the subtle art of patient care. Furthermore, no matter the specialty a doctor chooses once qualified, the process of getting into and graduating from medical school requires interviews, patient interaction, and good communication with team members (General Medical Council, 2018). Therefore, it is not surprising that medical students score lower than students of other STEM subjects as, although communication skills are taught throughout medical school, it is likely that people choosing medicine will have fewer impairments in social skill and communication at baseline. The current findings also support previous studies showing that medical students have lower AQ scores than humanities students (Pisula et al., 2013; Wakabayashi et al., 2006). Although technically a STEM subject, medicine is studied by people with lower levels of autistic traits than typically found in other university degree subjects, and this may be because medical school entry requirements (e.g., interviews) are likely to indirectly select students with low AQ scores.
It is well recognized that autistic traits can negatively impact performance in job interviews, with many autistic transition-age youths struggling to find employment (Maras et al., 2021). Conversely, successful medical school applicants following semi-structured interview have been found likely to demonstrate traits of Nurturance, Endurance, Cognitive Structure, and Order, whilst scoring low on traits such as Abasement, Aggression and Impulsivity (Jelley et al., 2002). Whilst there is no existing literature specifically examining AQ and performance at medical school interviews, it is clear that non-cognitive characteristics are important, with interviews selecting those with higher emotional intelligence and social competency, who are more likely to excel in subsequent clinical examinations (Yusoff, 2018). All UK-based medical schools now accept applicants based on a combination of University Clinical Aptitude Test (UCAT) scores and semi-structured/multiple mini-interviews. It therefore follows that candidates with low AQ scores are more likely to be selected, introducing a potentially confounding factor into the interpretation of these results, as other STEM subjects rarely interview as part of the university selection process.
As was predicted, preferred specialty choice had a small but statistically significant association with AQ score, with technique-oriented students scoring higher than those preferring person-oriented career paths. A likely reason for this is that technique-oriented specialties have different patient interactions compared with person-oriented or GP roles. Surgeons become highly specialized as they proceed through their careers, focusing on specific procedures, organs, etc. Although they may see patients for follow-up, they do not typically develop long-standing relationships with them. This is in contrast to medical specialists who manage conditions over many years, or GPs that see patients on a regular basis and get to know them at a personal level. Anesthetists and surgeons also spend considerable periods of time in theater, and whilst they communicate professionally with other team members, much of their job does not involve social interaction. Other technique-oriented specialties, such as pathology or radiology, have even less patient contact; they also require good attention to detail and relatively little attention switching (i.e., two further aspects of autistic symptomology that are measured by the AQ). All these factors could potentially explain why people with higher AQ scores might self-select into technique-oriented medical specialties.
GPs are usually included in the person-oriented group in research (Zeldow et al., 1990). However, we examined students with a preference for general practice as a separate group because they work in a community environment and have different patient relationships to doctors working on a hospital ward or within a clinic setting. While all doctors face time pressures, GPs have particularly brief appointments and so need to be effective communicators to manage a patient’s concerns in a short space of time, as well as to build good rapport. They also see many patients in any given day, a demand that requires effective switching between tasks and fast processing of information. Although this might imply that GPs have the lowest AQ scores of all three groups, we found that GPs’ overall scores fell between those of students pursuing technique-oriented and person-oriented specialties. However, these findings should be interpreted cautiously because the effects were not statistically significant, and the number of students pursuing careers as GPs (n = 67) was smaller than that of the other groups (person-oriented n = 145; technique-oriented n = 130), and particularly so for males (n = 7). It is unlikely that repeating the study in the same (i.e. UK) setting with more medical students would reduce this discrepancy noticeably, as only just over a quarter of UK medical graduates state GP as their first preference, a figure that is also declining (Lambert et al., 2018).
Despite there being no statistically significant sex difference for AQ scores within the medical student group, an interaction effect between sex and specialty choice was observed. Female medical students showed the same difference as the overall group, with those interested in technique-oriented specialties scoring higher than those interested in person-oriented specialties (although the effect did not remain significant after Bonferroni correction). The current study showed that relatively more women intended to pursue person-oriented and GP specialties than technique-oriented specialties, and that relatively more men intended to pursue technique-oriented roles than person-oriented or GP roles. These observations are consistent with previous findings from a study of UK medical graduates in which the ratio of females to males choosing general practice was 2.5:1 and that for surgery was 1:1.14 (both effects p < .001) (Lambert et al., 2018). This indicates that sex differences in autistic traits may contribute to the persistence of sex differences in terms of representation in medical specialties, despite attempts for greater equality (Querido et al., 2016).
Male students pursuing careers as GPs scored higher on the AQ than males choosing person-oriented specialties. However, this effect did not remain statistically significant after correcting for the use of multiple tests. It should also be noted again here that the sample of males aiming for GP roles was very small (n = 7) and represented only 9% of male medical students in the current sample. National figures estimate about 19% of male medical graduates eventually pursue general practice (Lambert et al., 2018). Furthermore, as approximately half of all medical graduates will need to become GPs to meet current service requirements (Lambert & Goldacre, 2011), it is likely that many of the students in our study will not work in their currently preferred specialty area. Therefore, some male students with lower AQ scores may become GPs, meaning that this effect would be attenuated. To investigate this idea further, it may be useful to collect data from fully qualified doctors once they have chosen a specialty area. If confirmed that students do progress along their chosen career paths, it could suggest that individuals are effective at recognizing which specialties suit their personality traits. If not, it may imply that the selection pressure comes at the level of the specialty itself (i.e., different specialties preferentially select candidates with personality traits that are well suited to that area). It may of course also be the case that both of these processes are in operation.
Findings from previous research (Baron-Cohen et al., 2001; Hoekstra et al., 2008; Pisula et al., 2013; Wakabayashi et al., 2006) have shown AQ scores to be significantly higher in STEM students than non-STEM students. However, in the current sample we observed no significant difference in AQ scores between these two groups. While this was not predicted, it may reflect the method used by the current study in categorizing degree subjects into STEM and non-STEM. For instance, there are differences between individual subjects within STEM (Baron-Cohen et al., 2001; Wakabayashi et al., 2006), with mathematics and engineering students scoring higher than biological science students. This is in line with observations of a link between autism spectrum conditions and occupations in maths, physics, and engineering. Therefore, the mean AQ score observed for a STEM student sample is likely to depend very much on the composition of that particular sample. In the current study, the largest group within the STEM subjects was biological sciences, and many people studying this area may aspire to work in occupations that require a certain amount of social interaction and communication skill. The large representation of such students within our sample could potentially explain why we observed no overall difference in AQ scores between STEM and non-STEM students.
As there does not seem to have been a standardized way of grouping subjects in previous research in this area, we utilized the UK Higher Education Statistics Agency (HESA) JACS codes, which are used to inform the definition of STEM subjects by the UK government. The way in which different subjects are classified is likely to be a large source of heterogeneity between studies. For instance, in our classification system, biological sciences includes psychology, whereas some previous studies (Hoekstra et al., 2008; Pisula et al., 2013) have included psychology within social science (i.e., as a non-STEM subject). Although it is possible that our results would have differed had we included psychology within social sciences, it is notable that Baron-Cohen et al. (2001) included psychology within their group of science students and still found higher AQ scores in STEM students compared to humanities and social science students. Therefore, the lack of a significant difference in our study, while in contrast to previous findings (Ruzich, Allison, Chakrabarti et al., 2015), is most likely explainable by the relatively high prevalence of biological science students within the sample.
Strengths and Limitations
Strengths of the current study include the relatively large sample of UK medical students, use of a validated and reliable measure of autistic traits, and grouping of students by official taxonomies that are used widely in research (Higher Education Statistics Agency, 2012). However, there are also some limitations that should be acknowledged.
Firstly, although the sample of medical students was quite large, those relating to STEM and non-STEM students were small in comparison, and the sex ratio observed is not representative of UK students (this is consistent with the observation that females are generally more likely than males to respond to online questionnaires). Secondly, as the study was cross-sectional, there is no indication of a causal direction of effect. It therefore remains unclear whether the level of autistic traits at baseline causes selection into different subjects/medical specialties, whether studying particular subjects affects how one responds to measures of autistic traits (such as the AQ), or whether the association between these variables is explained by another as yet unidentified factor. However, the lack of correlation between AQ score and either age (all students) or year of study (medical students) would suggest that selection based on autistic traits at baseline is most likely. This is in line with research reporting that first year medical students who prefer specialties involving continuity of patient care score higher in self-reported empathy than students who prefer roles with less interpersonal contact (Dehning et al., 2013; Newton et al., 2008; though see also Harsch, 1989). Although the AQ measures preferences rather than perceived appropriateness of behavior (Baron-Cohen et al., 2001), and so would not be expected to change with age, this may be a particularly relevant observation within the current context because communication skills and empathy are a core part of the medical curriculum (General Medical Council, 2018). Additionally, we surveyed medical students from all year groups, and note that preferences often change over the course of medical school (Compton et al., 2008). Experience of specialty areas is a contributing factor (Woolf et al., 2015), and so those in the earlier years of medical school may be particularly likely to eventually work in specialities other than those which they specify as being most favourable at that particular time. However, we surveyed medical students before they had started working in a specialty area, so it seems more likely that AQ scores predict specialty choice rather than that AQ scores change as a function of working in the profession. A longitudinal study would allow for changes in AQ score to be measured, as well as for recording doctors’ eventual areas of specialty. Finally, the self-reported diagnoses may lack validity; for this reason, we only used this information to ensure that any differences in autism prevalence between groups could be accounted for, albeit inexactly. While the percentage of students reporting an autism diagnosis was higher than that typically observed in the general population, it is noted that relatively high numbers of university applicants report autism diagnoses to disability services (MacLeod & Green, 2009).
Possible Future Research Directions
A number of the characteristics of autism spectrum conditions overlap with traits observed in personality disorders, e.g., anxiety, intimacy avoidance, restricted affect (Skodol et al., 2015). It is unclear from our work whether it is specific traits or AQ scores per se that relate to career direction in university applicants. Future work should therefore examine the broader impact of personality traits/disorders on choice and direction of medical careers. Secondly, this current work examines the association between AQ and career intention amongst medical students rather than fully qualified doctors. We plan to follow-up this student cohort over the next 5 to 10 years to determine whether their career aims were borne out and to assess the role of autistic traits in eventual career choice.
Conclusion
In line with previous research, the current study has shown there to be differences in the level of autistic traits (as measured by the AQ) found in university students of different academic disciplines. Notably, medical students had lower levels of autistic traits than other STEM students and non-STEM students. Autistic traits were also linked to the specialty choices of medical students, with higher levels of autistic traits being associated with preference for pursuing technique-oriented rather than person-oriented or general practice career paths. These findings indicate that people studying in certain areas or working in certain medical specialties may have particular strengths and weaknesses, especially in relation to communication and social skills. If specific cognitive profiles are more suited to certain subjects or specialties, educational policies and teaching styles could be adapted to suit the learning profiles of students with differing levels of autistic traits. For example, group work, presentations and reduced processing speed can be a challenge for autistic students (Gurbuz et al., 2019), and similar effects may extend to students with elevated levels of autistic traits. Therefore, educators in relevant subjects could focus on developing these skills in those who find them most difficult. The current findings could also inform students and doctors who are making decisions about their future career options. This could potentially improve services by helping to optimize the distribution of doctors across specialties areas. A greater understanding of the factors influencing career or specialty choice could also be useful for policy makers looking to increase uptake of undersubscribed university subjects or specialty areas. In particular, the well-established sex difference in AQ scores (although notably not observed in the current study) could be informative regarding the differential representation of men and women within certain areas of medicine. Future research could examine these ideas further by implementing longitudinal studies that examine autistic traits in medical students to determine whether they are predictive of eventual specialty choices in qualified doctors.
Footnotes
Acknowledgements
The authors would like to acknowledge all those who took part in the current study, as well as those who helped us to advertise it.
Author Contributions
ET, GR, and EA made substantial contributions to the conception and design of the work. ET and GR acquired, analyzed, and interpreted the data for the work. ET, GR, and EA drafted the work or revised it critically for important intellectual content. All authors agreed to be accountable for all aspects of the work in ensuring that questions to the accuracy or integrity of any part of the work are appropriately investigated and resolved. All authors read and approved the final manuscript.
Declaration of Conflicting Interests
The author(s) declared no potential conflicts of interest with respect to the research, authorship, and/or publication of this article.
Funding
The author(s) received no financial support for the research, authorship, and/or publication of this article.
Ethics Statement
All procedures performed in studies involving human participants were in accordance with the ethical standards of the Faculty of Medical Sciences Research Ethics Committee, Newcastle University (approval number: 1688/12248/2019) and with the 1964 Helsinki declaration and its later amendments or comparable ethical standards.
Consent to Participate
All participants provided written informed consent before completing the survey.
Consent for Publication
Participants provided written consent for their anonymized data to be published and made publicly available alongside the resulting academic manuscript.
Code Availability
The SPSS syntax file for running the analyses reported in this manuscript is available on the Open Science Framework (doi: 10.17605/OSF.IO/TKUHJ).
Data Availability Statement
The dataset and code supporting conclusions of this article are available on the Open Science Framework (doi: 10.17605/OSF.IO/TKUHJ).
Availability of Data and Material
The dataset supporting conclusions of this article is available on the Open Science Framework (doi: 10.17605/OSF.IO/TKUHJ).