
Abstract
The aim of the present study is to develop a national non-verbal cognitive ability test in Turkey. Test items were developed during the first stage and applied as a pilot study on 3,073 children in the age interval of 4 to 13. The test was given its final form based on the values of item difficulty, item distinctiveness, item total score correlation. Norm study was carried out at 12 different provinces with a total of 9,129 children comprised of 4,464 females (49%) and 4,665 (51%) males. Test-retest, split-halves, KR-20, and KR-21 methods were applied for the reliability analyses of the study. Standard error, standard deviation, and reliability coefficient were calculated for the measurement. Content and construct validity along with criterion-related validity analysis methods were used for validity analyses. The KR-20 reliability coefficient obtained from the complete sample group was estimated as 0.92. Test-retest reliability coefficient was determined as 0.80. A correlation of .71 was determined between Naglieri Cognitive Ability test and BNV test. A correlation of .67 was determined between Toni-3 test and BNV test while a correlation of .86 was determined between BNV and Colored Progressive Matrices Test.
Introduction
Today, efforts are ongoing as the primary focus in both education and clinical evaluations to put forth the abilities and capacities of children individually. Cognitive ability tests are of special significance in psycho-educational evaluation (Flanagan et al., 2008). The results of these tests play an important role in decisions such as accordance with special education services and the types of services provided to students with special needs and are used more frequently for the objective evaluation of the abilities of students compared to subjective opinions (Reynolds et al., 2006).
Various tests with many different structures are used for identifying cognitive ability. Intelligence tests are especially used frequently for measuring individual differences in cognitive areas. These tests provide information on individual differences and the potential of the individual (Reisberg, 2013. Multiple intelligence test [e.g., Wechsler Intelligence Scales for Children, 5th edition]; Wechsler, 2014; Wechsler Intelligence Scale for Children-IV [WISC-IV] Wechsler, 2004; Stanford-Binet Intelligence Scale, 5th edition [SB5]; Roid, 2003) in addition to enabling the evaluation of more than one area. The scores in these different areas may be combined to put forth the composite indices of intellectual ability. Questions related with these type of intelligence tests are generally administered verbally with the responses either verbal or in the form of task completion.
Intelligence tests rely on verbal interactions between the tester and the student in order to enable the evaluation of the ability and may not be suited for individuals who experience difficulties in using language or who are unable to establish communication. Students with speech and language disorders, hearing disorders, traumatic brain damage, autism spectrum disorder, and those who are new to the language experience difficulties when taking these tests (Drevon et al., 2017; McCallum, 2003). Non-verbal ability tests may provide fairer and more valid responses for these students (Grondhuis et al., 2018; McCallum, 2003; Naglieri & Otero, 2012).
Non-verbal cognitive ability tests measure general ability. It is characterized in the application by way of implementation of procedures that eliminate or reduce the receptive and expressive language that are required for the students (McCallum, 2003; Naglieri & Otero, 2012). These tests are frequently used in clinical evaluations (Bishop et al., 2015; McCallum, 2003). Non-verbal cognitive ability tests aim to reduce or completely eliminate the emphasis on language with regard to test management and the response of the tested individual (McCallum, 2013). Thus, reducing the emphasis on linguistic and cultural knowledge enables the provision of sufficient data for determining the intellectual abilities of students with limited or no conversation skills, hearing impaired individuals or those with difficulty in hearing as well as those whose native language is not the language of that country (Barbosa et al., 2013; Braden & Athanasiou, 2005).
Non-verbal cognitive ability tests are preferred not only for children with linguistic issues but also in identification the gifted children from lower socio-economic levels (Lewis et al., 2007). Many schools experience difficulties in improving the variety of students registered in gifted student training programs (Callahan, 2001). Non-verbal cognitive ability tests are used more and more frequently to overcome this issue and to place students from less represented minorities in gifted student programs (Lakin & Lohman, 2011; Lewis et al., 2007).
It may be problematic in some cases to rely on language when evaluating IQ and may potentially result in undervaluation (Grondhuis et al., 2018). In this context, non-verbal cognitive ability tests are frequently used in international and national literature for determining potential. Non-verbal cognitive ability tests such as Leiter International Performance Scale Third Edition (Leiter-3; Roid et al., 2013), Non-Verbal Intelligence Test 3rd Edition (TONI-3, Brown et al., 1997), -Verbal Intelligence Test, Fourth Edition (TONI-4; Brown et al., 2010), Universal Non-Verbal Intelligence Test Second Edition (UNIT-2; Bracken & McCallum, 2016), Scale of Ability (WNV; Wechsler & Naglieri, 2006), Ability Test (Naglieri, 2003) Colored Progressive Matrices Test (Raven et al., 1998) are frequently used.
All non-verbal tests used in national literature are foreign-based. This results in difficulties with regard to the use of the tests and the costs involved. A significant amount of financial resource is required in order for foreign tests to be used in Turkey after adaptation study. There is no national non-verbal cognitive ability test developed in Turkey. In this regard, development of a national test in this field will enable the required resources to remain inside the country. Validity and reliability studies have been carried out in Turkey for some of these tests that are frequently used in international literature and they have been used frequently in both clinical and education research studies (Acar et al., 2019; Biçer & Sari, 2017; Bildiren & Kargın, 2019; Karakelle, 2012; Kiriş & Karakaş, 2004; Şahin, 2014; Yalçın & Karakaş, 2008). The standardization of Raven Standard Progressive Matrices Test for the ages of 6 to 15 was carried out by Şahin and Düzen (1994). Karakaş (2006) carried out the validity, reliability, and norm studies for the Raven Standard Progressive Matrices Test within the framework of BILNOT Battery. The standardization of the TONI-3 test for the age interval of 6 to 11 was carried out by Korkmaz et al. (2018). The reliability and validity studies of the Colored Progressive Matrices Test for the age interval of 4 to 6 were carried out by Bildiren et al. (2017). However, none of these studies were carried out based on the Turkish Statistics Institute Territorial Classification and with such a wide sample group. Hence, there is a need to develop a non-verbal ability test at the national scale.
In addition, it is considered that the inclusion of a non-verbal cognitive ability test to the national literature in Turkey will make a significant contribution to determining the cognitive levels of children with learning difficulty, autism spectrum disorder and hearing impairment. The intelligence level of individuals with learning difficulty in Turkey is determined using intelligence tests with verbal sub-tests (WISC-R). This may lead to misidentification of these children. Students with learning difficulty may be misidentified with light mental impairment due to the applied tests even if they are not mentally impaired (Özmen, 2017). It is indicated that dyslexia prevalence may be about 5% to 15% (American Psychiatric Association, 2013) and 7% to 16% (Peterson & Pennington, 2015) in school age children. However, the prevalence ratio in Turkey cannot be conveyed accurately yet due to the lack of standards and awareness related with dyslexia identification (Melekoğlu, 2020). Identification is based on the inconsistency between low reading skills and the normal or high intelligence level of the individual based on age (American Psychiatric Association, 2000). Nevertheless, it is not possible in Turkey due to the lack of an intelligence test with a wide sample group. The development of tests for this requirement will not only support accurate identification, but also strengthen early intervention.
It is indicated that having knowledge of the intellectual level of children with hearing disability is beneficial when developing individualized education programs (Maller & Braden, 2011). Individualized education programs are prepared by taking the performance and learning speed of the child. It is suggested to use the performance sections of the intelligence tests that do not require verbal skills when measuring intelligence in children with hearing disability (Braden & Athanasiou, 2005; Maller & Braden, 2011). The first study in Turkey for determining the intelligence level of children with hearing disability in Turkey was carried out by Doğan (2015) using WISC-R intelligence test and it was suggested to determine psychometric characteristics via non-verbal intelligence tests. At this point, it is important to develop non-verbal ability tests.
The identification of gifted children in Turkey reveals the insufficiency of identification tools (The Scientific And Technological Research Council Of Turkey, 2013). The primary reason for this result according to Sak et al. (2015) and Bildiren (2018) is the lack of sufficient experience and knowledge in subjects of identifying gifted individuals and developing intelligence tests as well as the lack of enterprising scientists. Similarly, Sak et al. (2015) consider as primary issues the development of modern and unique identification tools and methods along with the validity of the already existing identification methods. It is suggested in the study by Bildiren (2018) to use non-verbal intelligence tests for identifying gifted children in Turkey coming from lower socio-economic levels in addition to the development of non-verbal intelligence tests. In addition, it is reported that there are difficulties in identifying gifted children with learning difficulty and that it is necessary to apply non-verbal intelligence tests during this process (Bildiren & Fırat, 2020; Firat, 2021). It can be stated that the development of this test during the present study will make significant contributions to both identification and assessment before intervention. Thereby, clinical psychologists, teachers, and specialists will be able to perform rough clinical identification. The aim of the present study was to fill the gap resulting from the lack of measurement tools in individual/group test applications that require ability measurement and student selection. Accordingly, the reliability and validity assessments were carried out for the test. The pilot study was presented as Study 1, whereas the validation study was presented as Study 2.
Method
This was a study for the development of non-verbal cognitive ability test. The test has been named as Bildiren Nonverbal Ability Test (BNV). The objectives of use and theoretical framework have been presented during the development stage. Question items were prepared based on the opinions of specialists. Afterward, reporting steps were followed in accordance with the pilot study (study 1) and norm study as well as the reliability and validity analyses (study 2).
Study 1 (Pilot Study)
Development of the Test
The following steps were followed when preparing the test. First, the theoretical framework was established for the test. BNV has been developed to make more than one intelligence theories functional. However, it was not aimed to develop a test that may be considered as a criterion for the measurement of general intelligence. It is assumed that the developed test is a good representative of Spearman’s (1927) g factor. It is expected that the test will be related to some extent with Guilford’s (1959) structure of intellect theory (cognition, memory, multi-dimensional/convergent and one-dimensional/divergent reasoning, and evaluation). Based on Horn and Cattell’s (1966) two-factor theory, it has been developed to measure fluid intelligence rather than crystallized intelligence. According to Horn (1980), non-verbal intelligence develops at an early age much like fluid intelligence. Fluid intelligence is related with the g factor (Blair, 2006). It has been put forth that non-verbal intelligence tests may accurately measure fluid intelligence (Gustafsson & Undheim, 1996). Human fluid intelligence is also closely linked to task complexity and the process of solving complex problems in a series of simpler, more focused pieces (Tschentscher et al., 2017). Fluid intelligence is theorized to draw on neural processes that overlap with executive functions such as working memory, inhibition, and cognitive flexibility (Burgess et al., 2011; Diamond, 2013; von Bastian & Oberauer, 2014). Fluent intelligence is concerned with general cognition such as logical reasoning, working memory, and decision making. Studies have shown that fluent intelligence is associated with spatial span, digit span, visual short-term memory, and complex tasks (Ackerman et al., 2005; Duncan et al., 2012; Kane & Engle, 2002). It has also been demonstrated in recent studies that fluid intelligence is associated with many processes. It has been found to be relationship with factors such as superior decision making (Sobkow et al., 2020), executive functions (Santarnecchi et al., 2021), working memory (Simpson-Kent et al., 2020; Wang et al., 2021). These characteristics of fluent intelligence were taken into consideration when developing the test. Problem solving, identifying relations, comprehending implications, concept formation, classification, transforming information, and inductive and deductive reasoning can be given as examples to the operations of fluid intelligence defined as the use of purposive and controlled mental functions (McGrew, 2009). An item pool including pattern completion, reasoning by analogy, serial reasoning, visual, spatial, and abstract reasoning was prepared for the evaluation of these procedures as is the case for other non-verbal intelligence tests and expert opinions were taken on these questions. Opinions were obtained from a psychometry specialist, WISC IV Trainer Psychologist, two experts on the education of gifted individuals, two child development experts, two measurement and evaluation experts and two special education experts. Four exemplary items and 65 main application items were developed for the preliminary item tryout based on expert opinions. The test was scored as wrong (0) or right (1). Sample four items and 65 trial items were prepared for the pilot study in accordance with the opinions of specialists.
Participants
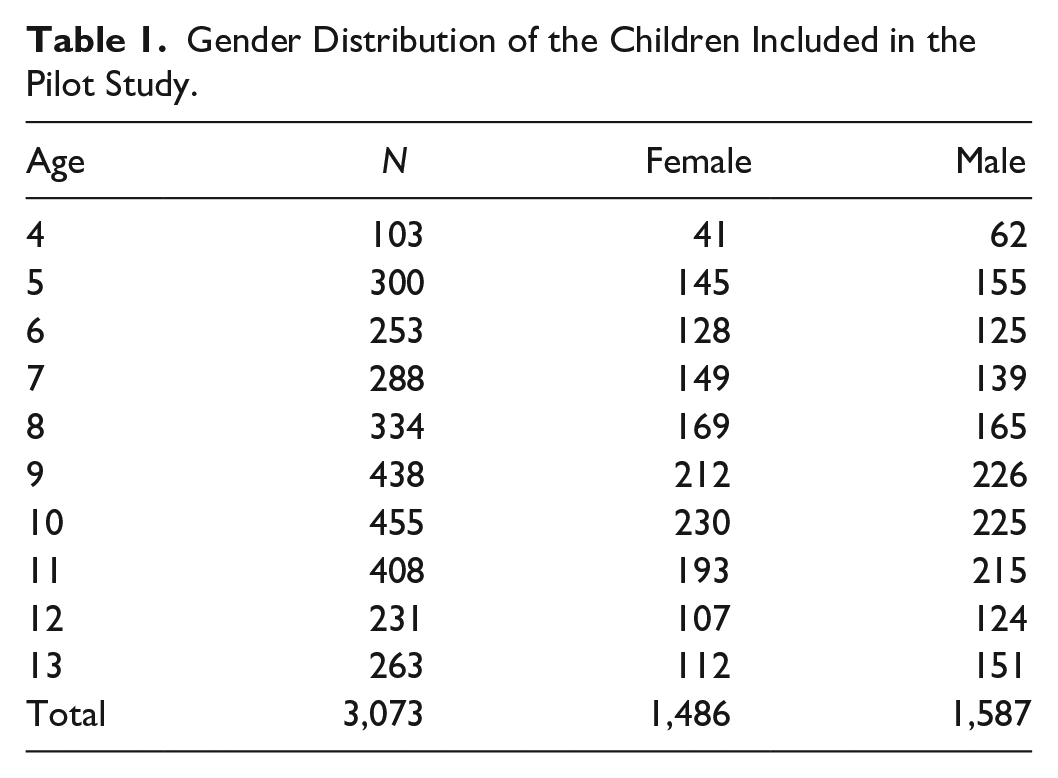
Table 1 presents the age and gender distributions for the children in the 4 to 13 age group of the BNV Pilot Study draft form. Pilot study was carried out with a total of 3,073 children from 26 different schools in 3 different districts.
Gender Distribution of the Children Included in the Pilot Study.
Materials
The pilot study was carried out with 65 trial items. Each item was printed on the booklet in bright colors. The test was initiated with pattern completion items. This was followed by reasoning by analogy items. Thirdly, serial reasoning items were listed. Spatial visualization items come fourth. Finally, the test was completed with abstract reasoning items (Figure 1). Arrangement was as such; 1 point for correct answers and 0 point for wrong answers, blank items or selecting more than one choice.

Examples of item.
Results
Item and test analyses were started after the pilot studies. Item analysis is performed for determining the items to be included directly in the test, items to be revised and items that should be excluded (Turgut & Ve Baykul, 2011). Item covariance based methods and 27% upper-lower group method were used for study data analysis referring to the selection of the items to the test following the pilot study. Table 2 presents the test statistics obtained from the trial form.
Trial Form Information.

More than one question on the same characteristic was prepared among the 65 items. The aim of the pilot study was to select the best functioning items based on the analyses carried out and to prepare the final form. The items in the trial form of the pilot study are selected for the test based on their ability to cover all aspects of the characteristic that they are trying to measure as well as their level of contribution to the validity and reliability of the test (Crocker & Algina, 2008). Item discrimination (ri and rpbi), item difficulty (pj), reliability coefficients were calculated.
Discrimination index was calculated based on item discrimination low group high group (ri). In addition to Rj, it is also important for item discrimination to examine the relationship of the item with the whole test (Crocker & Algina, 2008). In this regard, point bi-serial and bi-serial correlation coefficients are considered as the discrimination index. Each of the three values has been calculated for discrimination. The boundary values based on the discrimination index are as such with regard to which item shall be included in the test; item is not accepted if rjx ≤ 0.19; it can be revised for values between 0.20 and 0.29, it is acceptable for values between 0.30 and 0.39 and it is accepted as a good item if 0.40 ≤ rjx (Ebel, 1965).
Item difficulty index (pi) is a calculated statistics. (pi) is the ratio of those with the correct answer to the whole group. The item is very difficult for difficulty index (pj) values between 0.00 and 0.19, difficult for values between 0.20 and 0.34; moderately difficult for values between 0.35 and 0.64; easy for values between 0.65 and 0.79 and very easy for values between 0.80 and 1.00. Moderately difficulty questions provide the best contribution to the test. Items can be selected which will contribute to ensuring that the mean difficulty index for the test varies between 0.35 and 0.64. In addition to the related calculations, it was also calculated the level at which the mean reliability of the test will increase when the items are removed from the test. A discrimination value of 0.30 was selected in order to make a distinction between high and low success and to provide a better index (Anastasi & Urbina, 1997).
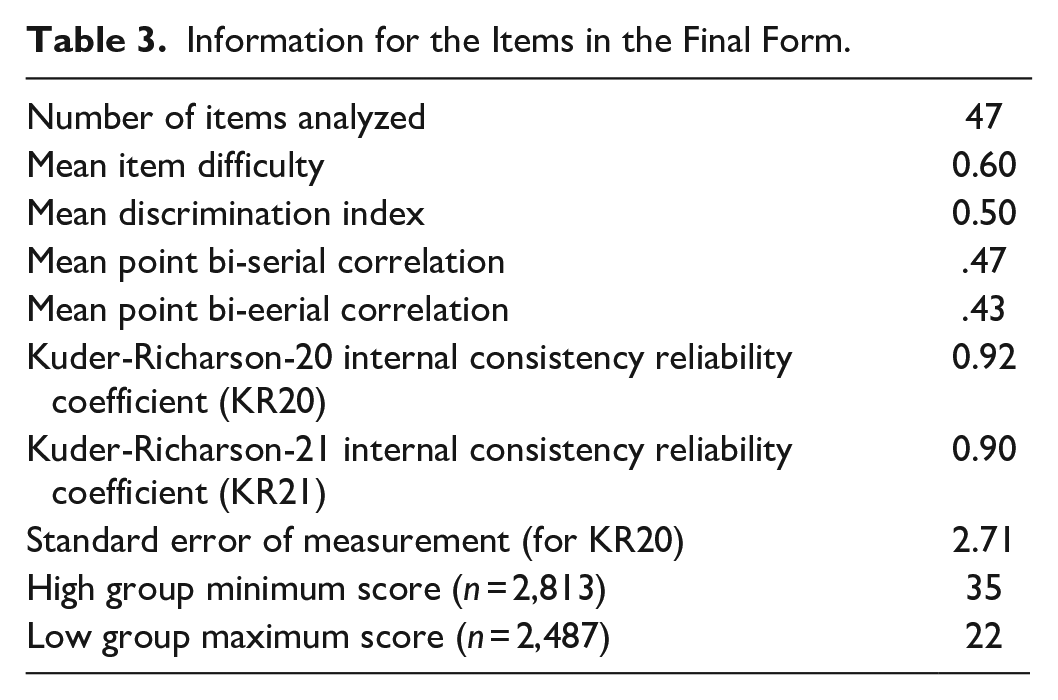
Discrimination index and rbis values were primarily taken into consideration when selecting the item for the test. Based on the related statistics, it is suggested to remove the items with discrimination index values lower than 0.30. Accordingly, items 1, 4, 5, 9, 11, 17, 20, 27, 60 were excluded from the test. However, four items (Items 2, 3, 57, 65) were not removed despite (rji) values of lower than 0.30 since it was considered that these items will make a greater contribution to the test compared with items that measure the same characteristic. On the other hand, items 6, 27, 30, 40, 42, 44, 61, 62,63 were not included in the test even though they have item discrimination (ri) values of above 0.30 since the other items that measure the same characteristic were better. For example, even though the item discrimination index of item 6 was above 0.30, item 7 that measures the same characteristic was selected with an item discrimination index of 0.59, difficulty and bi-serial values of 0.70 and 0.51, respectively. Table 3 presents the information for the items in the final form.
Information for the Items in the Final Form.
Discussion
Test and item statistics were calculated for 65 items in the pilot study. Mean item difficulty level was calculated as 0.546 for 65 items. This is an indication that the test has a moderate difficulty level and that it is a desired test. Similarly, item discrimination index (0.518) shows the discrimination value of the successful upper group and unsuccessful lower group. In addition, the point biserial correlation values indicating the correlation of each item with the total test score point out that the test has sufficient discrimination strength.
Moreover, Kuder-Richardson 20 internal consistency coefficient with values ranging from 0 to 1 were provided for all 65 items as an indication of the correlation between the items or in other words as an indication of whether a characteristic is measured homogeneously or not (Crocker & Algina, 2008). A high value of 0.94 was obtained. Statistical calculations for the 65 items based on the total scores of 3,073 individuals set forth that the mean score for the test is 35,478, median is 36, coefficient of skewness is −0.05 with a minimum score of 7 and a maximum score of 64.
General characteristics of the 65 items indicate a reliable and valid test. Item based reliability and validity analyses were conducted afterward for selecting the items with the highest contribution to the test. It is suggested to use more than one criterion for item selection. Even the first examples of studies in this subject point out that the change in item difficulty and the level of the relation between the item and the total test will render the use of different discrimination indices advantageous (Lord, 1952). In addition, the selection ratios of the items can be examined to determine the presence of reasons such as expression error, misconception or distractor weakness. It was decided at the end of the pilot study to remove 18 items from the test based on item difficulty, item discrimination, item total score correlation and the selection ratios of the item options. The final form of the test is comprised of 47 items and a single dimension. It can be stated that BNV will be good at measuring general ability when it is considered that single dimensional intelligence tests are lower cost tests that are better at measuring g (Benson et al., 2020).
Study 2 Validation Study
Method
Survey model from among quantitative research methods was used in the present study following the pilot study. Even though the survey pattern is one that is conducted on larger sample groups compared with other patterns, it can reveal the characteristics of the participants such as interest, skill, opinion, and ability related with a certain subject (Fraenkel & Wallen, 2006). In other words, survey pattern refers to acquiring data from a large sample group in order to put forth the characteristics of the sample group (Büyüköztürk et al., 2014). Accordingly, reliability and validity study was conducted for the BNV test in order to determine the nonverbal cognitive abilities of children aged 4 to 13.
Participants
From an administrative standpoint, there are 81 provinces and 7 geographical territories in Turkey. Five territories have been defined for sample selection in Turkey during previous demographic studies. This territorial classification has become a frequently used variable for examining the demographic, social, cultural and economic differences in the different territories of the country. The aforementioned Western, Southern, Central, Northern, and Eastern territories are comprised of different number of neighboring provinces. A new territorial classification was developed on September 22, 2002 in addition to the traditional seven geographical territories. State Planning Organization and Turkish Statistical Institute developed a territorial classification at three levels in accordance with Turkey’s European Union accession process and the law numbered 2002/4720. This classification is known as the Nomenclature of Territorial Units for Statistics (NUTS). NUTS system was developed in EU countries and candidate countries in order to ensure that the structural funds provided by the union are distributed fairly; that territorial based plans and policies are developed; that the imbalance between territories is eliminated and to provide an opportunity for comparisons between member countries and the territories of these countries with regard to socioeconomic developments (Doğan & Gökburun, 2019). Turkey has been classified into 12 territories in Level (https://biruni.tuik.gov.tr/bolgeselistatistik/anaSayfa.do). Each province defined a Territorial Unit for Statistics within the scope of Level 3 with the total adding up to 81. In other words, Level 3 encompasses all 81 provinces. There are 26 Territorial Units for Statistics in Level 2 which are defined by grouping the neighboring provinces within the scope of Level 3. In the present study, we preferred the Turkish Statistical Institute Level 1 territorial classification as the most current territorial classification. We randomly selected a province from each of the 12 territories which can represent that territory. Sample size was selected based on specialist opinions and a pre-assessment performed. The procedure was implemented at the centers of the provinces included in the sample group. According to the Ministry of National Education (MNE) 2018/2019 statistics, there are 1,564,813 pre-school students, 5,267,378 primary school students and 5,627,075 secondary school students in Turkey (MNE Statistics, 2019). Number of children was determined with a 5% margin for error for different population sizes when determining the number of sample groups based on these values (Anderson, 1990). The sample group is comprised of a total of 9129 children with 4,464 females (48.9%), and 4665 (51.1%) males. Tables 4 and 5 present the sample information.
Sample Group Determined According to the Turkey Statistics Institute Statistical Region Units Classification.

Distribution of Participants by Gender and Age.

Instruments
Bildiren nonverbal ability test (BNV)
BNV is a non-verbal ability test used for evaluating the reasoning abilities of participants aged between 4 and 13. It is comprised of a total of 51 questions with 4 sample and 47 original items. Each question has six choices. The individual application time varies between 25 and 30 minutes. It has been designed as a short, cultural and non-verbal measure of ability that does not require the child to read, write, or talk. Each correct response is 1 point excluding the sample questions. The calendar age section is considered from the norm table in order to transform the total raw score into percentage score.
Naglieri non-verbal ability test (NNAT)
NNAT developed by Naglieri is a non-verbal measure of general ability which is a precursor of academic success. As is the case for general ability tests, NNAT has been designed to measure general ability and is comprised of 72 figure matrix items. It is scored dichotomously (1,0). Norm study was carried out in the United States of America on 1,585 individuals in the age interval of 5 to 17. Cronbach-Alpha value was estimated as .91 while the test-retest coefficient was determined as .71. Its correlation coefficient was examined via Matrix Analogy Test during construct validity analysis and a relation at a level of .74 was determined. A correlation coefficient of .78 was estimated NNAT and Standard Progressive Matrices Test, .63 between NNAT and TONI-3 and .31 to .65 between NNAT and WISC-IV (Naglieri, 2003).
TONI-3 (Test of Nonverbal Intelligence-3)
Developed by Brown, Sherbenou and Johnsen as a strong criterion for measuring general intelligence. TONI-3 test can be administered to individuals in various sample groups with ages ranging between 6 and 0 months and 89 and 11 months. Korkmaz et al. (2018) conducted the norm and standardization studies for the age interval of 6 and 11. Kuder-Richardson-20 internal consistency coefficient was determined to vary between 0.86 and 0.95 for the A Form of TONI-3 and between 0.90–0.93 for the B Form. Correlations of .79 and .82 were determined between the Standard Progressive Matrices Test and TONI-3 A form and B form, respectively (Korkmaz et al., 2018).
Colored progressive matrices test (CPM)
Developed by Raven for the evaluation of mental development and cognitive processes. The test composed of 36 items and colored visual matrices is administered to children under the age of 11 (Raven et al., 1998). The validity and reliability study was conducted by Bildiren et al. (2017) on 640 children between the ages of 4 and 6. A correlation at a level of .55 (p < .01) was determined between Colored Progressive Matrices Test total test and Test-Retest reliability results. Correlations coefficient at levels of .83, .70, and .62 were determined respectively between CPM and TONI-3, CPM and Bender, CPM and WISC-R test.
Candidate Notification Scale for Gifted Children in the Pre-School Period
The scale developed by Bildiren and Bilgen (2019) based on Renzulli’s The Three-ring Conception of Giftedness theory is comprised of 13 items and 3 sub-scales. It has been developed for the identification of gifted children during the pre-school period. The sub-scales are general intellectual ability, creativity, and engagement. It was observed that the fit indices for the scale range between values that display a good fit and acceptable values after which the three factor and 13 item structure of the scale was verified as a model. A moderate correlation was determined between the developed scale and Colored Progressive Matrices Test and Cognitive Abilities Test (CogAT) tests during the analyses carried out for criterion validity. The reliability of the scale was calculated as .95 via Cronbach Alpha internal consistency coefficient. The general intellectual ability sub-scale was used since BNV makes measurements related with general intellectual ability.
Procedure
Ethical and legal permissions were obtained from the Ministry of National Education first for the pilot study followed by the norm study during the test development stage. The test administrations were carried out after the permissions. The test was administered again 1 month later on 189 children for test-retest reliability analyses during the norm study period. Naglieri Non-Verbal Ability Test, TONI-3 Intelligence Test, and Colored Progressive Matrices Test were administered on a specific number of children in the sample group for validity analyses during the BNV application. In addition, the grades of students for the courses of mathematics, science, social sciences, and Turkish were obtained from their respective schools in order to examine whether the test predicts school success or not.
Statistical Analyses
“Test Analysis Program” (TAP: Test Analysis Program-version) 14.7.4 was used for estimating the item and test statistics for the data obtained from 3,073 children during the pilot study of the test as well as the estimation of the item and test statistics for the data obtained from 9,129 children during the norm study (Brooks & Johanson, 2003). Reliability is defined as “the degree at which measurement results are free from random errors” (Baykul, 2010). The methods used during the reliability study have been classified by Crocker and Algina (2008) methods requiring a single test administration and methods requiring two test administrations. In the present study, test-retest from among the methods requiring two test administration and split-half, KR-20, KR-21 from among the methods based on single test administration were used. The standard error of measurement can be calculated using the standard deviation of the observed scores and the reliability coefficient (Thorndike & Thorndike-Christ, 2010). Standard error is the amount of error in the observed score of the individual and is related with the reliability coefficient. High reliability indicates less standard error. SE calculation was made based on the formula given by Crocker and Algina (2008). In the formula, SE =
It is observed when examined throughout its historical development that rather than a single definition, validity is considered as the collection of evidence indicating that the test has served its purpose. Standards (1999) put forth the different types of validity as face, criterion based, content and construct validity. Content and construct validity and criterion based validity methods have been used for BNV validity analyses. In addition, regression analysis was made with regard to the prediction of success by BNV. Regression analysis was performed with regard to the prediction of success by BNV. Moreover, ANOVA test was applied for analyzing whether the BNV test mean scores differ with regard to grade levels or not. And finally, the correlation between the teacher observations on the general intellectual ability of pre-school children and BNV was analyzed.
Results
The final form of BNV was administered on 9,129 children in the 4 to 13 age group after which item and test statistics were analyzed. It was observed when the values were examined that the mean difficulty level of the test is 0.60, the discrimination mean is 0.50 and that the mean of the point bi-serial correlation coefficient is .43.
Reliability
Internal consistency reliability
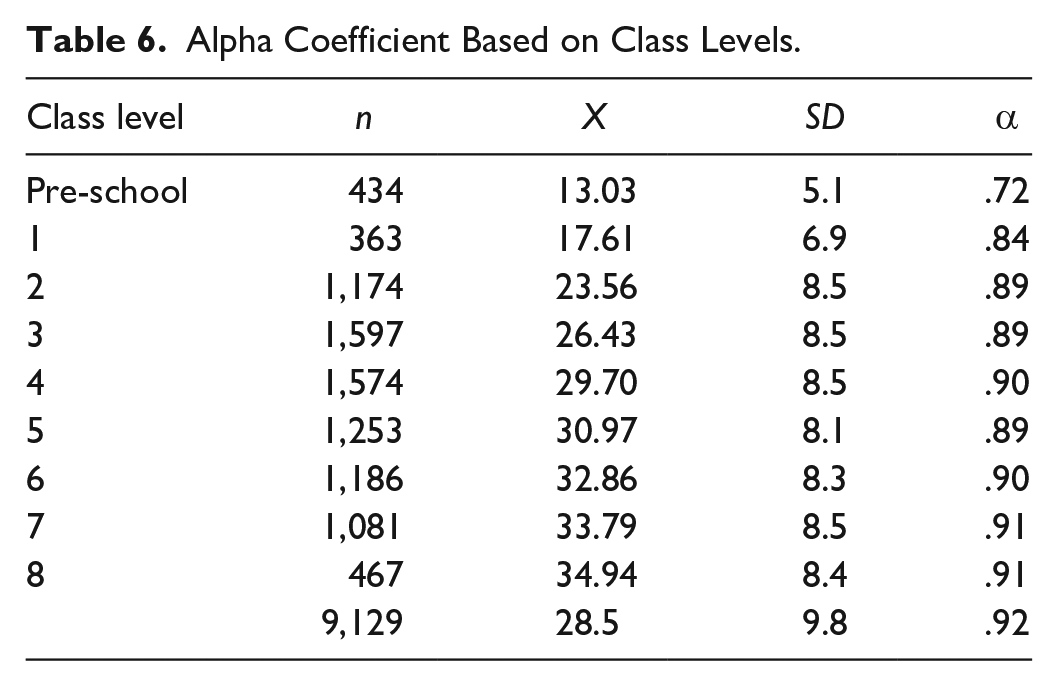
Internal consistency reliability is related with the homogeneity of the test items. Reliability in the sense of internal consistency puts forth that the items are consistent in relation to each other. Internal consistency reliability coefficients of above .70 calculated for each group indicate that BNV is highly reliable (Table 6). The KR 20 reliability coefficient obtained from the whole sample group was estimated as .92. The Spearman Brown coefficient was determined as 0.93 when calculated for odd and even numbered items but the estimated value was 0.87.
Alpha Coefficient Based on Class Levels.
Reliability coefficient and interpretation of the scores
The reliability coefficients calculated based on the age intervals are presented in Table 7. The standard errors calculated based on the reliability coefficients are also presented in the same table. Based on these findings, it can be stated that BNV is reliable for every age level.
Alpha Coefficient Based on Age Levels.

Test-retest reliability
The stability of BNV is based on the fact that it is administered on the individuals twice. BNV test was re-administered on 189 children 30 days after the first administration. Of the sample group of the administration, 47% (88) were female, 53% (101) were male and the age interval was 4 to 13. Mean scores, standard deviation and the correlation coefficient between the two scores were calculated for test-retest reliability evaluation (Table 8). BNV first application result mean score was 27.93, whereas the second application result mean score was 29.60. The correlation coefficient between the two application scores was calculated as .80. It was observed upon examining the values that BNV yields consistent results against age and time. The difference between the two administrations is quite small.
Test-Retest Reliability.

p < .01.
Validity
Content and construct validity
The steps suggested put forth by Crocker and Algina (2008) for content validity was followed in the present study as such; defining the performance domain of interest, taking the opinions of a panel of qualified experts, providing a structured framework for the process of matching the domain related behaviors with the items in the tool of measurement along with collecting and summarizing the data from the matching process. NNAT-I, TONI-3, and CPM were applied for validity analyses. Because these tests are non-verbal intelligence tests and non-verbal measurements have been designed in order to provide opportunities to children with linguistic, cultural, and ethnic differences for displaying their potentials (Kirschenbaum, 1998; Naglieri & Ford, 2005). Lohman et al. (2008) emphasized the necessity to implement non-verbal tests such as CPM, NNAT for ensuring that the abilities are measured fairly. TONI-3 and CPM are used in many different countries in the world during education and health studies to measure non-verbal intelligence (Albanese et al., 2010; Cornoldi et al., 2010; Cotton et al., 2005; Earle et al., 2017; Edwards et al., 2010; Henry, 2014; Lin et al., 2017; O’Brien et al., 2019; Wong et al., 2010). Hence, these tests were preferred for validity analyses.
Relation level with NNAT_I
NNAT-I is a non-verbal ability test is a non-verbal measure of abstract problem solving (Naglieri, 2003). A total of 73 children were randomly selected for NNAT-I implementation from among 9,129 children subject to BNV. Of these children, 31 (43%) were female, 42 (57%) were male with an age interval of 5 to 13. The mean and standard deviation for BNV were 25.55 and 10.6, respectively, whereas the mean and standard deviation for NNAT-I were 28.01 and 10.2 respectively (Table 9). The correlation between the two tools was .71. The level of correlation between the two provides information related with the fact that both measure the same construct.
Relationship Between NNAT and BNV.

p < .01.
Criterion-related validity
Criterion-related validity is based on the calculation of the relation between the scores of the individuals obtained via the measurement tool and the criterion scores with proven validity and reliability for the measured characteristic (Aiken, 1991). It is important that the proper criterion is accepted in the best study for this type of validity (Kane, 2001). Criterion related validity should be used when there is a suitable criterion. Criterion model is a simple, effective, and good approach when the criteria are good (Kane, 2006). It gives a quantitative coefficient for validity (Raykov & Marcoulides, 2011). In this regard, it can be indicated to be more objective (Kane, 2006). TONI-3 Non-Verbal Intelligence Test and Colored Progressive Matrices Test were determined as criterion for determining the criterion based validity of BNV.
Correlation with TONI-3
TONI-3 was applied on 244 children randomly selected from among 9,129 children subject to BNV. Of these children, 122 (50%) were female and 122 (50%) were male. Of the children, 8 were second grade primary school students, 72 were fourth grade students, 102 were fifth grade students, 31 were sixth grade students, and 31 were seventh grade students. Table 10 presents the means, standard deviations and correlations for the test results. BNV mean was 32.23, standard deviation was 7.8 whereas TONI-3 mean was 29.06 and standard deviation was 6.3 (Table 10). The correlation between the two tools was estimated as positively significant and .67. The level of correlation provides information on the fact that both measure the same construct.
Relationship Between TONI-3 and BNV.

p < .01.
Correlation with CPM
CPM was applied on 88 children randomly selected from among 9,129 children subject to BNV. Of these children, 41 (46.6%) were female and 47 (53.4%) male. Of the children, 27 were preschoolers, 12 were first grade students, 14 were second grade students, 17 were third grade students while 18 were fourth grade students. Table 9 presents the test result means, standard deviations and correlations. BNV mean was 22.59 while CPM mean was 25.28. There is a correlation of .86 between the two tools (Table 11). The level of correlation provides information on the fact that both measure the same construct.
Relationship Between CPM and BNV.

p < .01.
Correlation with academic achievement
Simple regression analysis was used for examining the correlation between the BNV scores and the school success grades and to determine whether BNV predicts school success in case they are correlated. Simple regression analyses were carried out separately for each course with the related course acting as the dependent variable and BNV total score as the independent variable (Table 12). β coefficients were obtained from different analyses. Mathematics, Turkish, Science and Social Sciences scores of 260 students subject to BNV were obtained from the school administration. Of the students, 126 (49%) were female and 134 (51%) were male. Chronological ages vary between 9 and 13.
Regression Analysis Results Regarding the Prediction of Academic Achievement.
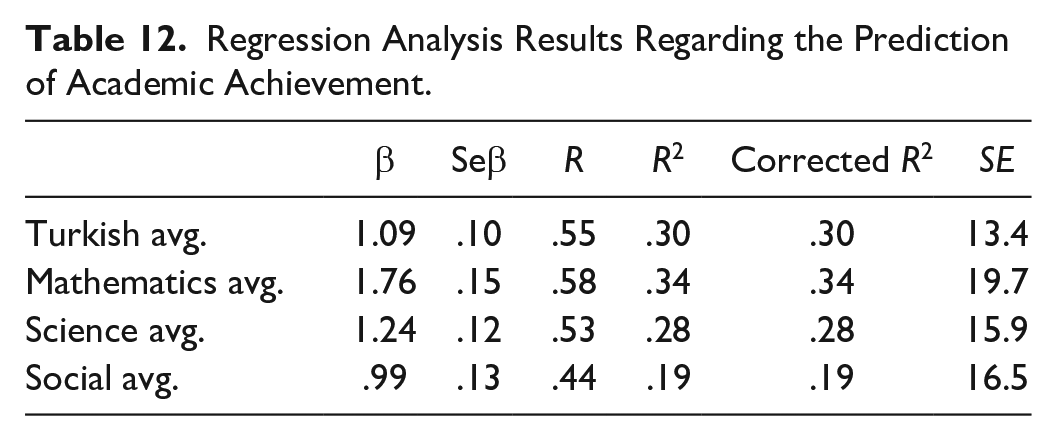
It can be observed when the values in Table 10 are examined that BNV is a precursor of academic achievement. BNV scores can explain 0.34 of the variety in the academic achievement of students for mathematics course. Similarly, 0.28 of the achievement in science course and 0.30 of the achievement in Turkish course can be explained by BNV score.
Difference Between Grade Levels
BNV was applied on 9,129 children from kindergarten to eighth grade. One way analysis of variance was used for estimating whether BNV total score varies according to grade levels or not. Accordingly, there was no statistically significant difference between the grade levels (F[8,9120]=488.529, p < .05). It can be observed when Table 13 is examined for determining the grades between which there is a difference that the mean value increases with increasing grade levels and that the grade averages differ at a statistically significant level.
Descriptive Statistics of BNV Scores Subject to Grade Levels.

Relationship Between BNV and Teacher Observation
Teachers of 33 preschoolers subject to BNV were asked to fill in the general intelligence subscale of the Candidate Notification Scale. The mean age of the children was 4.6. While the mean value of BNV was 12.03, the mean value for the general intelligence subscale of the nomination scale was 19.36. The correlation between these two tools was 0.56 (Table 14). It can be put forth that the non-verbal cognitive abilities of the children measured via BNV and their general intelligence abilities based on teacher observation are moderately correlated.
Relationship Between BNV and Teacher Observation.

p < .01.
Discussion
The purpose of the present study was to develop a national Non-Verbal Cognitive Ability Test. Following pilot study for the scale, norm study for an age interval of 4 to 13 was conducted at 12 provinces subject to TSI (Turkish Statistical Institute) Level I Region classification. It was concluded as a result of the reliability and validity analyses carried out following the norm study that the test has sufficient psychometric characteristics.
During the reliability analyses of BNV, among the techniques based on two applications and split-halves, the test-retest technique and among the techniques based on a single application, the KR-20, KR-21 was utilized (Crocker & Algina, 2008). Al-Shahomee et al. (2018) conducted a study using the Standard Progressive Matrices test as a result of which the Cronbach alpha coefficient was observed to vary between .87 and .94. Alhinai et al. (2019) identified the reliability coefficient as .85 during the CPM reliability analysis. In the study conducted by Bildiren (2017), it was aimed to test CPM in terms of reliability and validity with a sample group of children with ages ranging from 3 to 9. The Cronbach alpha coefficient for the complete scale was obtained as .83, whereas the Spearman Brown split-half test correlation was calculated as .80. Banks and Franzen (2010) carried out a reliability study using TONI-3 test in which the Cronbach alpha coefficient was obtained as .93 for the whole scale. Similarly, Korkmaz et al. (2018) carried out a standardization study on the 6 to 11 age group for TONI-3 as a result of which Kuder-Richardson-20 internal consistency reliability coefficient was observed to vary between .86 and .95 for the A form of TONI-3 and between 0.90 and 0.93 for the B Form. It can be stated when the reliability analyses for the close-up studies of nonverbal tests were examined that the reliability values for BNV show similarities. Relatively high-reliability proofs have been reported for all versions of NNAT (Naglieri, 2003, 2011, 2018). The correlations between the Naglieri Ability Index for NNAT-I and NNAT-II along with NNAT-III and NNAT-II vary between .77 and .79 and .73 and .79, respectively. According to the third manual (Naglieri, 2018), NNAT-III has high internal consistency at grade levels. The internal consistency estimates for data from the pre-school to fourth-grade range between 0.80 and 0.88. For the data from students in grades 5 through 12, the manual reported alpha reliability estimates ranging from .81 to .89 and odds-even reliability estimates ranging from .82 to .90. Overall, the data from the technical manuals revealed that NNAT is consistent among its versions, formats, and grade levels. BNV test displays high internal consistency values and similarities with NNAT tests at grade levels. Moreover, BNV test mean scores are similar to CPM, NNAT and TONI-3 tests and increase depending on age levels as reported in the study by Smirni (2020).
Non-verbal intelligence tests NNAT, CPM, and TONI-3 used in international and national literature were identified as criteria for the criterion related validity analyses of BNV. The correlations between BNV and NNAT, CPM and TONI-3 tests were identified respectively as .71, .67, and .86. It was reported in the present study that these tests applied for criterion-related validity have yielded valid results in contemporary studies as well. As an example, Lee et al. (2021) carried out a meta-analysis study examining 29 NNAT related studies as a result of which it was identified that NNAT displays high correlations between NNAT and other measurements. A correlation was identified in the study by Marchesini (2020) between NNAT and The Cognitive Abilities Test which measures reasoning in three areas (Verbal, Quantitative, and Nonverbal). Lúcio et al. (2019) conducted a psychometric study on CPM as a result of which it was also demonstrated that the items are largely measurement invariant. Bildiren and Kargın carried out a reliability and validity study related with CPM in which a statistically significant correlation was also identified between the CPM scores and the scores for Bender Geştalt Test, Toni-3 Test, and Wechsler Intelligence Scale for Children-Revised. The study performed by Resende et al. (2019) put forth a strong correlation between The Rorschach Developmental Index as a composite measure of psychological development and non-verbal intelligence (CPM). Multiple regression analysis revealed that 71% of the variability in psychological development is related with CPM. de Araújo Vilhena and Pinheiro (2020) identified a moderate correlation between Reading Test and CPM. Ghazali et al. (2018) carried out a study aiming in which both CPM and TONI-4 showed good construct validity (ranging from r = .56 to r = .77 for CPM, and r = 0.85 for TONI-4) and good concurrent validity. It was reported as a result of the study by Bildiren and Korkmaz (2018) aiming to test the TONİ-3 intelligence test on gifted children that the TONI-3 test is related with Raven’s Standard Progressive Matrices Test. It is apparent when the validity results for the NNAT, CPM, and TONI-3 tests during development phase as well as in contemporary studies are considered that all three tests yield valid results. BNV displayed the expected correlation with all three tests. It can be indicated that the findings of the present study provide important proofs regarding the validity of BNV.
Many studies have been carried out on the relationship between intelligence and achievement (Balboni et al., 2010; Fergusson et al., 2005; Rushton et al., 2003; Watkins et al., 2007). Gygi et al. (2017) carried out a study with different intelligence tests as a result of which it was determined that the intelligence tests predict school grades at a significant level. Tikhomirova et al. (2017) found a significant link between non-verbal intelligence test scores and achievement in mathematics. A meta-analytical review conducted by Peng et al. (2019) reported that fluid intelligence is moderately associated with reading skills and mathematics achievement. Tikhomirova et al. (2020) also found that there is a significant link between nonverbal intelligence and academic achievement. The correlation levels with nonverbal intelligence were .48 for mathematics achievement, .47 for linguistic achievement, and .43 for biology achievement. Furthermore, Schmidt et al. (2020) revealed that fluent intelligence is significantly associated with standardized achievement tests scores. It was illustrated based on the correlation analysis on BNV test that fluent intelligence is closely related with academic achievement and this finding is consistent with previous studies regarding the pioneering role of fluent intelligence on learning (Niazi et al., 2020; Verbitskaya et al., 2020). One interpretation for this finding might be that students with high levels of fluent intelligence base their knowledge on expert strategies in order to solve a problem (Deary et al., 2007). In addition, the risk is higher for children with low IQ to acquire learning outcomes that are lower than expected compared with normal IQ children (Dai et al., 2020). The relationship between BNV and achievement has also been examined in the present study. We found that BNV is related with the achievements of children in mathematics, Turkish, science and social sciences courses and that 0.34 of the variation in mathematics achievement is accounted by BNV scores. The prediction success of achievement by non-verbal tests vary between 0.3 and 0.6 (McCallum et al., 2001). Verbal intelligence scores tend to have greater prediction validity with regard to achievement compared with non-verbal scores (Lakin & Lohman, 2011). Hence, it is suggested to prefer a method in which verbal and numerical abilities are evaluated together for determining the performance (Lohman et al., 2008). In addition, this predictive validity may guide the educators especially with regard to predicting the performances of students and to take the necessary precautions for students with low and high performance.
CPM and NNAT tests are among the first to come to mind in literature regarding the tests that are independent of culture and language (Balboni et al., 2010; Burns & O’Leary, 2004; Castellano, 2002; Lohman et al., 2008). Lohman et al. (2008) put forth that non-verbal CPM and NNAT tests are frequently used to identify gifted children with different languages during the pre-school period. Similarly, Lohman et al. (2008) also assert the necessity of utilizing non-verbal tests such as CPM and NNAT in order to measure the abilities of children in cases when they do not have sufficient command of the language of the country they live in. It is put forth that NNAT is a measure of intelligence independent of the culture reflecting the ratios of gifted White, Black and Hispanic students in the general population (Naglieri & Ford, 2003). It is considered that BNV may contribute to a fairer identification of children from low socio-economic levels and different cultures since it is a non-verbal test. Even though non-verbal tests enable fairer identifications of children from low socio-economic levels and different cultures, it should be taken into consideration that such tests have advantages as well as disadvantages. It should also be taken into consideration that non-verbal tests may lead to problems in fair identification based on socioeconomic level (Carman & Taylor, 2010; Carman et al., 2018). As put forth by Lohman and Gambrell (2012), non-verbal tests may be beneficial, however they have significant limitations with regard to ability identification. However, non-verbal assessments may hold an important place as an intelligence screening tool for the identification of gifted individuals together with achievement criteria in other areas (Olszewski-Kubilius & Corwith, 2018). For this purpose, developing additional normative perspectives may contribute significantly to the identification of academically gifted children.
Naglieri and Ronning (2000) carried out a study in which NNAT was administered on White, Afro-American, Hispanic and Asian children. The study results put forth that carefully matched White and ethnic minority groups display minor differences in NNAT. It was determined that there is a very small difference between the NNAT score means of white and Afro-American children and those of other ethnic groups. Minimal differences were observed for the White and Hispanic children and no difference was observed for the White and Asian children. The similarities between mean scores and achievement predictions indicate that the NNAT scores obtained by these paired samples can be used for a variety of children. Today, many immigrants from the Middle East come to Turkey due to the wars in the region. The children of these families continue their education in Turkey. However, no tests are administered for determining the educational needs and performances of these children. BNV can be utilized on children from different nations currently living in Turkey when the level of relation between BNV and NNAT, TONI-3 and CPM along with the impact of culture on non-verbal tests is minimal.
Gifted children in Turkey are educated at the Science and Art Centers. Identification takes place in three stages. The first stage is the nomination of the student by the teacher. The second stage is the application of group screening tests. The third stage is the implementation of individual intelligence tests (MNE Bilsem Directive, 2019). Significant problems are experienced especially during the second stage due to the lack of a non-verbal intelligence test based on a wide sample group (Bildiren, 2018; Sak et al., 2015). The number of nominated students in the country continues to increase annually. A total of primary school first, second and third grade students have been nominated in 2018 by classroom teachers in the country (Özer, 2021). BNV can be considered as an alternative during the group screening stage. It can be used as a screening test before the individual intelligence test.
The impacts of various developmental risk factors can be prevented, ameliorated and reduced for small children by way of early identification and intervention (Guralnick, 1998). Accurate assessment is important for early intervention with formal and informal assessment tools suggested to be used during the assessment stage (Kargın, 2017). However, there is no non-verbal ability test that can be used as a formal assessment tool for contributing to pre-school assessment in Turkey. In this regard, BNV may contribute to the assessment stage before early intervention. BNV can indirectly support early intervention when we consider the positive impact of early intervention on the cognitive development of the child as well as on the academic and social life (Camilli et al., 2010).
The fact that criterion-related validity for BNV has been carried out only according to non-verbal tests is a major limitation of the study. It is suggested for future studies to examine the correlation of BNV with tests such as Wechsler Intelligence Scale for Children-Revised (WISC-R), Wechsler Intelligence Scale for Children, Fourth Edition (WISC-IV), and Wechsler Nonverbal Scale of Ability (WNV) and to carry out different statistical analyses. The general claim of non-verbal tests is that they are devoid of the impacts of culture (Lohman et al., 2008; Naglieri & Ford, 2005). Even though BNV has been administered in 12 different regions, it is suggested to examine the test on children from different nations in the country. Despite these shortcomings, it can be stated when the results of the present study are taken into consideration that BNV can be used for measuring the non-verbal cognitive abilities of children.
Conclusion
The aim of the present study was to conduct the reliability, validity, norm and standardization studies for BNV in Turkey for a sample group aged between 4 and 13. Our findings provide encouraging evidence regarding the reliability and validity of BNV. It is expected to contribute to the identification of nonverbal cognitive ability, rapid clinical assessment as well as individual/group test applications that require student selection. Even though it is emphasized that nonverbal tests are more successful in socio-cultural factors (Hodges et al., 2018), it should be taken into consideration that the results should be revised continuously in order to preserve the validity of these tests (Lee et al., 2021). Regardless of the selected instrument, the use of nonverbal ability test by itself may not be sufficient to fill the gap in identification (Carman et al., 2020). It can be indicated that BNV can be used effectively in identifying nonverbal intelligence together with other achievement criteria.
Footnotes
Declaration of Conflicting Interests
The author(s) declared no potential conflicts of interest with respect to the research, authorship, and/or publication of this article.
Funding
The author(s) received no financial support for the research, authorship, and/or publication of this article.