
Abstract
Payments for environmental services (PES) are usually considered as a useful tool to both protect the environment and generate multiple income streams for mountainous households who receive the payments, and thus, it has been widely implementing in many developing countries so far; however, the impact of it on local livelihoods and environment has been questioned. Therefore, the article aimed to evaluate the Vietnamese PES scheme’s effect on both environment and local livelihoods by surveying 282 households living in Quang Nam, Vietnam, and utilized the propensity score matching (PSM) technique to investigate the intervention policy’s influence. Furthermore, to evaluate PES’s effect on the environment, the article used Normalized Difference Vegetation Index (NDVI) as a measure of the photosynthetic level of forest trees. The calculation of NDVI relied on satellite images downloaded from the Moderate Resolution Imaging Spectroradiometer. The results indicated that (a) the natural forest status has been improved during PES implementation compared with that of pre-PES period regarding total forest areas, percentage of forest coverage, and vegetation cover; and (b) PES-participants have got a significantly lower income than nonparticipants regarding total annual income, agricultural income, and hired labor income. The limitation is that the impact of interventions on livelihoods and the environment is determined by the mutual combination of implemented programs rather than only the PES regime. So, we highly recommend that the future study separate the PES scheme’s actual impact to precisely evaluate the PES project’s effect on financial and environmental outcomes.
Keywords
Introduction
Ecosystem services (ESs) can be widely considered as “the benefits of nature to households, communities, and economies” (Boyd & Banzhaf, 2007, p. 4) or, simply speaking, “the good things nature does” (Jennkins, 2019). The functionality of ecosystems, such as food chain, forest ecosystems, health ecosystems, energy flow, and wetland ecosystems, provides a wide range of benefits to people like agricultural products, timber, aquatic products, and landscape value for the development of the tourism industry (Costanza et al., 2014; García-Llorente et al., 2012). In general, the benefits humans obtain from ecosystems are being understood as “ecosystem services” that are incredibly essential to the decay of wastes, the provision of clean water, and the protection of flora and fauna (Nelson et al., 2009).
While some goods and services are now traded in the market such as electronic devices, food and drink, and tourism services, which are assigned economic value through supply and demand relationship, ESs are considered as “public goods” (Costanza et al., 1997, 2014) or “positive externalities” (Engel et al., 2008; Kremen & Miles, 2012). As a result, ES provision is always lower than consumer demand because the marginal private benefit is smaller than the marginal social benefit (López-Pintor et al., 2018). Therefore, it is necessary to make a direct or indirect payment to ES providers to encourage the conservation and preservation of ESs (Costanza et al., 1997; Engel et al., 2008; Kolinjivadi et al., 2014; Steger et al., 2018). With that idea, the term payments for ecosystem services or payments for environmental services (PES) has appeared since the 1970s (Gómez-Baggethun et al., 2010). Furthermore, PES’s backbone is the Coasean theory, which states that no matter who holds property rights over assets, the social efficiency could be reached through negotiation with the assumption of complete competitive markets and no transaction costs (Holcombe, 2018). Differently stated, the provision of environmental goods and services may achieve Pareto optimality (Lai et al., 2020). Therefore, the creation of markets for exchanging ES becomes the implication for market failures, which leads to the under-provision of this type of services.
Across the world, PES schemes, with the aim of protecting the environment and enhancing local livelihood, have been implemented in both developed and developing countries (Bremer et al., 2019; Ito et al., 2019). Many PES programs are established on the project-based institutional framework. At the same time, other schemes depend on such a complex institutional framework to explain the changing trend of some well-defined services, as payments for the reduction in CO2 emission (Ezzine-de-Blas et al., 2019). In addition, many studies also show that there are a lot of factors leading to the failure or success of PES programs, especially in the sub-nation context, consisting of (a) existence of sufficiently legal tools that clarify the property rights and bases for trading environmental services and reallocating related benefits (Pauline, 2016); (b) establishment of rules for markets, such as by setting some criteria for what is being sold, who will buy, and who will be paid for transacting environmental properties (Hanley et al., 2019); (c) power balance and effort among actors in implementing PES schemes (Makatta et al., 2015); and (d) recognition of property rights of the community where PES programs are carried out (Pelletier et al., 2016). While PES does create forest-conservation gains by avoiding loss of deforestation and degradation, Ruggiero et al. (2019) emphasize that PES schemes’ effectiveness should only be considered as a complementary strategy to other conservation policies.
Since the 1990s, the policy for forest management of Vietnam has been changing dramatically. Instead of concentrating on exploiting forest resources for developing economic activities, many programs, specifically the Five Million Hectare Reforestation Program and the Vietnam Forest Certification Scheme Program, emphasize the importance of the conservation, preservation, and protection of forests to sustainably exploit forest resources and minimize the negative impacts on forests, particularly for native forests (McElwee et al., 2020; To & Dressler, 2019). Along with the change of the forest management mechanism, PES was established in 2008 and then was implemented nationwide in 2009 according to Decree No. 99. Some scholars have argued that the PES mechanism of Vietnam vastly differs from the initial PES definition, particularly the government establish payment levels for PES-participants based on the specific forms of ESs, namely, the provisioning of fresh drinking water, protection of wetland, the decomposition of industrial wastes, and reduction of biodiversity loss.
Under Decree No. 99, Quang Nam province, located in the middle of Central Vietnam, has been implementing the PES scheme since 2012, focused on some types of forest environmental services, including carbon sequestration, provisioning of flood control services, reduction of land erosion, and water protection and biodiversity. However, to the best of the authors’ knowledge, a few studies investigate the PES scheme’s influence on both financial outcomes and the environment. Until now, a little literature has assessed the implementation of this policy in Vietnam, such as improvement of forest coverage, the betterment of land quality, and avoidance of biodiversity loss (Duong & De Groot, 2020; McElwee et al., 2020; To & Dressler, 2019; Tuijnman et al., 2020). However, none of them have investigated factors affecting both the financial outcomes of households and the environment (i.e., forest cover, the rate of burned forest, deforestation rate). Furthermore, according to Sharma et al. (2019), the motivation for landowners to participate in the PES schemes is unclear while there is a shortage of studies of the effects on PES-participants’ livelihoods, too. Hence, to fill the knowledge gap in the extant literature regarding ES programs in developing countries, this article aimed to estimate the influence of the existing PES program on the local livelihoods and the environment with the study site of Quang Nam province of Vietnam. To clarify the research purpose, the article would focus on answering two research questions:
The main contributions of this article are as follows:
The article contributes to the growing literature concerning the impacts of conservation schemes on livelihood and environment by analyzing the effects of participation in Vietnam’s PES program using household survey data.
The study also contributes to methodologies relating to treatment effect in observational studies by deploying the propensity score approach, has not yet been sufficiently addressed by existing literature, to measure the PES schemes’ efficiency.
The study provides practical implications for policy makers in designing, implementing, leading, and controlling the intervention schemes.
The next section will briefly introduce literature reviews related to the relationship between PES and the environment and livelihood outcomes; the “Method” section presents in detail the methodology used; empirical results, discussion, and policy implications are presented in the “Results and Discussion” section; and the last section will be main conclusions and limitations for further studies.
Literature Reviews
Impact of PES Schemes on Livelihood Outcomes
Although so much empirical evidence illustrates PES programs’ impact on the environment, many scholars have argued the effectiveness of PES projects on sustainable rural livelihoods, including poverty alleviation, job creation, and restructuring of the local economy. Some literature demonstrates that although the PES project significantly affects the effectiveness of environmental conservation, it negatively affects the socioeconomic growth of rural and mountainous areas (Arriagada et al., 2015; Wang et al., 2019). According to Shao et al. (2018), even though the PES actions have substantial impacts on nation conservation regarding forest cover, land loss, and biodiversity, no evidence shows the betterment of household properties or living conditions. However, this study’s main limitation is a relatively small sample size, including 79 individuals and 14 tourism companies; thus, the empirical result was difficult to assure the robustness. Also, Moros et al. (2019) explained that though the PES scheme increased agricultural production investment through low-rate loan solutions and stimulated consumption, it reduces inputs for production activities, including cattle and hired labor. The PES-related studies on the household scale show divergent results on earnings, social welfare, and production costs (Hayes et al., 2017; Moros et al., 2019; Shao et al., 2018). The reason is explained by Li and Zander (2020) that the impact of PES may highly depend upon the specific context, meaning that the PES policy does not indeed make improvements on financial outcomes for participants. Other meta-analysis studies illustrate conservation actions having both an insignificant increase in local income and little contributions to poverty reduction at the household scale (Hayes et al., 2017; Jack & Santos, 2017; Liu & Kontoleon, 2018; Shao et al., 2018). Furthermore, the protected areas, on one hand, may conserve ways of life for indigenous people and, on the other hand, may decrease the household’s economic status to some degree, despite not hindering their development. Socioeconomic evaluations of the current PES policies also conclude that such preservation schemes are likely to result in adverse effects to local livelihoods, for instance, inefficiency production and lower agricultural productivity, and may lead to social pressure due to unbalanced allocation of economic benefits (Kanchanaroek & Aslam, 2018; Manjula et al., 2019; Treacy et al., 2018).
Contrary to the above-mentioned arguments, some other studies posit that the PES intervention has relatively direct effects on income-generating activities, for example, enhancement of knowledge for residents, and also illustrate to have a significantly positive impact on the total income of the household, but do not affect household income from nonagricultural activities such as tourism and handicrafts (Bottazzi et al., 2018; Izquierdo-Tort et al., 2019). Furthermore, PES schemes in Mexico also result in the improvement of local income by generating more jobs for the local community and expanding income-generating activities, such as livestock and poultry raising, handicrafts, and tourism (Costedoat, 2017; Izquierdo-Tort et al., 2019). Moreover, although the direct payments from the PES scheme may be insufficient to boost total disposable income (Jones et al., 2018) and to diversify sources of income streams (Rodríguez-Robayo & Merino-Pérez, 2018), the PES actions help to increase community skills and knowledge on the functionality of forest conservation (Blundo-Canto et al., 2018) as well as providing many other revenue streams, namely, forest services and off-farm jobs (Izquierdo-Tort et al., 2019). The other PES studies in Costa Rica, Mozambique, and Mexico make similar arguments, too (Arriagada et al., 2015; Samii et al., 2014). Milder et al. (2010) predict that by 2030, the market value for conserving biodiversity may benefit 10 to 15 million poor households in developing nations like Vietnam, Myanmar, and Laos; for carbon sequestration, it may benefit 25 to 50 million; for conserving watershed, it may benefit 80 to 100 million; and for landscape beauty and tourism, it may benefit 5 to 8 million. Although the studies mentioned earlier resulted in valuable findings, their main limitation is that they only describe briefly household’s behavior (Kwayu et al., 2017) and assess differences among households relating to socioeconomic characteristics at a short period of time (Jones et al., 2018) because of the lack of longitudinal survey, and thus, they may not be able to capture the dynamics of intervention actions over time nor lag effects, which could affect policy interventions’ efficiency. Another limitation is ignoring some contextual factors, such as community facilities (e.g., schools, health care protection center, and hamlet-level cultural center) and local resources (e.g., tourism potential and mineral resources), which may substantially affect rural household’s decision on the PES participation.
Impact of PES Schemes on the Environment
Almost the recent researches point to the positive outcomes on the environment in terms of nature conservation (To & Dressler, 2019), biodiversity (McElwee et al., 2020), avoided soil loss (McElwee et al., 2020), and reduced forest burning and improved indigenous land rights (Duong & De Groot, 2020; Tuijnman et al., 2020). In addition, PES schemes generally positively affect the environment in some specific contexts, for example, an enhancement in erosion rates and forest coverage rate (Samii et al., 2014; Snilstveit et al., 2019). In detail, PES projects have impacts on deforestation with standardized mean differences (SMDs) of −0.12 (95% confidence interval [CI] = [–0.19, –0.05]), meaning that there is a decrease in clear-cutting rates in areas where the subject to a PES program when compared with an untreated area does not receive any support from the PES program. Furthermore, PES schemes result in forest cover growth with SMDs of 0.35 (95% CI = [0.10, 0.55]), which leads to a larger forest coverage rate in PES regions compared with control areas.
In contrast, Baral et al. (2018), López-Pintor et al. (2018), and Diswandi (2017) argue that while PES programs contribute substantially to nature protection, they can cause some potential risks, including forest degradation, a decrease of biodiversity and loss of forest cover, and inefficient resource distribution, if the PES design is not identified essential five requirements: (a) clear identification of buyers and sellers of ESs, (b) clear definition of the provided ES, (c) assurance of compliance agreement, (d) compliance penalties, and (e) cost-based payments. On average, nontreated parcels in the Mexican pilot PES schemes have a higher deforestation rate risk than treated ones with estimated coefficients of 0.074 and 0.066, respectively (Costedoat, 2017). Nonetheless, data for analysis were cross-sectional; therefore, the intervention policy’s effectiveness and efficiency toward the environment were hard to ensure. In addition, O’Kelly et al. (2012) warned that the local community’s ineffective and unsustainable use of forest resources in protected areas could lead to trade-offs from a biodiversity conservation perspective. Accordingly, protected areas might result in less effective outcomes at protecting key species. Nevertheless, this research did not suggest any managerial solutions to encourage farmers to enthusiastically join in ecosystem payment projects and how to develop diversification and protect threatened and endangered species in protected regions was also ignored (Table 1).
The PES-Related Studies Regarding the Local Livelihoods and the Environment.
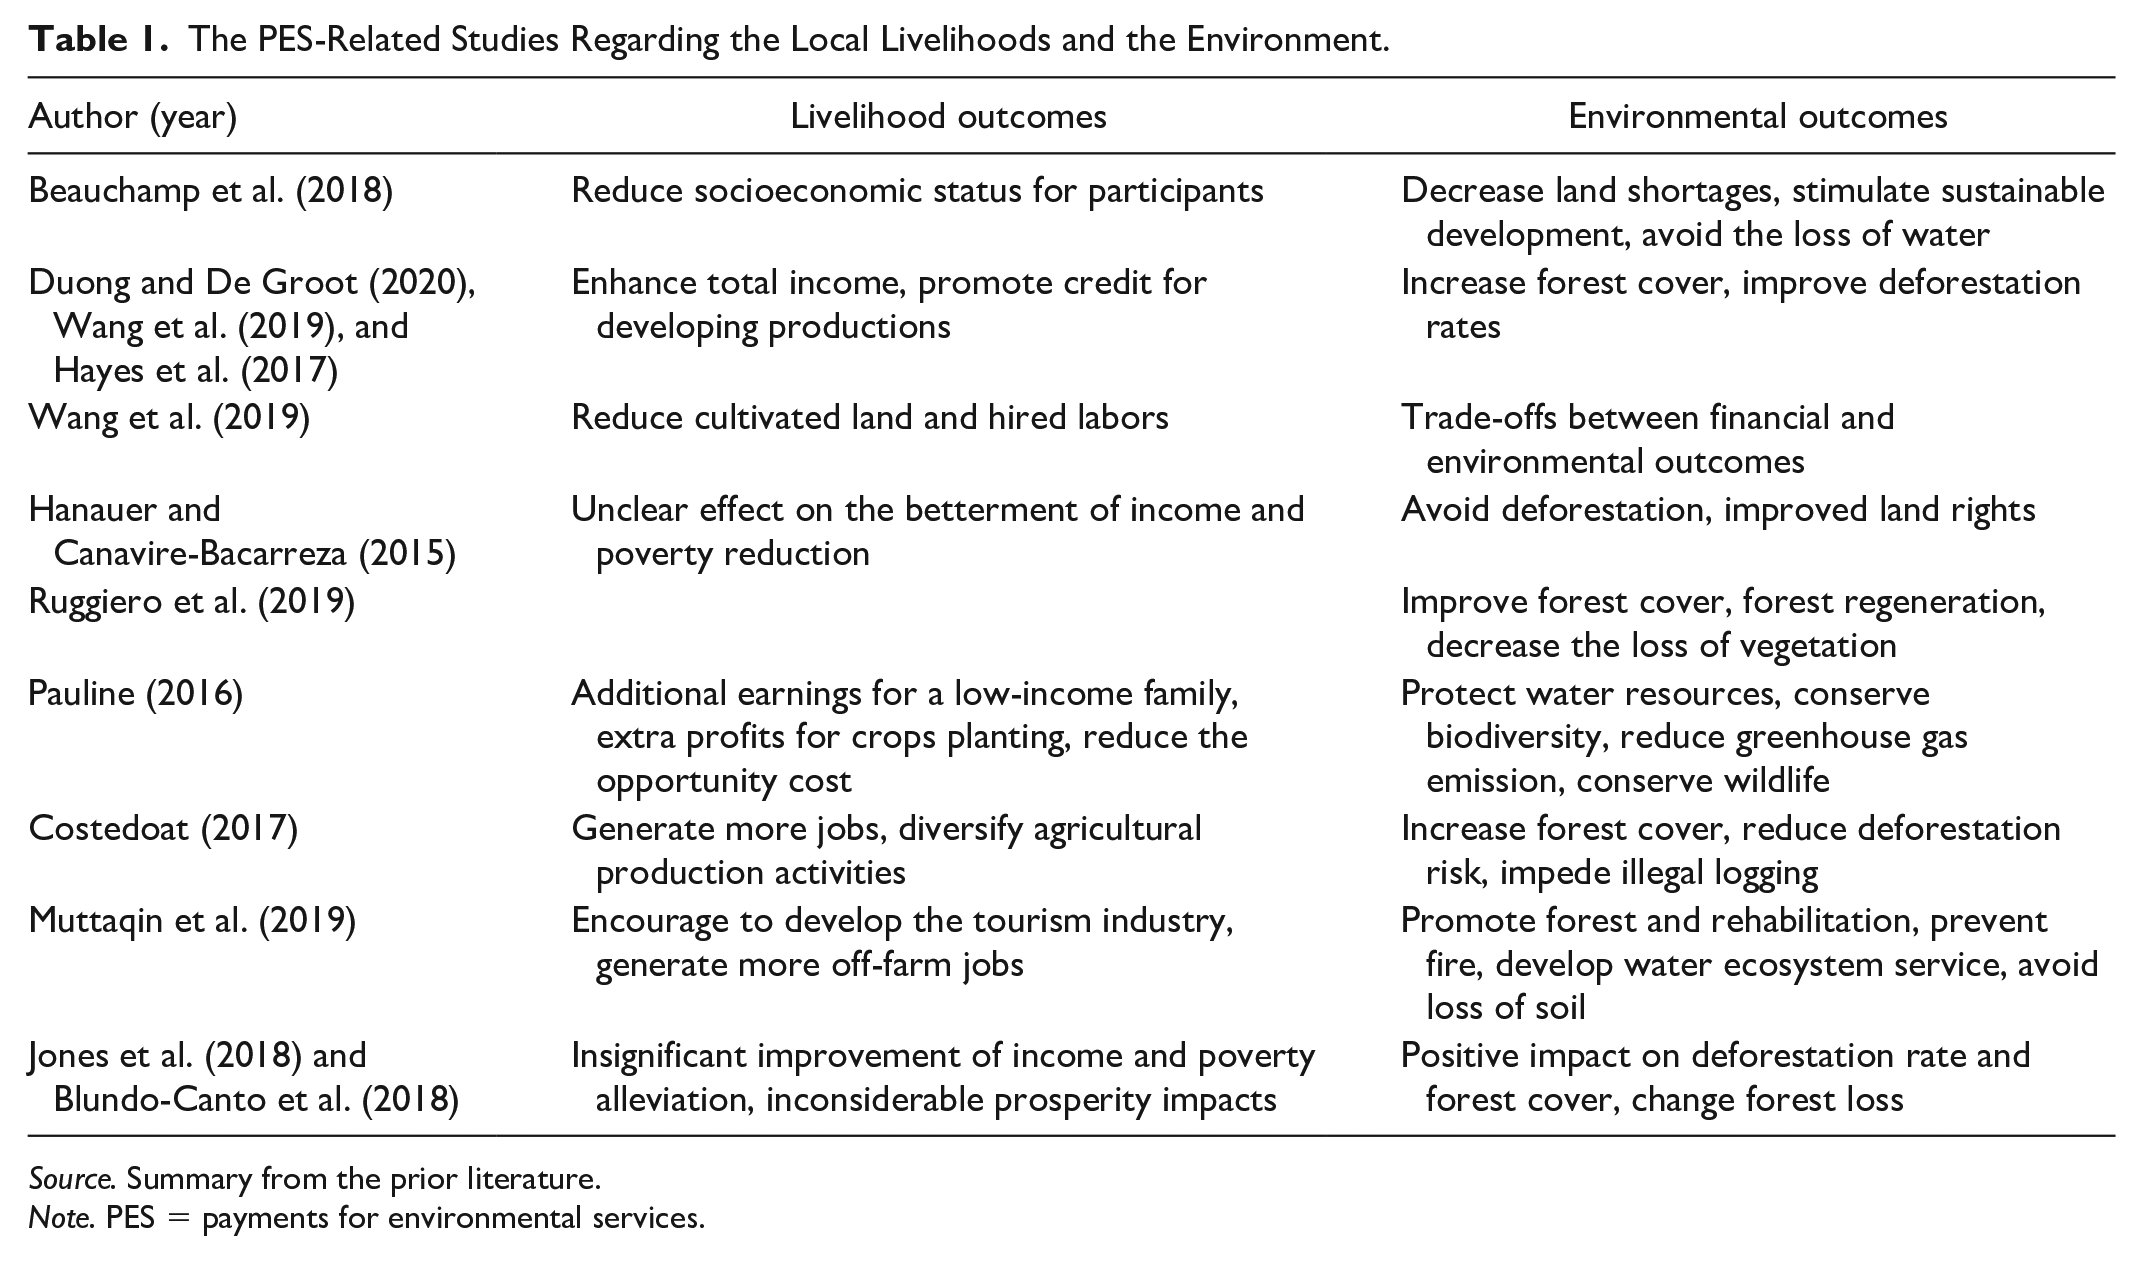
Source. Summary from the prior literature.
Note. PES = payments for environmental services.
Method
The Research Region
The research site is located in five districts of Quang Nam province of Vietnam, including Dong Giang, Tay Giang, Nam Giang, Phuoc Son, and Nam Tra My, where they have the largest forest areas and the PES scheme has been carried out since 2012. According to the Department of Agriculture and Rural Development (2019), the total natural forest areas of Quang Nam are about 389,000 ha as of 2019, account for 50% of the entire land area. Many mountainous citizens currently exploit forest resources for living, for instance, wood, honey, berries, mushrooms, and other nonwood forest products. Yet, the ongoing erosion and degradation of land, which are attributable to local citizens’ unsustainable production activities, has led to a decrease in agricultural productivity and greater risk of food security. Hence, conservation policies like PES can force mountainous people to conserve forest and cropland (Jones et al., 2018), exploit forest resources sustainably (Hayes et al., 2017; Moros et al., 2019), as well as protect other natural resources (Arriagada et al., 2015; Jones et al., 2018; see Figure 1).

The map of the research site.
Presently, total PES areas of Quang Nam are more than 276,000 ha and located along 31 river basins with total payments in 2019 of approximately US$4.7 million, equivalent to a growth rate of roughly 16.9% when compared with the previous year (Department of Agriculture and Rural Development, 2019).
Sampling
This article used the two-stage sampling method (Valliant, 1987), including the cluster and stratifying technique to select the interviewed households. The procedure is described as follows.
Initially, we got information about some communes locating in every district, and then selected 62 communes in the proximity of protected areas based on the cluster sampling. Next, we created the 100-point measurement scale (MC) to choose the objective communes. The MC consists of five requirements, including (a) the high rate of poor households is equivalent to 30 points, (b) the low rate of forest coverage is equivalent to 25 points, (c) the high density of minority ethnic is equivalent to 13 points, (d) the high possibility of vulnerability is equivalent to 12 points, and (e) the distance from home to the forest greater than 5 km is equivalent to 20 points. A total of 14 communes with the high average scores were selected among 62 communes after computing the average scores for each commune, representing approximately 22.58% of communes from the five target districts. The next step was to select hamlets from 14 above-mentioned communes by the stratifying technique, based on some criteria as follows: (a) a large fraction of forest coverage, (b) the selected hamlets are not near to each other, (c) the poverty rate is greater than 40%, and (d) about 90% of total income comes from agricultural activities. Finally, a total of 17 hamlets were collected among the 14 communes (Table 2).
The Sample Size and Collected Hamlets.

Note. PES = payments for environmental services.
Regarding determining the sample size, this research used the formula
Questionnaire Design
Prior to the official survey, the questionnaire for the survey was designed carefully. Initially, the drafted questionnaire was pre-tested by interviewing 10 PES-participants and six nonparticipants from five districts, as mentioned above, to check whether expressions in the questionnaire were understandable and vital questions were missing. Next, based on the interview results, the research team revised the questionnaire to correct vague expressions and add missing items. In the end, the questionnaire was post-tested with the same number of respondents as in the pre-test stage. The official questionnaire contained five parts. The first two parts surveyed sociodemographic characteristics of households and participated forest management programs. In contrast, the third part collected information in terms of agricultural activities before and after implementing the PES scheme. The fourth part collected the information regarding household attitudes toward the economic and environmental impact of PES, and the last part was respondents’ recommendations (see Appendix A and Appendix B in the Supplementary Material).
Data Collection
The respondents selected for the survey derived from Dong Giang, Tay Giang, Nam Giang, Phuoc Son, and Nam Tra My because these are five districts with the largest PES areas in Quang Nam province nowadays (Department of Agriculture and Rural Development, 2019). To avoid bad answers, the research team pre-contacted respondents by the telephone with the local civil servants’ consultation. They were consulted about the study purpose and operation and were asked whether they were willing to join our survey. If they agreed to join the study, the research team would directly interview the participants with an average duration of around 60 to 120 min for each questionnaire. A total of 282 respondents, 197 for PES-participants and 85 for nonparticipants, were surveyed from May 2018 to April 2019. Furthermore, to minimize response bias, interviewees must satisfy two requirements: (a) the age of 20 to 65 and (b) at least 5-year experience in agricultural activities. Table 3 represents the respondents’ profile.
The Respondents’ Profile.
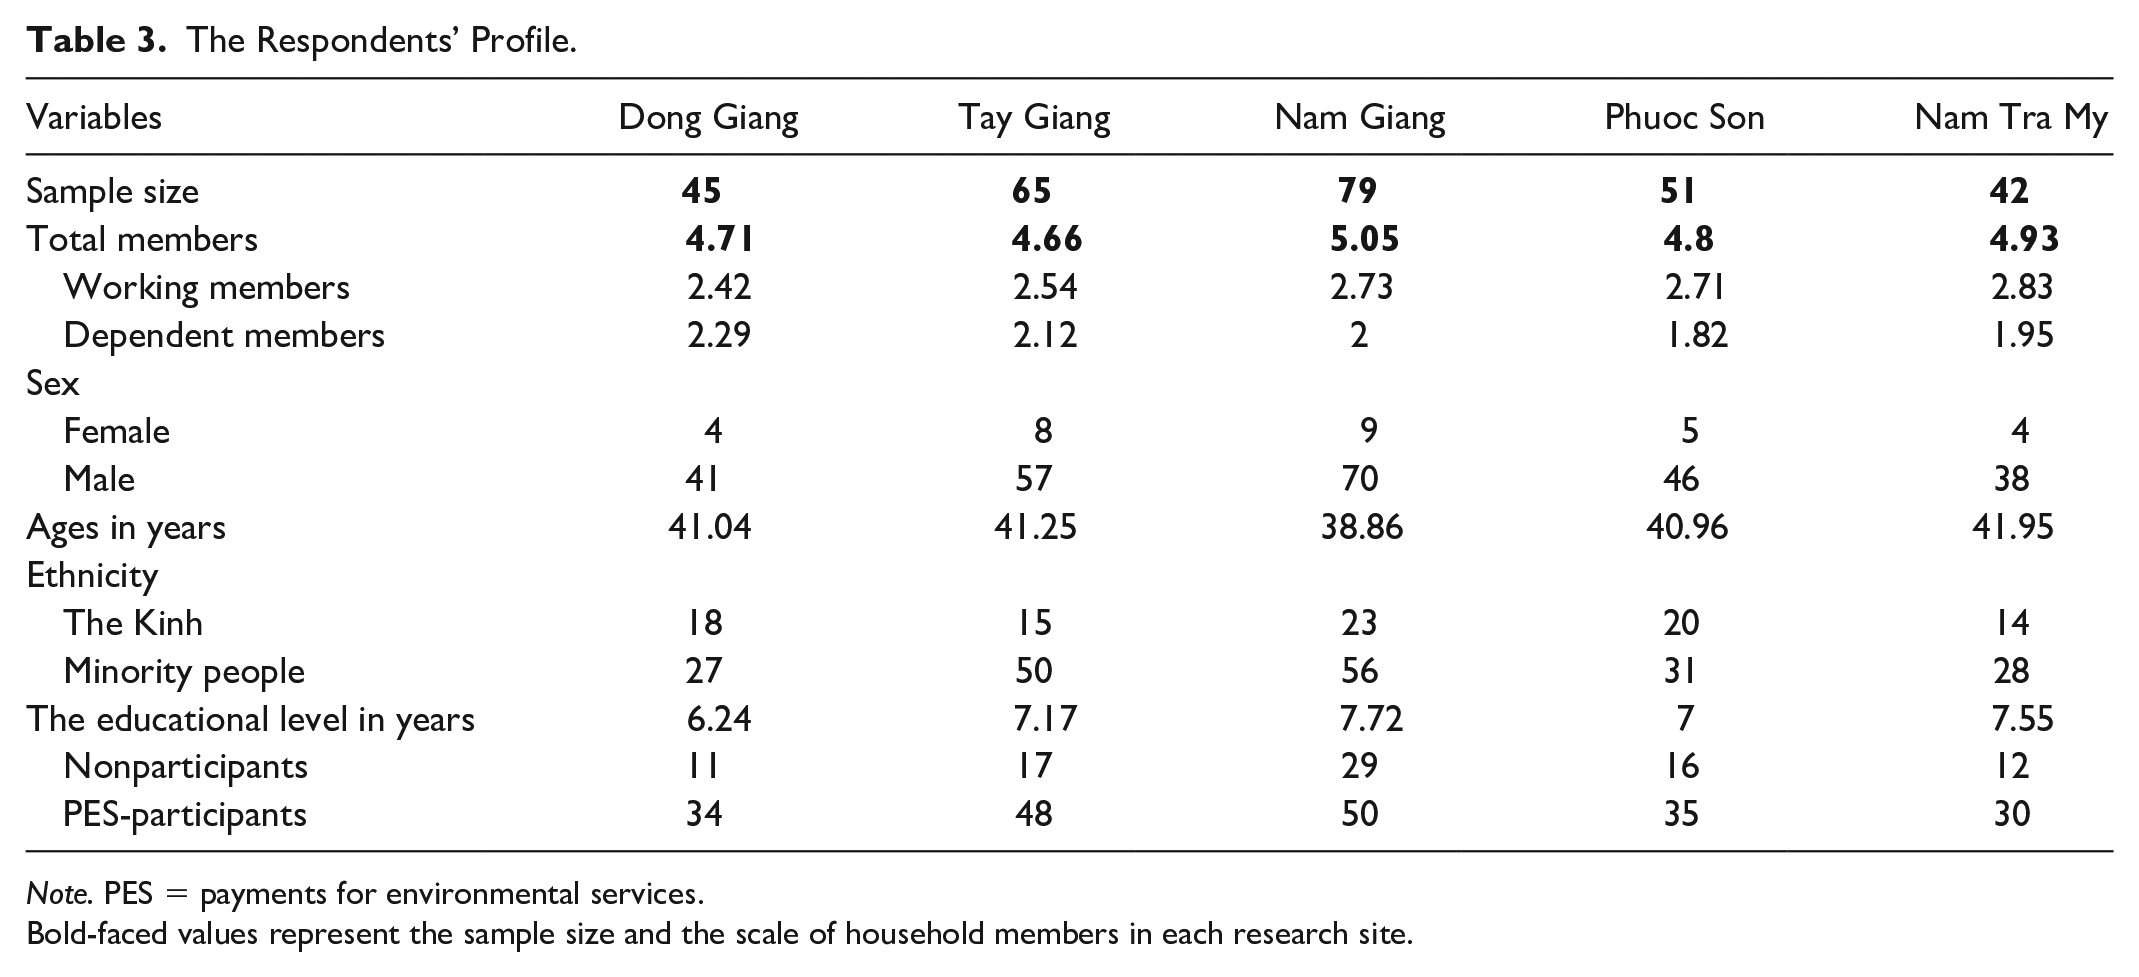
Note. PES = payments for environmental services.
Bold-faced values represent the sample size and the scale of household members in each research site.
Propensity Score Matching (PSM)
To date, PSM has argued to be a promising tool to assess the effect of government policy (Blundo-Canto et al., 2018; Izquierdo-Tort et al., 2019; Moros et al., 2019) whenever the implementation of the policy results in pools of treated and untreated individuals from which the two matched groups can be drawn (Ito et al., 2019). Besides, it should be noted that PSM methods are not restricted to situations where researchers want to compare impacts between participants and nonparticipants (D’Alberto et al., 2018). That is, PSM can also be deployed to evaluate the difference between groups who experience different levels or types of participation (Locke et al., 2017). Because participants in the PES projects are not stochastic, the study used an econometric technique specifying the PSM technique to investigate the PES program’s effect. According to Rosenbaum and Rubin (1983), the propensity scores,
Nevertheless, it is impossible to observe the outcomes of a PES-participant
There are many algorithms used for matching treated and control groups on the propensity score (Blundo-Canto et al., 2018; Bottazzi et al., 2018; Liu & Kontoleon, 2018). In this article, we used five matching methods to compute ATT, namely, one-to-one, nearest neighbor (NN), radius, kernel, and local linear regression (LLR). For the one-to-one matching method, one record from the data source can be assigned to only one record from the reference source using a linear-sum-assignment algorithm to optimize the assignment of matched pairs. In the NN matching, a household within PES is matched with a household without PES, who has the nearest propensity scores. In radius matching, a maximum propensity score radius is established (also called as caliper). Each household within PES is then matched only with one outside PES whose propensity score lies in the caliper radius. With kernel matching, all PES households are matched with a weighted average of all non-PES households, with weights inversely proportional to the distance between the households’ propensity scores within and without PES. Similar to kernel matching, LLR uses the weights given by the facts of the observations concerning the observable characteristics.
Specifically, we deployed the four-phase procedure in estimating propensity scores to assure the robustness of the results.
Results and Discussion
The PES Impact on the Environment
PES’s environmental impact was assessed via three key indicators, namely, total forest areas, percentage of forest coverage, and vegetation cover. The information on total forest areas and forest coverage was fully collected from General Statistics Office of Vietnam (2019) and the Department of Agriculture and Rural Development (2019). Generally speaking, there is a continuous increase in total forest areas and forest coverage percentage during the period 2008–2019, with an annual growth rate of 3.7% and 2.9%, respectively (Figure 2). In detail, total forest areas considerably went up from 457,200 ha in 2008 to 552,100 ha in 2015, then expanded dramatically to 680,400 ha in 2016, and the number hardly changed until 2019. Likewise, the percentage of forest coverage substantially went up from 43.1% in 2008 to approximately 50% in 2013, subsequently dropped suddenly to 45% in 2014, then rose steeply till 2019. Currently, the Department of Agriculture and Rural Development (2019) predicts that total forest areas being eligible for PES schemes might reach almost 283,326 ha in 2020.

The four-phase procedure in estimating propensity scores.
The PES project has been implementing in Quang Nam province since 2012; thus, research time was separated into two periods. Specifically, the pre-PES period was represented by the years from 2008 to 2012, while the PES period was covered from 2013 to 2019. As can be seen in Figure 3, there were roughly 27% growth on total forest areas (t-statistics = −3.9, p = .003) and about 17% increase in forest coverage (t-statistics = −2.9, p = .017) at PES period compared with that of pre-PES period. This finding could provide compelling evidence about the positive impact of the PES scheme on environmental outcomes.

The change of total forest areas and forest coverage during the period 2008–2019.
In addition, to evaluate vegetation cover between pre-PES and PES, we used the Normalized Difference Vegetation Index (NDVI) as a measure of the photosynthetic level of forest trees. The calculation of NDVI relied on satellite images downloaded from the Moderate Resolution Imaging Spectroradiometer (https://search.earthdata.nasa.gov/search). According to Goward et al. (1991), NDVI is measured from the difference between the visible and near-infrared light reflected by vegetation layers in the earth’s surface. Healthy vegetation layers will absorb most the visible light and reflect a large proportion of the near-infrared light, while unhealthy vegetation reflects more visible light and less near-infrared light (Sexton et al., 2013). NDVI values range from −1 to +1, yet negative values do not have the ecological meanings (Goward et al., 1991). Inversely, if NDVI values close to +1, indicating that there is a high possibility of dense green vegetation (Goward et al., 1991; Sexton et al., 2013). In this research, monthly NDVI was analyzed for 2009 and 2010 as the proxy of the pre-PES period and 2017 and 2018 for the PES period. Similar to the above results, average NDVI for the PES period was significantly higher than that of pre-PES period (0.69 and 0.62, respectively, t-statistics = −2.5860, p = .01294; Figure 4). Clearly, the existing PES program has been increasingly improving the forest cover. This finding is pretty consistent with that of Hayes et al. (2017), who argued that the Ecuadorian PES program generated many additional environmental benefits thanks to influencing households’ land-use behavior. Furthermore, Austin et al. (2019) also pointed out that direct governmental intervention could be regarded as forest-conservation policy priorities for environmental protection, in general, and forest preservation, in particular, in developing countries.

The t-test result of total forest areas and forest coverage between pre-PES and PES.
To reconfirm the statistical analysis, we organized two in-depth interviews with local authorities, one with the Tay Giang Forest Management Board and the other with Dong Giang Range Station. The responses pointed to the 36% reduction in illegal logging, from 195 incidents in 2008 to 125 incidents in 2018, while no evidence illustrated the decline in forest fires after implementing the PES scheme. Furthermore, the knowledge of environmental protection has been improving substantially across the community, both PES-participants and nonparticipants. About 75% of respondents confirmed that PES is necessary as the tool for freshwater provision, land loss prevention, and abandoned farmland restoration. Nearly 45% of nonparticipants were expecting to participate in PES next year if they had a chance.
The PES Impact on the Livelihoods
Logit model
To compute the PSs of the PES intervention, we used the logit regression to estimate the selection model with the dependent variable as the indicator variable, which equals 1 for PES-participants and 0 for nonparticipants. The explanatory variables consisted of the following: (a) the main crop, (b) total members, (c) working members, (d) the dummy for years living in the research area, (e) the dummy for ethnicity, (f) ages of respondents, (g) average distance to forest, (h) pre-PES income, (i) agricultural areas, and (j) educational level of household heads. The estimated results showed that the joint null hypothesis was rejected at a 1% significance level, meaning that regression coefficients did not simultaneously equal to zero (Table 4). Also, Table 4 demonstrated that eight out of 10 factors significantly affected PES participation, in which four factors were positively affected and four factors were negatively affected. Unlike the findings from Bottazzi et al. (2018), who illustrated that payment level and pro-nature instrumental values encouraged farmers to join the forest reservation schemes, our finding showed that some positive factors, including the number of years living in local, ethnicity group, the agricultural area, and educational level, motivated households’ PES participation.
The Logit Regression Results.

Note. PES = payments for environmental services; AIC = Akaike information criterion; BIC = Bayesian information criterion.
p < .1. **p < .05. ***p < .01.
The results of treatment effects by PSM
Table 5 represented the ATT’s estimated results by the PSM technique with respect to the gap in the outcomes in 2019. The estimates of the ATT also met the requirement of the overlap assumption as a priority. Figure 5 displayed the kernel density of the estimated PS for PES-participants and nonparticipants. The plot implied that not too much probability range is toward 0 or 1, and the two densities of each parcel had most ranges in areas that they overlapped each other; hence, no sign revealed the violation of overlap (Moros et al., 2019). We also performed the over-identification test for covariate balance, and the test results presented no evidence to reject the null hypothesis (p > .1), arguing that covariates were balanced (Figure 6).
Estimation Results of ATT With PSM.

Note. ATT = average treatment effect for the treated; PSM = propensity score matching; NN = nearest neighbor; LLR = local linear regression; DID = difference in differences.
p < .01.

The t-test result NDVI between pre-PES and PES.

The estimated propensity scores regarding relevant outcomes.
The impact of PES on the local livelihoods was assessed via three indices: (a) total income of households, (b) income from agriculture, and (c) hired income. Table 5 demonstrated that total annual income was negative under the radius method and statistically significant at a 1% level, indicating that PES-participants have lower overall income than nonparticipants, while the results were nonsignificant under four remaining methods (absolute of t-statistics <1.96). Similarly, the estimates of agricultural income and hired income were highly significant and negative under the radius method, yet nonsignificant under the remaining techniques.
To sum up, the radius estimation illustrated the difference in total income, agricultural income, and hired income between the households within and without PES. And the effect sizes were negative, implying that the incomes of PES-participants were significantly lower than nonparticipants. This result was in line with the finding of Beauchamp et al. (2018), who explored the 65% reduction of the economic status of protected area interventions during 2011–2014, compared with that of during 2008–2011. Moreover, the research by Arriagada et al. (2015) explained that the costs of participating and complying with the contract of the PES schemes might be quite significant, and landowners may be under-estimated these costs before their participation.
Policy Implications
From the study results, some recommendations for designing and carrying out the next PES project were as follows.
First, the improvement of local income, especially for PES-participants, should be the goal of the design of the PES schemes (Augustynczik et al., 2019; Austin et al., 2019; Baral et al., 2018; Chen et al., 2014), because the success and sustainability of any interventions will obtain only if participants’ perception is satisfied. This study showed that the current payment was around US$17 per hectare; on one hand, a meager amount of payments will not satisfy daily expenditure and production. On the other hand, modest payments will not certainly motivate PES-participants to protect allocated forests. This finding is pretty remarkable and consistent with that of Wang et al. (2019), who argued that payments from the PES scheme were not sufficient for households to cover income lost from cultivation, logging, and especially the increase in market prices. Thus, instead of directly paying PES-participants, the local authority should establish a village-level fund by PES’s payments to encourage creditors to use their loan effectively. Terms, procedures, and conditions have to be determined by the local community of citizens with the government’s support.
Second, encouraging participants to join forest protection activities to receive additional money should be considered a marginal solution of PES projects because many young people in the study site can work, but the shortage of land to plant crops. Furthermore, it is incredibly necessary to give farmers more agricultural extension services (i.e., knowledge of cultivation techniques and skills to improve crop productivity, post-harvest product protection) to raise farm productivity and sustainable development. Moreover, to maximize the efficiency of land use, the government should follow some managerial implications, including (a) merging dispersed plots of land, (b) motivating households to voluntarily withdraw their cropland and residential land, and (c) diversifying jobs in small towns.
Finally, we recognized that several participants still violated the contract articles in protecting forests for many different reasons. Hence, it also needs to penalize the violation for ensuring compliance.
Conclusion
At present, the PES scheme is considered a promising tool for improving both nature conservation and local livelihoods; thus, the studies regarding have been attracting much attention from scholars and policy makers. In Vietnam, the PES schemes have been implementing since 2008 under Decision No. 380. Yet, evaluating the effect of the schemes on the environment and livelihoods has not been carried out comprehensively. Most studies assessed the impact of PES projects on either the environment or the livelihood; so, this research aimed to determine the effects of the PES projects in Vietnam on both environment and livelihoods. To do so, we surveyed 282 households in mountainous five districts of Quang Nam province, Vietnam, and used the PSM technique to assess the PES implementation’s effect via ATT. Below are a few main conclusions.
The results illustrated the PES program’s positive impacts on the environment outcomes concerning total forest areas, percentage of forest coverage, and vegetation cover. In detail, both the total forest area and forest coverage percentage have been increasing continuously up to present, and especially the average growth rate is faster during the PES period than the Pre-PES period. The t test with .05 significance also claimed this argument. In addition, the calculation of NDVI based on National Aeronautics and Space Administration (NASA’s) satellite images demonstrated the excellent improvement of vegetation coverage in the study area. In conclusion, there is concrete evidence to confirm that the PES scheme in Vietnam is substantially affecting the ecological environment, meaning that the PES program obtained the environmental objectives as envisaged. Our finding is in agreement with the previous conclusions from Sharma et al. (2019), Feng et al. (2018), and Costedoat (2017).
While the PES intervention resulted in the considerable improvement of nature conservation and ecological environmental protection, the analysis of propensity scores showed that the households within PES have a significantly lower income than ones without PES regarding total annual income, agricultural income, and hired labor income. Specifically, the difference of total yearly income, farm income, and hired labor income between PES-participants and nonparticipants is –US$869.78, –US$1,121.83, and –US$178.56, respectively. Significant cost of participation and compliance were regarded as the main reasons that caused this issue (Arriagada et al., 2015). The other reason was explained by Clements and Milner-Gulland (2015) that the management of PES projects limited livelihood opportunities for indigenous residents by limiting some kinds of crops (principally shifting cultivation and cash crops) and farmland abandonment. On the contrary, the PES program provided essential forest resources, for example, honey, bamboo, wood, and other nonwood products, for individuals, who were not complied by PES agreements (McElwee et al., 2020).
Limitations
First, many national programs—namely, Program 661, Program 30A, and Rural Development and Sustainable Poverty Reduction Support Program (RDSPRSP)—are recently supporting subsidies for the poor households in the study site. Thus, the impact of interventions on livelihoods and the environment is determined by the mutual combination of these above programs rather than only the PES regime. Consequently, we find it difficult to assess the PES project’s separate effect for each average outcome. Therefore, we highly recommend that the future study separate the PES scheme’s actual impact to precisely evaluate the PES project’s impact on financial and environmental outcomes.
Next, using the different estimation methods to calculate the propensity scores resulted in the different results, which led to the confusion of explanation with the facts. Specifically, as seen in Table 5, while the radius estimation displayed the significant difference of the potential outcomes between PES-participants and nonparticipants, the remaining methods exhibited the nonsignificant results. For this reason, a novel method should be developed to increase the accuracy of estimations of the potential outcomes. Guo and Fraser (2015) and Tuijnman et al. (2020) also suggested a similar solution.
Finally, keep in mind that the collected data in this article highly represented for the research region. Thus, the estimation results would be difficult to generalize for all provinces of Vietnam because of substantial differences in terms of residents’ sociodemographic features, the terms of the PES contract, and the period of PES stages. Therefore, new methods should be developed to provide consistent results, so that impact of the PES interventions can be estimated most accurately.
Supplemental Material
sj-pdf-1-sgo-10.1177_21582440211040774 – Supplemental material for Estimate the Impact of Payments for Environmental Services on Local Livelihoods and Environment: An Application of Propensity Scores
Supplemental material, sj-pdf-1-sgo-10.1177_21582440211040774 for Estimate the Impact of Payments for Environmental Services on Local Livelihoods and Environment: An Application of Propensity Scores by Thang Quyet Nguyen, Nguyen Tan Huynh and Wen-Kai K. Hsu in SAGE Open
Footnotes
Declaration of Conflicting Interests
The author(s) declared no potential conflicts of interest with respect to the research, authorship, and/or publication of this article.
Funding
The author(s) disclosed receipt of the following financial support for the research, authorship, and/or publication of this article: This research is partially funded by Ho Chi Minh City University of Technology (HUTECH) and Dong Nai Technology University.
Supplemental Material
Supplemental material for this article is available online.
References
Supplementary Material
Please find the following supplemental material available below.
For Open Access articles published under a Creative Commons License, all supplemental material carries the same license as the article it is associated with.
For non-Open Access articles published, all supplemental material carries a non-exclusive license, and permission requests for re-use of supplemental material or any part of supplemental material shall be sent directly to the copyright owner as specified in the copyright notice associated with the article.