
Abstract
With the growing population increase and following young population’s desire to study at the university, political authorities are supporting university and higher education investments, especially in the last 10 years. This situation has increased the number of universities considerably. Because a university will provide socioeconomic dynamism to both the development of the country and the region, choosing the right university location has become a significant problem nowadays. In line with this, this study is focused on supporting the new university location decision in a wide region in Turkey where currently the number of universities in the region is relatively low despite the high population density in the area. Alternative cities to be utilized in the study are determined particularly taking the demographic structure into consideration and various multicriteria decision-making (MCDM) techniques are applied. Technique for Order Preference by Similarity to Ideal Solution (TOPSIS), Weighted Aggregated Sum Product Assessment (WASPAS), and Multi-Objective Optimization on the Basis of Ratio Analysis (MOORA) are applied to a real case study. Related criteria and alternative locations are specified by consulting seven experts. Within the study, both the results of these methods are presented, and also sensitivity analyses are conducted to observe how sensitive the results are to the changes in the criteria weights. The results obtained are purposed to aid decision makers in this field.
Introduction
Universities are considered fundamental institutions that have major roles in the social, cultural, economic, scientific, and technological progress of a country. A university can basically be defined as a “higher education institution based on scientific information production and constitutes of faculty or another unit which operates in various disciplines” (Bozkurt et al., 1998). While determining the right location for establishing a university, emphasis must be put on the notion of “facility location” because a university is a facility. Facility location has a significant place in planning and has a direct impact on factors which effect planning (Turner, 1987). Thus, particularly since the 1950s and 1960s, planning action has become an important factor in the university concept (Muthesius, 2001). Accordingly, university campus plans are directly linked with modern urban planning and cannot be considered independent from urban plans (Christiaanse, 2006). While taking into consideration the points related to campus/university location selection, and reflecting on these selection issues, it is necessary to admit that the background reasons and results of location selections are not only physical.
Location place decisions can arise from many reasons. The important point is that decision makers should not only choose a location which will perform well but also take into consideration the flexibility to comply sufficiently with the changes in the future. Hence, choosing the facility location place inappropriately will bring along various negativities, particularly increases in costs. Due to these reasons, we can conclude that the selection of the most appropriate location for a facility is of critical importance. More precisely, the sociocultural structure of the city that a university is established in has influence on location selection decisions; therefore, assessing campus/university planning in a broader perspective is vital (Ding & Zeng, 2015). Ensuring the required instructor, management group, and students to a university depends on to the development of the city in many perspectives such as social, cultural, transportation, and economical. In this context, a city where its municipal functions are advanced can serve better to the university and educate the students by catching more qualified instructor and students’ attention. Because the relationships between university and its location place (city) are bilateral, this point makes the social, economic, and cultural infrastructure of the city crucial. In addition to these, by setting up a university in a city, there will be a considerable number of contributions to that city. These contributions can be summarized as follows: Universities create employment within their environments and thus become an economical resource; affect surrounding regions as sociocultural and economically; accelerate the sustainable economic growth; make a major contribution to the human capital inventory; and increase the research and development (R&D) application infrastructure and opportunities.
These points are the motive that makes this study a valuable contribution in determining the most appropriate location for a new university. When literature is analyzed, it is observed that the most discussed topics on university planning in our country are the distribution of the universities domestically and the inner-city location selection (Arap, 2010; Arslan & Yildiz, 2015; Kuyrukcu & Alkan, 2020; Maltas Erol & Ozer, 2018). In general, the city in which university will be established is determined without any standard and almost every county endeavors to attract the new universities to be established to their region with economic, social, and cultural pickup expectations. As well, from the point of country progress, administrators frequently encounter the location selection decision-making problems, which is extremely important.
Decision-making is defined as choosing an activity or a set of activities between possible options, and in the decision-making environment, many problems can be solved simultaneously being transformed into numerical expressions (Athawale et al., 2012). Besides, in the decision-making process, individual preferences can be stated by means of lingual expressions which reflect indefinite values. For this reason, it is generally hard for certainty including mathematical models to deal with such decision-making situations. When considered from this point of view, it is observed that multicriteria decision-making (MCDM) methods are effective in the location selection problems as addressed in this study (Wu et al., 2019). The reasons behind this are that there are many subjective criteria in the evaluation of location place suitability and the weights of these criteria can usually be expressed with lingual terms (Balcik & Beamon, 2008; Keshavarz Ghorabaee et al., 2017b). Suitable location selection can involve various alternatives, several goals (cost minimization, travel distance minimization, service maximization, etc.), and conflicting criteria. In this study, focusing on these points, the present problem is adopted as an MCDM problem and solved utilizing multiple techniques. Although MCDM methods are used for facility location problems in literature, there is still an opportunity to improve the problem addressed in this study. Accordingly, Technique for Order Preference by Similarity to Ideal Solution (TOPSIS), Weighted Aggregated Sum Product Assessment (WASPAS), and Multi-Objective Optimization on the Basis of Ratio Analysis (MOORA) are utilized, and the obtained results are presented by a real case study. Through conducting sensitivity analysis, we aimed to see how sensitive are the results of our approach to the changes in the criteria weights.
In literature, various other MCDM methods such as Evaluation Based on Distance from Average Solution (EDAS; Keshavarz Ghorabaee et al., 2015, 2016, 2017a, 2018), Combinative Distance-based Assessment (CODAS; Simic et al., 2021), Additive Ratio Assessment (ARAS; Karagoz et al., 2021), and measurement of alternatives and ranking according to compromise solution (MARCOS; Pamucar, Iordache, et al., 2020) exist. However, there are multiple advantages of adopted MCDM methods within this study. TOPSIS method is simple, intuitive, and has a comprehensible concept. The logic in this method represents the rationale of human choice, and its computation is easy with good computational efficiency. It reveals a scalar value that accounts for both the best and worst alternatives’ ability, and the method can measure the relative performance for each alternative in a simple mathematical form (Hung & Chen, 2009). WASPAS method is mathematically simple but also it has capability to gain correct results compared with weighted sum model (WSM) and weighted product model (WPM). The method is a combination of these two techniques and enables reaching the highest accuracy of estimation. These characteristics make the technique an effective decision-making tool. Once the decision criteria are determined, experts are consulted to evaluate the alternatives based on the decision criteria (Gokasar et al., 2021, in press; Mishra et al., 2019; Rani et al., 2020). Compared with other MCDM methods, MOORA method has a very less computational time, high simplicity with minimum mathematical calculations, and a good stability. Method takes into consideration various objectives with their own units. Combining the results from different approaches such as MOORA-Reference Point or MOORA-Significance Coefficient, the method forms a guaranty for a solution as nonsubjective as possible (Brauers & Zavadskas, 2012).
Consequently, the remainder of this article is organized as follows. In section “Literature Review,” a literature review of the topic is presented, including adopted methods as well as location selection problems with MCDM methods. Section “Materials and Methods” contains the material utilized in the study and detailed information about the employed MCDM methods. The case study and its results are given in section “Case Study and Results” along with tables indicating supporting results and sensitivity analyses. Final remarks, discussions, and some suggestions for future studies are also specified in section “Results and Discussion.”
Literature Review
Decision problems differ in the methods used and the solutions needed. In cases which have many conflicting criteria/positions, applying an MCDM process to arrive at a solution is appropriate. MCDM is a procedure of specifying the best solution according to the criteria generated. A traditional MCDM problem usually contains alternatives, criteria, and criteria weights. In this study, three MCDM methods were utilized and are summarized below respectively.
The first method, TOPSIS, does not include complex algorithms and mathematical models. In literature, due to reasons such as ease of use, interpreting results readily, and ease of understanding, it is applied extensively. Fields in which this technique is performed include supplier selection (Boran et al., 2009; Kumar et al., 2018; Shahroudi & Tonekaboni, 2012), education (Arslan & Yildiz, 2015; Ding & Zeng, 2015; Kuyrukcu & Alkan, 2020), personnel selection (Akin, 2016; Kelemenis & Askounis, 2010; Matin et al., 2011), corridor selection (Dogan et al., 2020), finance (Amile et al., 2013; Ozen et al., 2015), location selection (Demirel et al., 2016), reliability, availability, and maintainability (RAM) parameter analysis (Panchal et al., 2019), bridge maintenance prioritization (Gokasar et al., 2021), and business and marketing management (Aydogan, 2011; Shyur, 2006; Ye, 2010).
The WASPAS method has been applied in many decision-making problems and environments. Some areas in which this technique is performed include supplier selection (Jayant et al., 2019; Mishra et al., 2019; Singh & Modgil, 2020; Urosevic et al., 2017), airport ground access mode selection (Pamucar, Deveci, et al., 2020), ranking accuracy (Baykasoglu & Golcuk, 2019), personnel selection (Karabašević et al., 2016), fuel technology selection (Rani & Mishra, 2020), physician selection (Rani et al., 2020), resource allocation (Shaaban et al., 2019), production quality (Prajapati et al., 2019), strategy selection (Emovon et al., 2018), qualitative risk analysis (Badalpur & Nurbakhsh, 2019), measurements (El-Santawy & Mohamed, 2019), software selection (Tus & Adalı, 2019), and indoor environment (Zavadskas et al., 2016).
The MOORA and its extension MULTIMOORA method is popularly utilized in practice due to its simple application procedure, pertinence to various conditions, and advances through empirical observation. Examples of fields in which this method can be applied include process parameter selection (Majumder et al., 2019), occupational health and safety risk analysis (Dabbagh & Yousefi, 2019), performance measurements and selection (Hanifatulqolbi et al., 2019; Kuvat & Demir, 2020; Yilmaz, 2019), alternative selection (Brauers & Zavadskas, 2006; Karuppanna & Sekar, 2016; Pathapalli et al., 2020; Pérez-Domínguez et al., 2018; Sahida et al., 2019), material selection (Nori et al., 2018; Patnaik et al., 2020), and supplier selection (Jayant et al., 2019).
Furthermore, to gain a better understanding of the subject, related literature based on MCDM-oriented location selection studies was also reviewed. Table 1 below summarizes location selection papers utilizing various MCDM methods highlighting case study area, number of main and subcriteria, uncertainty, and applied techniques.
Summary of MCDM-Based Location Selection Studies.
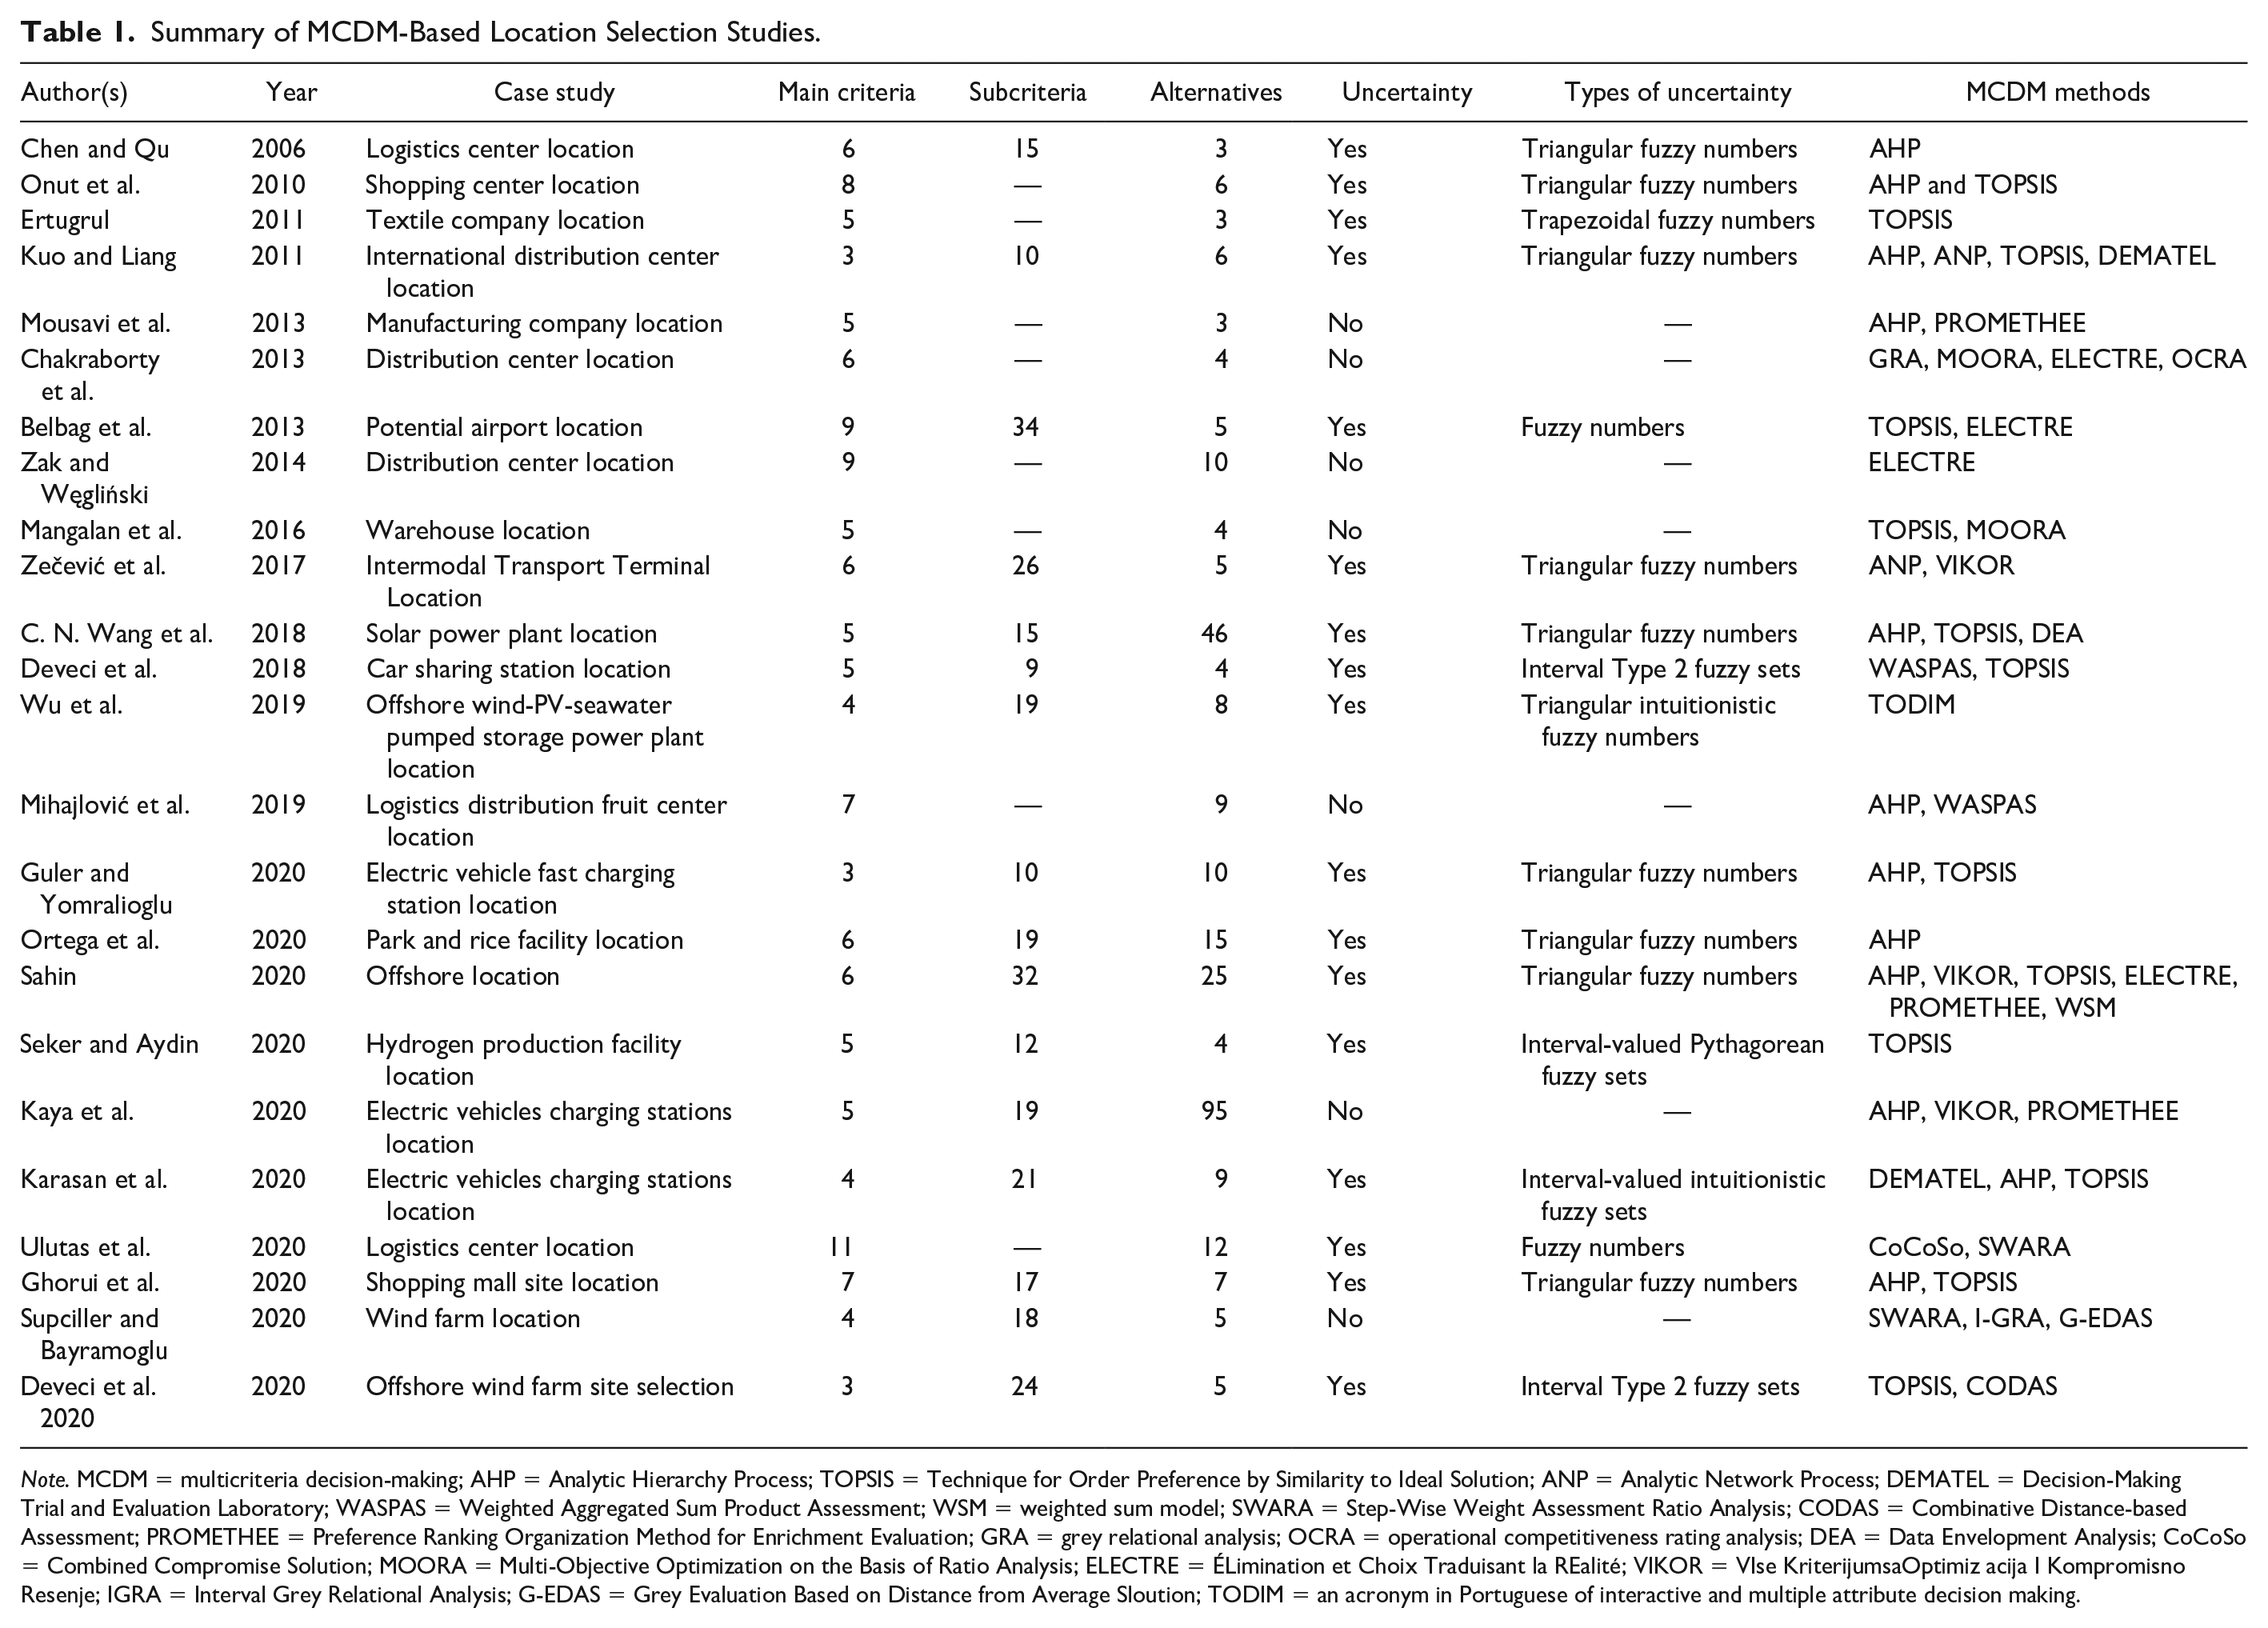
Note. MCDM = multicriteria decision-making; AHP = Analytic Hierarchy Process; TOPSIS = Technique for Order Preference by Similarity to Ideal Solution; ANP = Analytic Network Process; DEMATEL = Decision-Making Trial and Evaluation Laboratory; WASPAS = Weighted Aggregated Sum Product Assessment; WSM = weighted sum model; SWARA = Step-Wise Weight Assessment Ratio Analysis; CODAS = Combinative Distance-based Assessment; PROMETHEE = Preference Ranking Organization Method for Enrichment Evaluation; GRA = grey relational analysis; OCRA = operational competitiveness rating analysis; DEA = Data Envelopment Analysis; CoCoSo = Combined Compromise Solution; MOORA = Multi-Objective Optimization on the Basis of Ratio Analysis; ELECTRE = ÉLimination et Choix Traduisant la REalité; VIKOR = VIse KriterijumsaOptimiz acija I Kompromisno Resenje; IGRA = Interval Grey Relational Analysis; G-EDAS = Grey Evaluation Based on Distance from Average Sloution; TODIM = an acronym in Portuguese of interactive and multiple attribute decision making.
Through the literature review, it was seen that only three papers handled education-related problems. Kuyrukcu and Alkan (2020) employed Analytic Hierarchy Process (AHP) and TOPSIS for the location selection of universities; Arslan and Yildiz (2015) adopted fuzzy TOPSIS for the selection of education facilities. Ding and Zeng (2015) evaluated the performance of 68 Chinese universities.
To this end, our contributions compared with existing literature can be summarized as follows:
Despite the work described above, insufficient attention has been paid to education facility location problems in the MCDM perspective in literature. Therefore, this article aims to bridge this gap and provide a resource for similar problems.
Three MCDM methods were applied in this study to increase the effectiveness of results.
Sensitivity analysis for three adopted method is conducted to observe the changes in the alternative rankings.
We consulted various experts in our study who are city planner, civil engineer, geological engineer, municipal official, transportation engineer, environmental engineer, and constable to obtain accurate data about criteria.
Materials and Methods
Material
Table 2 below presents some demographic factors in the two geographical regions of Turkey (Mediterranean and Central Anatolian) including the name of provinces, metropolitan municipalities, geographical regions, number of universities, total population, and number of students attending secondary school and high school. It is seen from Table 2 that there are six metropolitan municipalities in these two geographical regions which have a population of more than 1,500,000 people: Adana, Antalya, Hatay, Mersin, Ankara, and Konya. The reason of excluding Ankara (the capital of Turkey) in this study is that although the capital has a population of more than 5 million people, it has 23 universities (total of public university and foundation university). Hatay province is not included to the study as well because the city is not available to develop geographically, its infrastructure conditions are weak, and more than 400,000 people of the city’s 1.5 million population is consisted of Syrian refugees (Göç İdaresi Genel Müdürlüğü, n.d.). Another metropolitan municipality Mersin is not included to the study due to similar refugee reason with Hatay. The Syrian refugee population in Mersin is more than 200,000 people, and this number corresponds to approximately 12% of the province’s population (Göç İdaresi Genel Müdürlüğü, n.d.). In the light of this information, between the provinces given in Table 2, Adana, Antalya, Mersin, and Konya are included to the case study in this article to determine the best location for a new university.
Some Demographic Factors for Two Geographical Regions in Turkey.

The locations of these cities are shown in Figure 1 below. In Figure 1, the location of geographical regions in Turkey map is given in the upper right-hand corner of the Figure. In the main part, the provinces are demonstrated in these regions and the population of these provinces is indicated by the population density.

Location of candidate cities for university location selection problem.
In line with the related literature research (Suben (1980), Arap (2010), Aikebaier (2013), Arslan and Yildiz (2015), Maltas Erol and Ozer (2018), Kuyrukcu and Alkan (2020)) and expert opinions, five criteria were utilized to determine the most appropriate location for a new university. The detailed information about the experts is given in Table 3 below.
Detailed Information About the Experts in This Study.

All considered criteria are measured by all evaluators, who consist of experts detailed above with different viewpoints and the criteria are defined as follows:
Data related to criteria and alternatives are presented in Table 4.
Data Related to Alternative Cities (Turkish Statistical Institute, 2020).

In line with this information, TOPSIS, WASPAS, and MOORA methods were applied and the results were compared. Detailed stages of these methods are presented below, respectively.
Research Methodology
TOPSIS
As one of the most utilized MCDM methods, the TOPSIS technique was developed by Hwang and Yoon (1981). The technique depends on two essential points, positive ideal solution (PIS) and negative ideal solution (NIS); it evaluates alternatives in accordance with specific criteria and then compares them according to an ideal solution between maximum and minimum values of criteria (Yurdakul & Ic, 2003). In other words, the ideal solution is the alternative which is the closest distance to the PIS and at the same time at the outermost distance to the NIS (Cheng et al., 2002; Hwang & Yoon, 1981).
In this method, the best solution is expressed as the ideal or PIS and is one which minimizes cost criteria or maximizes benefit criteria. However, the nonideal or NIS minimizes benefit criteria or maximizes cost criteria. All decision alternatives can be ranked comparing distances (Y. M. Wang & Elhag, 2006).
The application procedure of the TOPSIS method is summed up in the following (Hwang & Yoon, 1981).
After determining decision alternatives and evaluation criteria, a decision matrix comprising of
Stage 1: Decision matrix is created. The decision matrix

Stage 2. Normalized decision matrix is formed. After generating a decision matrix, the normalized decision matrix is constituted utilizing Equations 2 and 3 below. If any member of the decision matrix is zero, the value of that member in the standard decision matrix is zero as well.


After normalization, the normalized decision matrix is given in Equation 4 in the following:

Stage 3. Weighted normalized decision matrix is constituted. This is realized by multiplying predetermined criteria weights

Stage 4. PIS

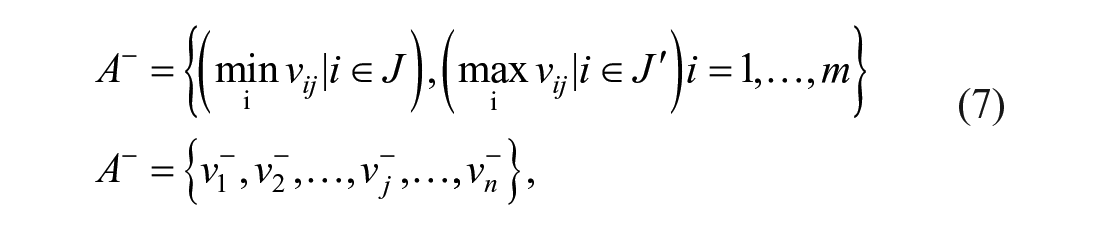
where:


Stage 5. Separation measures are calculated. In the TOPSIS method, for each alternative


Stage 6. Relative closeness to the ideal solution is calculated. Utilizing

Here,
WASPAS
The WASPAS method is based on the WSM and WPM (Zolfani et al., 2013). It was developed by Zavadskas in 2012 and presents the performance values of alternatives according to criteria utilizing criteria weights in the solution of MCDM problems. In consequence of the solution, alternatives are arranged from the best to the worst. Furthermore, the method attempts to reach a high level of consistency in the estimation by optimizing weighted integrated function (Lashgari et al., 2014; Zavadskas et al., 2012).
In this method, there is no particular technique for determining criteria weight. For this purpose, methods such as the Analytic Network Process (ANP), AHP, Decision-Making Trial and Evaluation Laboratory (DEMATEL), Entropy, Measuring Attractiveness by a Categorical Based Evaluation Technique (MACHBETH), and Step-Wise Weight Assessment Ratio Analysis (SWARA) can be utilized (Zolfani et al., 2013). In this study, a 1 to 9 scale to determine criteria weight was applied. In this scale, 9 represents the best, whereas 1 represents the worst. In the following, we briefly summarize the stages and procedure of the method.
In the WASPAS method, the problem to be solved is designed in an
Stage 1: Decision matrix is constituted. In this first stage, the decision matrix
Stage 2: Decision matrix is normalized. The decision matrix is normalized taking into consideration the benefit or cost directions of the criteria. Linear normalization is utilized for the normalization process. In cases where criteria are cost-oriented, Equation 11 is utilized, and in cases where criteria are benefit-oriented, Equation 12 is applied.


Stage 3: Relative performances of alternatives are calculated according to the WSM method. This is determined by adding the weighted alternative values of each criterion. This is formulized with Equation 13 below. In this Equation,

Stage 4: Relative performances of alternatives are calculated according to the WPM method. This is obtained by multiplying the alternative value of each criterion with the same indexed criteria weight’s power. This is formulized with Equation 14 below.

Stage 5: Final performance of alternatives is calculated. Final performance of alternatives

Equation 16 in the following can be utilized to increase the ranking efficiency and accuracy of the decision-making process. α is a parameter which can take values between 0 and 1.

When α = 1, the WASPAS method turns into the WSM method, and when α = 0, it turns into the WPM method. α value can be determined freely by the user.
Stage 6: Alternatives are ranked.
Multi-Objective Optimization on the Basis of Ratio Analysis (MOORA) and MULTIMOORA
Multi-Objective Optimization on the Basis of Ratio Analysis (MOORA) was developed by Brauers and Zavadskas in 2006 and is a commonly used, relatively new method for the solution of MCDM problems. It depends on the scoring of different foresights (Pérez-Domínguez et al., 2018). This method is used to make proper decisions in the solution process of various and complex problems. Results obtained through use of this method present measurable results for each decision alternative. Thus, the MOORA method is an effective tool to rank and select decision alternatives (Brauers & Zavadskas, 2006; Dey et al., 2012; Gadakh, 2011).
The MOORA method is a multiobjective optimization method and depends on proportional analysis. Different versions of MOORA, such as MOORA-Ratio, MOORA-Significance Coefficient, MOORA-Reference Point, MOORA-Full Multiplication, and MULTIMOORA have been developed.
However, there are some conditions required to obtain proper results in the application process of this method: All affected factors and all relationships between alternatives and criteria should be taken into account, the decision maker should be objective and use updated data, and the final evaluation should be made by applying different MOORA approaches (Mandal & Sarkar, 2012). The steps of this method are summed up in the following.
In MOORA, decision alternatives are formulized in the same way as stated previously in the TOPSIS and WASPAS methods (
Step 1. Initial decision matrix is generated. The decision matrix in this stage is the same as the aforementioned Equation 1. Likewise,
Step 2. Decision matrix is normalized. The normalization process in this stage is the same with the TOPSIS method. Thus, Equations 2 and 3 are utilized in this stage. Here, it is significant to mention that normalization is executed without taking into account the criteria’s direction (maximization/minimization).
Step 3. MOORA-Ratio approach. This approach is applied by calculating the performance of decision alternatives. This is obtained via following Equation 17.

Here,
Step 4. MOORA-Significance Coefficient approach. In this approach, normalized data which are obtained from the MOORA-Ratio approach are multiplied with a ratio called the significance coefficient

As stated previously, here,
Step 5. MOORA-Reference Point approach. In this approach, normalized data acquired from the MOORA-Ratio approach are taken into account. In case of maximization, the best value of decision alternatives for each alternative and in case of minimization, the worst value of decision alternatives for each alternative are determined as reference points

Then the highest value of each alternative is calculated by Equation 20 below; alternatives are ranked from highest to lowest, and the alternative in the first rank is determined to be the best alternative.

Step 6. MOORA-Full Multiplication approach. In this approach, to obtain the score of each alternative, maximization-oriented data which are specified at the beginning of the process are multiplied and divided to the multiplication of minimization-oriented data. This calculation is given with Equation 21 in the following.


In Equations 22 and 23, while
Step 7. MULTIMOORA. This approach was first suggested by Brauers and Zavadskas in 2010 and consists of the MOORA-Ratio, MOORA-Reference Point, and MOORA-Full Multiplication approaches (Brauers & Zavadskas, 2012). It is not an independent method. It depends on evaluating the rankings of the aforementioned MOORA methods according to the ordinal dominance theory and thus creates a final evaluation. The fundamental aim of this approach is to determine the preferred alternatives and support decision makers. In this study, the results of MULTI-Ratio, MULTI-Significance Coefficient, MULTI-Reference Point, and MULTI-Full Multiplication approaches are transformed into a final ranking by means of ordinal dominance theory.
There are four different situations to determine the score of decision alternatives according to related theory for MULTIMOORA. These are dominance, transitiveness, equability, and circular reasoning. Dominance is the effect of an alternative on other alternatives and can be revealed as absolute dominance or general dominance. Absolute dominance is the situation of an alternative or solution being dominant to other alternatives or solutions and stated as (1-1-1). For general dominance, in case of a > b > c > d, if the decision alternative is in the same rank at two of the three approaches, dominance is expressed as follows: (d-a-a) is dominant to (c-b-b), (a-d-a) is dominant to (b-c-b), (a-a-d) is dominant to (b-b-c).
In transitiveness, if a is dominant to b and b is dominant to c, then a is dominant to c. For equability, if the two decision alternatives have the same result, this situation is called absolute equability. However, if there is equability in two of the three situations, then it is called partial equability.
Case Study and Results
Application of TOPSIS Method and Results
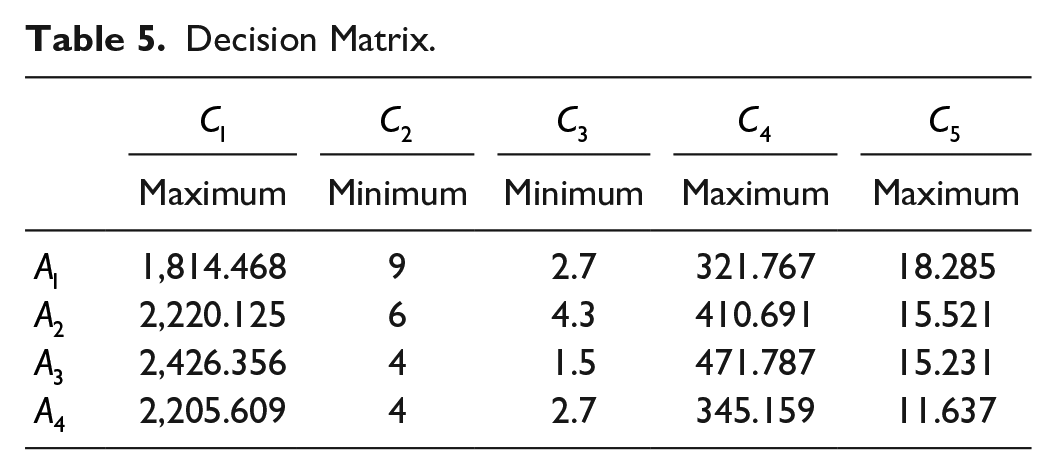
First of all, as a result of evaluations by decision makers, a decision matrix was formed (Equation 1), in which each value in this matrix represents the real value of related criteria. This matrix is presented in Table 5 and the orientations of criteria are included. Then, all alternative scores were normalized using Equations (2) and (3) and the acquired values are given in Table 6.
Decision Matrix.
Normalized Values of Decision Matrix.

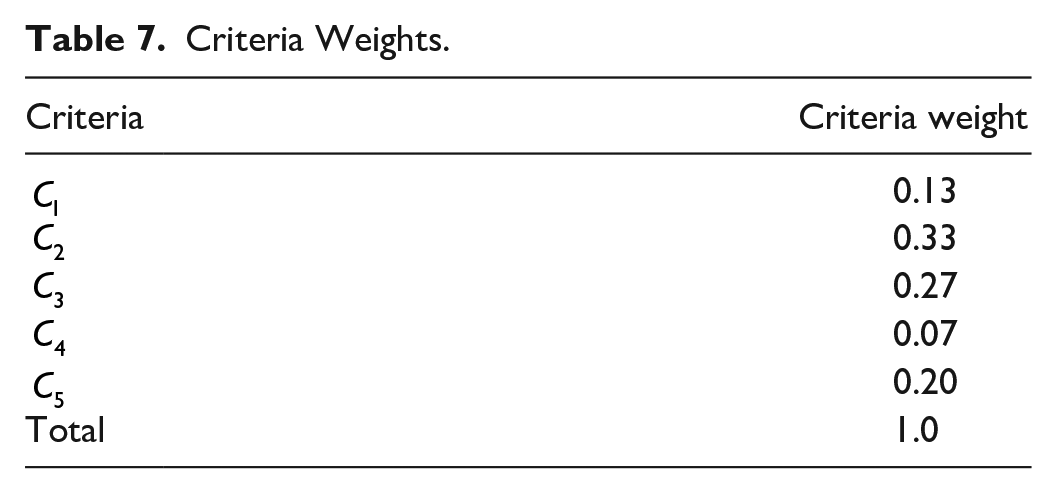
In the proceeding step, the decision makers weighted each criterion based on a 1 to 9 scale, in which 1 represents the worst and 9 represents the best. According to their evaluations, each criterion’s score was divided by the total score and the related criteria weights were obtained. These weights are presented in Table 7.
Criteria Weights.
Then, by multiplying criteria weights with normalization values as given in Equation 5, a weighted normalized decision matrix was generated, which is presented in Table 8.
Weighted Normalized Values of Decision Matrix.

Subsequently, after generating values

As seen from Table 9, the ranking of alternative cities is
Application of WASPAS Method and Results
The WASPAS decision matrix used the same process as the decision matrix of the TOPSIS method and has previously been shown in Table 5. However, for the WASPAS method normalization process, Equations 11 and 12 were utilized and the normalized decision matrix is presented in Table 10 below.
WASPAS Normalized Decision Matrix.

Note. WASPAS = Weighted Aggregated Sum Product Assessment.
Relative performance of alternatives according to WPM and WSM is calculated by Equations 13 and 14. Final performance of alternatives was obtained via Equation 16 for three different
WSM and WPM and Final Rankings of Alternatives for the WASPAS Method.

Note. WSM = weighted sum model; WPM = weighted product model; WASPAS = Weighted Aggregated Sum Product Assessment.
As indicated in Table 11, the ranking of alternative cities is
Application of MULTIMOORA Method and Results
As in the TOPSIS and WASPAS methods, for MULTIMOORA method, a decision matrix was formed by Equation 1, and it utilizes the same values as given in Table 5. Normalization of the decision matrix was the same as the TOPSIS method as well, and the normalized decision matrix has previously been given in Table 6.
The aforementioned four MOORA approaches (MOORA-Ratio, MOORA-Significance Coefficient, MOORA-Reference Point, and MOORA-Full Multiplication) were applied, and the scores of each alternative for each approach are given in Table 12 below.
Alternative Scores for Four MULTIMOORA Approach.

Note. MOORA = Multi-Objective Optimization on the Basis of Ratio Analysis.
The dominance comparisons and final MULTIMOORA rankings are presented in Table 13.
Dominance Comparisons of MULTIMOORA Method.

Note. MOORA = Multi-Objective Optimization on the Basis of Ratio Analysis.
For the MULTIMOORA method, the ranking of alternatives is
Table 14 (as can be seen below) was obtained through comparison of the ranking results of the three methods applied in this study (TOPSIS, WASPAS, and MULTIMOORA).
Comparison of TOPSIS, WASPAS, and MULTIMOORA Rankings.

Note. TOPSIS = Technique for Order Preference by Similarity to Ideal Solution; WASPAS = Weighted Aggregated Sum Product Assessment; MOORA = Multi-Objective Optimization on the Basis of Ratio Analysis.
It can be seen from Table 14 that while TOPSIS and MULTIMOORA resulted in the same rankings (Konya, Antalya, Adana, and Mersin), the rank of the first and second alternative is changed in the WASPAS method (Antalya, Konya, Adana, and Mersin).
Sensitivity Analyses
In this subsection, we performed sensitivity analyses to verify our results structuring 10 different scenarios based on changes in the criteria weights. These analyses are expected to be beneficial to map each alternative’s performance with respect to each criterion. Figure 2 below demonstrates the changes of alternative university location rankings according to different scenarios for TOPSIS, WASPAS, and MULTIMOORA methods. Because in MULTIMOORA method, between the four approaches (MOORA-Ratio, MOORA-Significance Coefficient, MOORA-Reference Point, and MOORA-Full Multiplication), criteria weights are applied only in Significance Coefficient approach, sensitivity analyses are conducted for MOORA-Significance Coefficient approach.

Sensitivity analyses of the results for TOPSIS, WASPAS, and MULTIMOORA methods.
In Figure 2; the colors blue, orange, green, and yellow represent the alternatives Mersin, Adana, Antalya, and Konya, respectively. In these analyses, the ranking of the alternatives is calculated for each scenario.
Obtained results depict that assigning different weights to criteria causes changes in alternatives’ rankings, which present sensitivity of methods to the changes of criteria weights. Furthermore, results show that the proposed methods establish robust and reliable results and it is effective to handle with MCDM problems. In Figure 3 below, sensitivity analyses depicted at Figure 2 are presented based on criteria for each MCDM method. While the x-axis stands for the criteria weights, the y-axis stands for the scores of alternatives.

Results of sensitivity analyses based on each criteria for the utilized MCDM method.
As seen from Figures 2 and 3, it is observed that
In TOPSIS method sensitivity analyses, while
Results and Discussion
This article compared the application of three different MCDM methods with the selection of a new university location problem. The results obtained suggest that Konya is the best location for the new university establishment. However, in TOPSIS method, the score of Konya and Antalya (0.7665 and 0.7742, respectively) is close and Antalya is in the first rank. This situation is caused by the different stages of utilized methods. Also, sensitivity analyses demonstrated the changes in the rankings due to the various criteria weights. Compared with the literature, although there are studies which applied several MCDM methods for location selection decisions (Table 1), it is observed that studies where MCDM is used for location selection of educational facilities have been very rare (Arslan & Yildiz, 2015; Ding & Zeng, 2015; Kuyrukcu & Alkan, 2020). In their study, location selection problem was not the focus, and Ding and Zeng (2015) integrated TOPSIS with information entropy weight (IEW) to examine the overall performance of 68 Chinese universities. Arslan and Yildiz (2015) aimed to determine the location selection of a sport high school between four alternatives in Duzce, Turkey, and utilized fuzzy TOPSIS technique for this aim. Kuyrukcu and Alkan (2020) applied AHP for determining criteria weights and employed TOPSIS to obtain the ranking of alternative five cities for university location problem in Turkey. Thereby, it can be concluded that a study that used three different MCDM methods together for the selection of the education facility, as in this study, was not observed in the literature.
Due to various reasons such as the most important stage of education investments is location selection, as in many sectors, apart from its economic meaning, the choice of location of the educational facility will also deeply affect the social life in the region where it will be established; the place of establishment of the university, which is an educational facility, should also be carefully selected. Therefore, the content of this study was enriched by using the TOPSIS, WASPAS, and MULTIMOORA methods together to solve the problem of choosing the location of establishment of a university. Furthermore, the results are validated performing sensitivity analyses.
As a result of this study, it has become clear that decision-making problems encountered in the education sector, as in other sectors, can be solved and interpreted using MCDM methods. However, our study includes limitations, as well. First, the article integrated a limited number of criteria (5) and we suggest and aim to use more criteria, subcriteria in further studies. Second, the article focused on evaluating four alternatives. For further studies, the case study area can be expended to various regions of country. Other suggestions for later studies include utilizing artificial intelligence, intuitionistic sets, fuzzy logic, Type 2 fuzzy sets, or hybrid methods as new approaches. Also, increasing the number of experts can enrich the research.
Footnotes
Declaration of Conflicting Interests
The author(s) declared no potential conflicts of interest with respect to the research, authorship, and/or publication of this article.
Funding
The author(s) received no financial support for the research and/or authorship of this article.
Ethics
Ethical permission was not needed.
Consent
Consent was not needed.