
Abstract
Despite the booming market of fresh food, the fresh e-commerce platform holds only a limited market share, owing to the lack of habitual usage of these platforms. This article explores the determinants of purchase intention when using a fresh e-commerce platform. The integrated technology acceptance model (Unified Theory of Acceptance and Use of Technology [UTAUT]) is employed as the framework. A questionnaire survey was conducted and is analyzed using the structural equation model. We find that both performance expectancy and social influence have a significantly positive effect on consumers’ purchase intention using fresh e-commerce platforms, while perceived risk has a significantly negative effect. Perceived trust plays a mediating role between performance expectancy and purchase intention, social influence and purchase intention, as well as perceived risk and purchase intention. In addition, food safety awareness is a moderator between perceived trust and purchase intention.
Introduction
As an indispensable necessity in the consumers’ daily life, fresh foods play an important role in the retail market. According to Connected Consumer Survey Report 2018 issued by Nielson, a typical Chinese consumer buys fresh foods three times a week. In particular, fruits and vegetables, with the most repeated purchases, have the greatest impact on the shelf life, followed by fish and seafood. Similarly, data from China Industrial Information Network show that the transaction volume of China’s fresh market reached 1.91 trillion in 2018, representing a year-on-year increase of 6.9%. According to this growth rate, the trading volume of the fresh market is expected to increase to 2.04 trillion in 2019. Considering the rigid demand, the fresh market has the potential for sustained high growth, and it is critical to employ information technology in the value chain of fresh food (Zhao et al., 2019).
By September 30, 2020, 63.2% of the global population had access to the internet while 37.1% of the internet users in Asia are from China mainland (Statista, 2020). Globally, an estimated 1.92 billion people have ever purchased goods online by 2019 (Statista, 2020). However, owing to the short shelf life, costly transport and perishability, along with the hard-to-change consumption habitual behavior, e-commerce channels take only a small portion (12%) of fresh food consumption.
Evidence in recent years shows that consumers are looking for alternative channels to purchase fresh food (Javed et al., 2021; Nikolaou et al., 2017). In particular, since the COVID-19 pandemic in 2020, social distancing during lockdown has stimulated a trend toward e-commerce in retail as well as food supply chain (Ben Hassen et al., 2020; OECD, 2020; Petrescu-Mag et al., 2020). Recent evidence shows a significant change of fresh food purchase toward online platforms in China (Gao et al., 2020) and the United States (O’Connell, 2020).
Consumers tend to place higher expectations on food quality and safety (Van Der Vorst et al., 2009). Thus, it is necessary to look into the characteristics of the product (i.e., food) if we desire to improve the fresh food retailing market. The aim of this study is to increase understanding and knowledge regarding consumer preference and behavioral intention when purchase fresh food online. Our aim is further to gain more insight in how the supply chain of fresh food might improve when equipped with information technology.
We address the above-mentioned aims within the structure of the Unified Theory of Acceptance and Use of Technology (UTAUT), which is widely employed in studies user behavior in various context, like education (K.-T. Wong et al., 2013; Yakubu & Dasuki, 2019), E-learning (Ugur & Turan, 2018), mobile payment (Al-Saedi et al., 2020; Singh et al., 2017), health care wearable devices (Wang et al., 2020), electronic health record (Maillet et al., 2015); health care automatons assumption (Alaiad & Zhou, 2014); website design quality and usage behavior (Al-Qeisi et al., 2014); e-invoice service (Lian, 2015), online insurance (Mendez-Aparicio et al., 2017), online banking (Alalwan et al., 2017; Bhatiasevi, 2016; Martins et al., 2014), and online community (Chen et al., 2019; Rashidin et al., 2020). Despite the application of the UTAUT in the various online context, little knowledge about the online purchase of fresh food is available where perishability is the most evident factor in such a market.
The rest of the article is organized as follows: Second section develops hypotheses based on the theories of UTAUT and introduces constructs mapping; methods for data collection and analysis are introduced in the third section; fourth section presents the results of empirical studies; fifth section discusses the implications; and the final section concludes.
Theories and Hypothesis Development
The UTAUT is largely derived from the technology acceptance model (TAM) (Alalwan et al., 2017; Bhatiasevi, 2016; Dwivedi et al., 2019). The UTAUT shows an advantage in understanding the intention of using certain technology: it explains 70% of the technology acceptance while the previous models could explain only around 40% (Venkatesh et al., 2003). Developed by Venkatesh et al. (2003), the UTAUT suggests Performance Expectancy, Effort Expectancy, Social Influence, and Facilitating Conditions are four core constructs that directly determine behavior as well as its intention, and, in turn, are moderated by demographic characteristics like gender, age, experience, and so on (Venkatesh et al., 2003). Empirical studies endorse the validation of this model in terms of technology acceptance and adoption (Chan et al., 2010; Cheng et al., 2011; Loo et al., 2009; Yang, 2010; Zhou et al., 2010).
Noticeably, the typical UTAUT framework fails to incorporate psychological variables like perceived risk (Tan et al., 2017) and demographic variables like gender and age (Tan & Ooi, 2018). In this study, we refine the initial conceptual model of UTAUT in the context of a fresh e-commerce platform. To be specific, we introduce “perceived risk” as an independent variable, “perceived trust” as the mediator, and “food safety awareness” as the moderator. Purchase intention is the dependent variable and we control demographic variables of consumers in our model.
Performance Expectancy at UTAUT
In the research indicator of performance, an “individual believes that using the system will help him or her to attain gains in job performance” (Venkatesh et al., 2003, p. 447), the construct Performance Expectancy is resulting from the following notions: outcome expectations from the Social Cognitive Theory (SCT) (Bandura, 1986), relative advantage from the Innovation Diffusion Theory (IDT) (Moore & Benbasat, 1991), job-fit from the Model of PC utilization (MPCU) (Thompson et al., 1991), extrinsic motivation from the Motivational Model (MM) (Davis et al., 1992), and perceived usefulness from the TAM (Davis, 1989) and the combined TAM and Theory of Planned Behaviour (TPB) (C-TAM-TPB) (Taylor & Todd, 1995). In the current framework, performance expectancy refers to consumers’ credence that their purchase from a fresh e-commerce platform improves shopping efficiency and lowers cost.
As a primary factor of behavioral intent to employ a certain technology (Chen et al., 2019; Cimperman et al., 2016; Dwivedi et al., 2019; Morosan & DeFranco, 2016; Slade, Dwivedi, et al., 2015; Zhang et al., 2019; Zhou et al., 2010), performance expectancy is the strongest predictor of attitude toward the use and behavioral intentions (Jeng & Tzeng, 2012). Accordingly, consumers’ expectation of the fresh e-commerce platform performance affects the willingness to purchase. Herein, a greater improvement of efficiency brought by the fresh e-commerce platform will make the consumers more inclined to use the platform. Therefore, we propose the following hypothesis:
Effort Expectation
Effort expectation is defined as “ease associated with the use of the system” (Venkatesh et al., 2003, p. 450); the construct Effort Expectancy is derived from the following notions: Perceived Ease of Use from TAM (Davis, 1989), complexity from MPCU (Thompson et al., 1991), and ease of use from IDT (Moore & Benbasat, 1991). In the present context, effort expectancy refers to the ease and convenience that consumers feel while purchasing on the fresh e-commerce platform. To be specific, this construction includes the ease for consumers to find the products they need on the platform and the promptness that they have a solution when encountering specific problems.
Effort expectation touches behavioral objectives more saliently in the stage of early adoption (Venkatesh & Davis, 2000): the adoption process of new technology would be constrained if the designers fail to pay adequate attention to the ease of use (Orlikowski, 1992). In previous studies, an optimistic correlation between effort expectancy and users’ technology acceptance (Dwivedi et al., 2019; Tao, Shao, et al., 2020; Zhou et al., 2010) as well as performance expectancy (Cimperman et al., 2016; Tao et al., 2019; Venkatesh et al., 2003) is tested. For example, Shih et al. (2013) show that the degree of convenience expected by the consumers is positively correlated with consumers’ online shopping attitudes. However, inconsistency exists in the significant terms of effort expectancy in individual behavioral intention (Koenig-Lewis et al., 2015). Accordingly, consumers’ expectations of the fresh e-commerce platform affect their purchase intention. Herein, if the operation of the fresh e-commerce platform is easy and the process is simple, the learning cost of the consumer is reduced, thereby increasing the consumers’ purchase intention via the platform. Therefore, we propose the following hypothesis:
Social Influence
Social influence is defined by Venkatesh et al. (2003, p. 451) “an individual perceives that important others believe he or she should use the new system,” the construct Social Influence is derived from the following notions: subjective norm from the Theory of Reasoned Action (TRA) (Fishbein & Ajzen, 1977) and C-TAM-TPB (Taylor & Todd, 1995), social factors from MPCU (Thompson et al., 1991), and image from IDT (Moore & Benbasat, 1991). In the present context, social influence refers to whether family members or close friends would encourage the purchase on a fresh e-commerce platform.
Social influence has a more noticeable impact on behavioral intention in the early stages of technology adoption (Thompson et al., 1994; Venkatesh & Davis, 2000). The desire to strengthen relationships with important others by following their views of specific behaviors lies in the logic of social influence (Hernandez et al., 2011; Ifinedo, 2016). In previous studies, social influence is tested as a significant antecedent of technology acceptance (Dwivedi et al., 2019; Lunney et al., 2016; Tao, Wang, et al., 2020; Yan & Or, 2019) and directly determines the use of the system (Jeng & Tzeng, 2012). Accordingly, the social influence of consumers affects the purchase intention of using the fresh e-commerce platform. Herein, consumers are more inclined to purchase on the fresh e-commerce platform if their acquaintances purchase products of good quality there.
Besides, subjective images and norms are reflected in the behavior intention (Jeng & Tzeng, 2012). On one hand, consumers’ expectation is significantly influenced by their perception of the brand. On the other hand, their expectation is partly determined by how the brand delivers on its promises (Lassoued & Hobbs, 2015). Likewise, the subject’s immediate environment exerts pressure which also influences the consumers’ expectations (Bilgihan, 2016; De Leeuw et al., 2015). Thus, consumers are more willing to purchase on the fresh e-commerce platform if proper publicity builds them a positive image of the platform. Therefore, we propose the following hypothesis:
Perceived Risk
Pavlou (2003) defines the construct of Perceived Risk as “potential for loss in the pursuit of the desired outcome of using an e-service.” In the present context, the perceived risk refers to the likelihood of a consumer suffering a loss in the purchase on the fresh e-commerce platform. As fresh foods are non-standardized products, consumers’ experience and subjective feelings are employed during purchase. As a new means of fresh foods distribution, fresh e-commerce platform raises consumers’ concern about the uncertainty lying in product quality, delivery promptness, payment security, and so on. The perceived risk thus affects its purchase intention.
Previous studies argued that perceived risk considerably hinders consumers’ business intention (Alalwan et al., 2017). Accordingly, consumers’ perceived risk affects purchase intention on the fresh e-commerce platform. Herein, the fear of loss would prevent consumers from purchasing on the fresh e-commerce platform. Therefore, we propose the following hypothesis:
Mediator: Perceived Trust
Shared trust between provider and their clients is vital to building a successful connection between them (Al-Saedi et al., 2020). As a leading success factor, perceived trust affects the adoption of new technology (Alalwan et al., 2017). In the current study, perceived trust refers to the extent to which the fresh e-commerce users believe that to purchase on the platform is reliable and safe.
The positive impact of perceived trust upon the adoption of new technology is tested in previous studies (Madan & Yadav, 2016; Qasim, Abu-Shanab, 2016; Sharma & Sharma, 2019; Slade, Williams, et al., 2015). Accordingly, consumers’ perceived trust plays a role between consumers’ performance expectations, effort expectancy, social influence, perceived risks, and, ultimately, purchase intention of using fresh e-commerce platforms. Herein, the trust increases due to the positive effect of the four core variables of UTAUT and further leads to increasing purchase intention. Therefore, we propose the following hypotheses:
Moderator: Food Safety Awareness
Food safety consciousness indicates the degree to which consumers concern about food quality and safety issues (Lee et al., 2014). Consumers with different levels of awareness may present different levels of trust in the fresh e-commerce platform, thus presenting different levels of purchase intention. Consumers might directly perceive the true attributes of the fresh foods via the purchase channel, which in turn affects the consumers’ perceived trust in the fresh e-commerce platform. Consumers’ trust in the platform affects their purchase intention directly. This effect is especially important for consumers who are sensitive to the safety of fresh food products. Therefore, we propose the following hypothesis:
Method
A questionnaire survey was conducted, involving 367 people. The survey as the first part involves the basic evidence of the accused, including gender, age, online shopping experience, monthly disposable income, education, and experience of using the fresh e-commerce platform. The questions in this part are single-choice. The second part involves the core measurement of this study, including performance expectancy, effort expectancy, social influence, perceived risk, purchase intention, perceived trust, and food safety awareness. The perceived risk is divided into four dimensions that are measured separately: time risk, product risk, financial risk, and privacy risk. A total of 30 questions are placed in this section and the Likert-type five-level scale is employed. The options for each question using points 1 to 5 to represent “extremely disagree,” “disagree,” “neutral,” “agree,” and “extremely agree,” respectively.
In this study, two statistical software, SPSS25.0 and AMOS23.0, were used and we did a descriptive analysis, reliability test, and validity test. The structural equation model (SEM) was established, and the confirmatory factor analysis and hypothesis verification analysis were conducted.
Empirical Results
Descriptive Statistical
Of the 367 questionnaires distributed online, a total of 357 valid samples were collected in this survey, indicating an effective response rate of 93.75%. Table 1 shows that the typical effective samples in this study are young and middle-aged women with the online shopping experience, with monthly disposable income at low and medium levels, and with higher education.
Descriptive Statistics of the Sample (N = 357).

In terms of gender composition, 111 males accounted for 31.1% of all valid questionnaires, and 246 females accounted for 68.9% of all valid questionnaires. The reasons for women outnumbering men in the effective samples lie in two folds. First, compared with men, women show more interest in shopping on e-commerce platforms and thereby are more interested in responding to related questionnaires. Second, women take the major responsibility of fresh food purchase in most families. Thus, the gender distribution of the samples is basically in line with the facts.
In terms of age composition, the most effective samples under the age of 24 were 220, accounting for 61.6% of all valid questionnaires, and the group aged 25 to 35 was the second with 78, accounting for 21.8% of all valid questionnaires. The age of the valid samples in this study is mainly under the age of 35, accounting for 83.4% of all valid questionnaires, while the sample size of juvenile and middle-aged is quite small. Considering that e-commerce consumers in China are mainly 18 to 35 years old, the sample of this study is in line with the actual situation.
Regarding the experience of online shopping, the number of samples with more than 5 years’ experience is 128, accounting for 35.9% of all valid questionnaires, and the number of samples with 3 or 4 years of online shopping experience is 120, accounting for 33.6% of all valid questionnaires. In other words, the proportion of respondents with 3 years’ experience of online shopping is 69.5% as shown in Table 1. To a certain extent, it shows that consumers with more online shopping experience are more likely to accept new fresh food purchase channels. In addition, comparing the experience data with age distribution, we notice that young people have more experience of online shopping, which is in line with the real world.
In terms of the monthly disposable income, the number of respondents earning less than 1,000 CNY and those earning from 1,001 CNY to 3,000 CNY are 137 and 136, respectively, accounting for 38.4% and 38.1%, respectively (see Table 1). The monthly disposable income of samples is concentrated in the middle- and low-level, reflecting the real income of most internet users in China reported by China Internet Network Information Center (http://www.cnnic.net.cn/hlwfzyj/hlwxzbg/).
In terms of education, the sample size with a bachelor degree is 94, accounting for 26.3% of all valid questionnaires, and the sample with a master degree or above is 72, accounting for 20.2% of all valid questionnaires. The proportion of those with an associate bachelor degree or below is 53.5%. The distribution of educational level is basically consistent with the educational level of most internet users in China reported by China Internet Network Information Center (http://www.cnnic.net.cn/hlwfzyj/hlwxzbg/). Among the valid samples of this study, the proportion of samples with higher education is relatively great, indicating that the better-educated people bear the greater willingness to accept novel things and better capacity to hedge risks.
Reliability Analysis (RA)
RA refers to the degree to which the measurement is consistent or stable. As a relatively mature reliability index of the Likert-type scale, the Cronbach’s alpha coefficient compares the results of any item selected in the measurement questionnaire with the results of all other items (Cronbach, 1951). In general, a greater Cronbach’s alpha coefficient indicates higher reliability of the scale.
Seven measurement variables are employed in this study, including performance expectancy (PE), effort expectancy (EE), social influence (SI), perceived risk (PR), perceived trust (PT), food safety awareness (FSA), and purchase intention (PI). The perceived risk is measured by four dimensions: time risk (PR1), financial risk (PR2), product risk (PR3), and privacy risk (PR4). The reliability analysis is performed on each measurement item and the measurement outcomes are shown in Table 2.
Reliability Analysis of the Scale (N=357).

Note. PE = performance expectancy; EE = effort expectancy; SI = social influence; PT = perceived trust; FSA = food safety awareness; PI = purchase intention; PR = perceived risk; TR = time risk; FR = financial risk.
Table 2 shows that the Cronbach’s alpha of the single item and the whole item of the scale is greater than 0.7, indicating good inside reliability of the variables. The Corrected Item-Total Correlation (CITC) of the revised item is greater than 0.5, designating that the observation item meets the criteria.
Common Method Bias Analysis
A major concern of data is self-reported and common method bias caused by consistency motif or social desirability (Liang et al., 2007; Podsakoff et al., 2003; Podsakoff & Organ, 1986). Herein, we conduct arithmetical investigates to assess the common method bias. Using SPSS25.0, we conduct a Harman single-factor test (Podsakoff & Organ, 1986) on the essential variables in our conceptual model, effort expectancy, perceived risk, food safety awareness, purchase intention including performance expectancy, social influence, and perceived trust. The total variance extracted by one factor is 33.600%, which is less than the recommended threshold of 40%, indicating that common method bias is not contaminating our result.
Confirmatory Factor Analysis (CFA)
KMO test and Bartlett spherical test
The CFA is expended for the validity test in this study, provided that the KMO test (Kaiser–Meyer–Olkin) index value is greater than 0.6 and the Bartlett spherical test results are significant. We first measure the KMO value of the questionnaire by principal component analysis and then conduct the Bartlett spheroid test. For the KMO value of each variable and the Bartlett spheroid test result see Table 3.
KMO Value and Bartlett Spherical Test Result (N = 357).
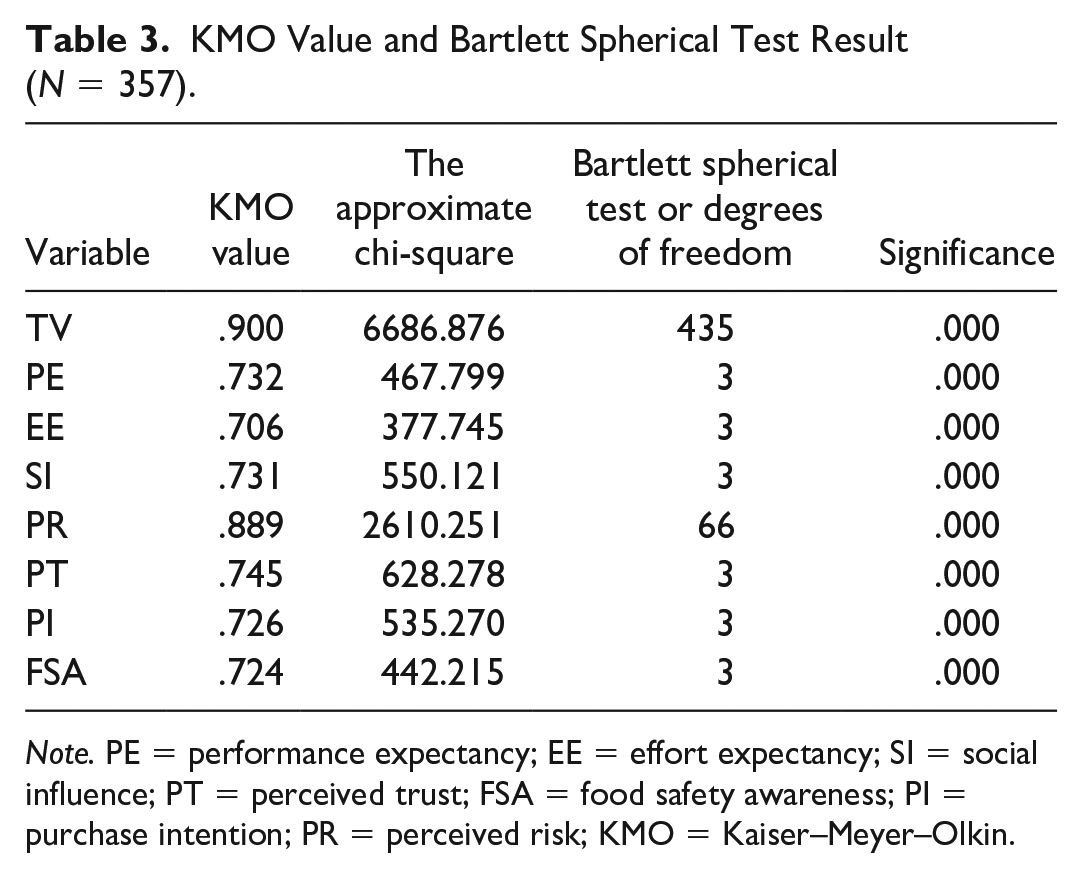
Note. PE = performance expectancy; EE = effort expectancy; SI = social influence; PT = perceived trust; FSA = food safety awareness; PI = purchase intention; PR = perceived risk; KMO = Kaiser–Meyer–Olkin.
Evidently, the KMO values of the scale and each variable are greater than 0.7, and the Bartlett spheroid test result is 0.000, which indicates that the scale data of this study suits factor analysis (see Table 3).
Convergence and validity analysis
Convergence and Validity/rationality are the experimental variables that measure the factor structure during the measurement process and can be located at the same factor level. The convergence efficiency evaluation of the confirmatory factor analysis model can be tested in three aspects. The first aspect is the Factor Load, where the minimum acceptable value is 0.5. The second aspect is the average variance extracted (AVE), where the minimum acceptable value is 0.5. The third factor is composite reliability (CR) with a minimum acceptable value of 0.7.
Ten dimensions are employed in this study, including performance expectancy, effort expectancy, social influence, perceived trust, food safety awareness, purchase intention, time risk, financial risk, product risk, and privacy risk. A total of 30 measurement topics are applied. A confirmatory factor analysis model was performed in AMOS 23.0 software (see Figure 1).

Confirmatory factor analysis model.
We imported data to the SPSS25.0 statistical software and dragged variables to the corresponding positions of the AMOS 23.0 measurement model for fitting verification. The model-fitting results are shown in Table 4.
Confirmatory Factor Analysis Model Fit.

Note. CMIN = chi-square; DF = degrees of freedom; RMR = root mean square residual; GFI = goodness of fit index; AGFI = adjusted goodness of fit index; NFI = normed fit index; IFI = incremental fit index; TLI = Tucker–Lewis index; CFI = comparative fit index; RMSEA = root mean square error of approximation.
As shown in Table 4, the CMIN/DF is 1.075, which is less than 3. The modified goodness of fit index, goodness of fit index, normative fit index, non-normative fit index, and comparison fit index all reach the standard of 0.9 or above. The root mean square of the difference is 0.028, which is less than 0.08. The root mean square of the approximate error is 0.015, which is less than 0.08. On the whole, each fitting index is in line with the general standard, and the model fits well. According to the output of AMOS 23.0 and the calculation of AVE and CR, the summary is shown in Table 5.
Factor Load, CR Value, and AVE Value Summary Table.

Note. PE = performance expectancy; EE = effort expectancy; SI = social influence; PT = perceived trust; FSA = food safety awareness; PI = purchase intention; PR = perceived risk; TR = time risk; FR = financial risk; AVE = average variance extracted; CR = composite reliability.
As is shown in Table 5, the factor load of this study is more than 0.6, which satisfies the first criterion. The compositional reliability (CR) is greater than 0.7, which satisfies the second criterion. The average variation extraction (AVE) was greater than 0.5, which satisfies the third criterion. To sum up, each variable has a good convergence validity, and the convergence efficiency of this study basically reaches the ideal standard.
Discriminant Validity analysis
The Discriminant Validity analysis examines whether there are significant differences in the validity coefficients calculated for different groups of samples (Young, 2001). In this study, the average extraction variance (AVE) of each factor is compared with the squared correlation coefficient between constructs (R2). When the AVE value is greater than R2, the difference validity is good. Table 6 reports details of differential validity analysis.
Discriminant Validity (N = 357).

Note. PE = performance expectancy; EE = effort expectancy; SI = social influence; PT = perceived trust; FSA = food safety awareness; PI = purchase intention; PR = perceived risk.
p < .01.
Bold values are square root of average variance extracted/Discriminant Validity.
Table 6 reports details of differential validity analysis, where ** represents the significance of p<.01.
The figure on the diagonal is the square root of the AVE value for the corresponding factor. As is shown in Table 6, the square root of the AVE value for each factor is greater than the critical value of 0.7. Also, the extracted root of each factor’s AVE value is greater than the correlation coefficient of each variable pair, indicating that the factors have different validity.
Structural Equation Model (SEM)
We construct the preliminary model of the SEM (the initial structural equation and the preliminary measurement model) before the empirical study. First, the role of each variable and the relationship between them should be determined. This study constructs six latent variables: performance expectancy, effort expectancy, social influence, perceived risk, perceived trust, and buying objective.
Initial conceptual model
Figure 2 plots the initial conceptual model of this study.

Initial conceptual model.
Model analysis
Importing the data of the valid samples to AMOS 23.0, we conducted calculations based on the initial conceptual model. Figure 3 plots the SEM.

Structural equation model.
Table 7 reports the test results of model fitting. As shown in Table 7, the CMIN/DF of the model is 1.136, which is less than 3. The goodness of the fitting index, the normative fitting index, the non-normative fitting index, and the comparison fitting index all reach the standard of 0.9 or above. The residual root mean square is 0.023, which is less than 0.08. The root mean square of the approximation error is 0.02, which is less than 0.08. On the whole, each fitting index meets the criteria, and thereby the model fits well.
Model Fit Test Result.

Note. DF = degrees of freedom; GFI = goodness of fit index; AGFI = adjusted goodness of fit index; NFI = normed fit index; IFI = incremental fit index; TLI = Tucker–Lewis index; CFI = comparative fit index; RMSEA = root mean square error of approximation.
Direct effect test
As is shown in Table 8, the performance expectancy has a substantial positive impact on perceived trust (β = .379, p < .05). The effort expectancy has no significant effect on perceived trust (β = .043, p > .05). Social influence has a noteworthy progressive impact on perceived trust (β = .29, p < .05). The perceived risk has a noteworthy negative impact on perceived trust (β = −.186, p < .05). Performance expectancy has a noteworthy progressive effect on the purchase intention (β = .249, p < .05). Efforts expectation has a significant progressive impact on the purchase intention (β = .328, p < .05). Social influence has no significant effect on purchase intention (β = .051, p > .05). The perceived risk had a noteworthy negative impact on purchase intention (β = −.221, p < .05). The perceived trust has a momentous progressive effect on purchase intention (β = .403, p < .05).
Path Coefficient.

Note. PE = performance expectancy; EE = effort expectancy; SI = social influence; PT = perceived trust; PI = purchase intention; PR = perceived risk; SE = standard error; CR = composite reliability.
p < 0.001.
Mediating effect test
This study uses Bootstrapping method for non-parametric statistics to confirm the mediation effect. When 0 isn’t contained Bootstrap confidence interval then direct, indirect and total effect has been combined. With the AMOS 23.0, the Bootstrap method ran 5,000 times. Table 9 reports level values with bias-corrected with the confidence of 95%.
Total Effect, Indirect Effect and Direct Effect.

Note. CI = confidence interval; PE = performance expectancy; EE = effort expectancy; SI = social influence; PT = perceived trust; PI = purchase intention; PR = perceived risk.
As is shown in Table 9, in terms of the total effect, the total effect value of perceived risk on purchase intention is −0.296. The total effect value of social influence on purchase intention is 0.168. The total effect value of the effort expectancy for purchase intention is 0.345. The total effect value of performance expectancy on purchase intention is 0.401. Notably, the Bootstrap confidence interval does not contain 0 for the above-mentioned four results, indicating the existence of the total effect.
In terms of the indirect effect, the indirect effect of perceived trust on purchase intention is −0.075. The indirect effect of social influence on the purchase intention through perceived trust is 0.117. The indirect effect of effort expectancy on purchase intention is 0.017. The indirect effect of performance expectancy on purchase intention is 0.153. Notably, the Bootstrap confidence interval does not contain 0 for the above-mentioned four results, indicating that the indirect effect exists for the four variables except for the effort expectancy.
In terms of the direct effect, the direct effect of perceived risk on purchase intention is −0.221. The direct effect of social influence on purchase intention is 0.051. The direct effect value of the effort expectancy on the purchase intention is 0.328. The direct effect of performance expectancy on purchase intention is 0.249. Notably, the Bootstrap confidence interval does not contain 0 for the above-mentioned four results, indicating that the indirect effect exists for the four variables except for the social influence.
Moderating effect test
Table 10 reports the moderating effect test of food safety awareness.
Moderating Effect Test.

Note. PT = perceived trust; PI = purchase intention; FSA = food safety awareness.
Table 10 reports results of moderating effect test, where *, **, and *** represent significance on the level of p < .05, p < .01, and p < .001, respectively.
As is shown in Table 10, food safety awareness has a noteworthy progressive impact on the relationship between perceived trust and purchase intention (β = .176, p < .05), indicating that purchasers with high levels of food safety awareness are more likely to use the fresh e-commerce platform to purchase when the trust in the fresh e-commerce platform is higher than that of consumers with low food safety awareness. Figure 4 plots the role of food safety awareness on the relationship between perceived trust and buying aim.

Moderating effect of food safety awareness.
Discussions and Implications
Discussion of Findings
In this article, we explore the factors affecting purchase intention in the context of fresh e-commerce platforms. Table 11 briefs the nine hypotheses proposed in “Theories and Hypothesis Development” section and reports the results of the empirical study.
Empirical Results of Hypotheses.
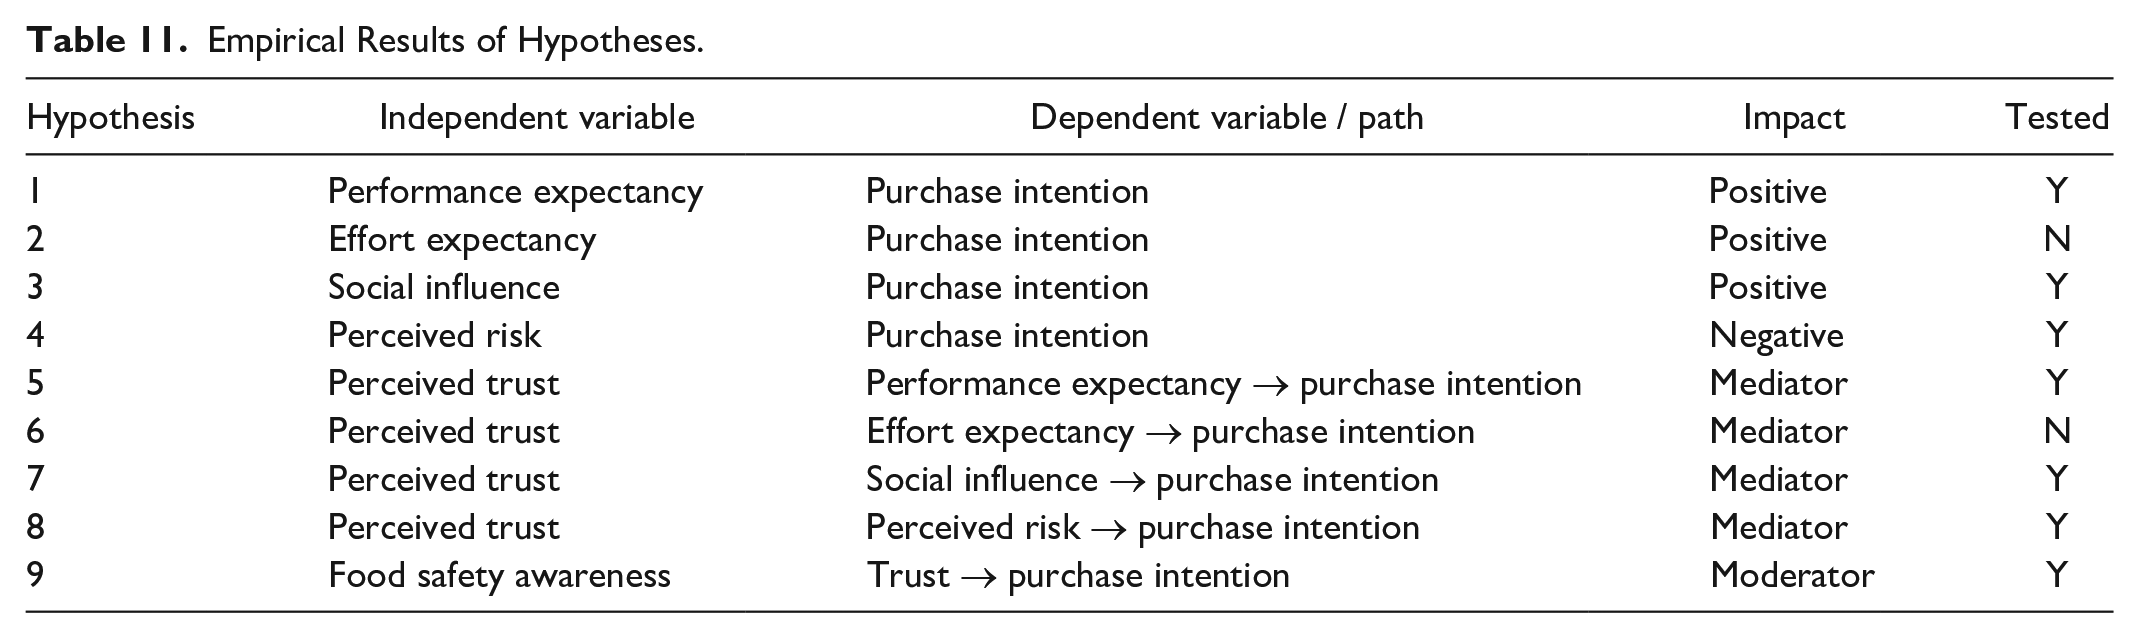
As is shown in Table 11, the hypotheses proposed are tested. To be specific, Hypothesis 2 is tested as insignificant; that is, the positive effect of effort expectancy on purchase intention shows no significance (see Table 8). Hypothesis 6 is also tested as insignificant, for the indirect effect of effort expectancy on purchase intention is not significant (see Table 9). Notably, the effect of effort expectancy differs from the results of prior literature (Dwivedi et al., 2019; Tao, Shao, et al., 2020; Zhou et al., 2010). Previous studies are based on the instance of different markets and the products vary across studies. The insignificant effect of effort expectancy, in some sense, implies consumers who are accustomed to the convenience and promptness of e-commerce in recent years are less sensitive to a marginal improvement of the fresh e-commerce platform in terms of technology.
Empirical research within the framework of the UTAUT model shows findings as follows. First, the performance expectancy exerts a significantly positive effect on consumers’ purchase intention of using a fresh e-commerce platform, which is in line with the majority of prior literature (Cimperman et al., 2016; Dwivedi et al., 2019; Ooi et al., 2018; Tao et al., 2019; Tan & Ooi, 2018; Tao, Shao, et al., 2020; Venkatesh et al., 2003; Zhou et al., 2010). It implies that the efficiency and lower cost brought by the platform (in comparison with traditional retailers) is crucial to attracting users. Second, the social influence exerts a significantly positive effect on consumers’ purchase intention of using a fresh e-commerce platform, in line with prior literature (Dwivedi et al., 2019; Jeng & Tzeng, 2012; Lunney et al., 2016; Tan & Ooi, 2018; Tao, Wang, et al., 2020; Yan & Or, 2019), which reveals a potential manner of peer effect in the context of emerging information technology. It implies that making the platform prevalent and fashionable (through advertising, promotion, etc.) is crucial to maintain a customer base as well as to attract new users. Third, the perceived risk exerts a significantly negative effect on consumers’ purchase intention of using a fresh e-commerce platform, which is in line with the conclusion of prior studies (Alalwan et al., 2017; Tan & Ooi, 2018). Thus, as an online retailer specialized in non-standardized products, the fresh e-commerce platform is expected to lower the perceived risk through product quality checks, improvement of delivery and refunding methods, enhanced security of payment, and so on. Fourth, the perceived trust plays as the mediator in the pair of purchase intention/performance expectancy, purchase intention/social influence, and purchase intention/perceived risk. It implies that the fresh e-commerce platform needs to not only improve its service but also present the improvement and its effort to the users. Fifth, food safety awareness plays as the moderator between perceived trust and purchase intention. Thus, it is recommended that the platform should classify the users on the basis of their awareness regarding food safety.
Limitations and Future Directions
A limitation of this study lies in the skewed sample of our study, which might raise a major concern about the generalizability of our findings. As is shown in Table 1, the sample employed in this study is dominated by young (i.e., aged 24 and below) and comparatively low-income (i.e., with monthly disposable income no more than 3,000 CNY) respondents. Recruitment of diverse samples in terms of age and income is a possible direction of future research on this topic. Considering the decision-maker of fresh food purchase is usually the elderly in typical Chinese families, compatibility would be a determinant of purchase intention (Ooi et al., 2018; C.-H. Wong et al., 2015). Furthermore, income exerts an impact on the acceptance and preference of platform users due to the wealth effect. Thus, it would be interesting to look into the purchase intention across income spectra. Another concern of this study is the missing variables. For example, we investigate limited access to the fresh e-commerce platform (i.e., PC). In future research, we would consider the fact that an increasing number of users access fresh e-commerce platforms via mobile rather than PC. Hence, characteristics of the mobile end are to be incorporated, for example, perceived mobility (Tan & Ooi, 2018). Furthermore, as suggested in existing literature, gender moderates the effect on purchase intention (Tan et al., 2017) and we would factor it into our future models. Finally, as is widely used in existing literature, a latitude survey is employed in our study. Considering the developing information infrastructure, we recommend a longitude survey or a meta-analysis of surveys across periods on this topic.
Managerial Implication
Optimizing the operational processes and search systems of the platform will increase consumer adoption and ease of use of the platform, thereby increasing consumer purchase intention. On one hand, most fresh foods are perishable and the most purchase is intended for immediate needs. Furthermore, the pursuit of convenience and speed motivates the purchase of fresh food in most cases. Thus, compared with the purchase of clothing, consumers prefer quick search rather than wandering-and-exploring when purchasing fresh food. On the other hand, as the family decision-maker in terms of fresh food purchase, the middle-aged and the elderly are less familiar with e-commerce platforms when compared with the young generation. Thus, simplification and optimization of the platform are vital to a better purchase experience.
Standardization of fresh foods will reduce the perceived risk of consumers, especially the perceived risk of product quality, thereby enhancing consumers’ purchase intention. The biggest difference between e-commerce fresh platforms and traditional distribution channels is the way that consumers judge the quality and freshness of products. When purchasing via an e-commerce platform, consumers could gather relevant information about the product through pictures on display and comments from others. A set of standardization rules including product appearance and specifications would mitigate the information asymmetry between consumer and provider. Through these visual transparency standards, consumers’ perceived risks are reduced, and their trust in the fresh e-commerce platform is enhanced, thereby increasing their purchase intention through the fresh e-commerce platform.
Publicity enables consumers to receive more social influence, which will guide consumers to form brand awareness and trust in the fresh e-commerce platform. Although the fresh e-commerce platform has shown an upward trend since 2012, it failed to attract adequate interest until the recent couple of years; that is, consumers have not yet formulated a substantial habit of purchase on these platforms. Thus, publicity is necessary to make this emerging distribution channel better accepted. Also, the fresh e-commerce platform is recommended to train the consumption skills of the initial consumers to enhance the purchase intention of the fresh e-commerce platform in the continuous social interaction.
Optimization of the supply chain with a focus on food safety will essentially solve the problem of low consumer trust and high perceived risk, especially consumers’ concerns about food safety issues. Comprehensive system management and control are of great significance to all types of fresh e-commerce platforms, especially the online e-commerce platform of third-party platform types. Visual safety certification and the information of trackable supply chain reduce consumers’ perceived risks.
Conclusion
Due to the COVID-19 lockdowns, the e-commerce platform shows great potential in fresh food retail. Within the framework of UTAUT, this study provides some knowledge regarding consumer preference and behavioral intention when purchase fresh food online. The empirical study of this article shows that performance expectancy and social influence exert a significantly positive effect on consumers’ purchase intention of using a fresh e-commerce platform, while the perceived risk exerts a significant negative effect. Furthermore, the perceived trust serves as the mediator while the food safety awareness as the moderator. Accordingly, we recommend that the fresh e-commerce platform upgrade its efficiency, lower the users’ cost, advertise to a larger audience, and publicize its effort and improvement. In addition, the platforms are recommended to make the users with stronger awareness of food safety as target audience when publicizing their effort in food quality. The study contributes by providing a better explanation among the consumers in China mainland to adopt e-commerce platforms for purchasing fresh food. Thus, the study will be useful for e-commerce developers and fresh food retailers in helping them strategize to promote online platforms as the preferred medium to purchasing fresh food.
Footnotes
Declaration of Conflicting Interests
The author(s) declared no potential conflicts of interest with respect to the research, authorship, and/or publication of this article.
Funding
The author(s) disclosed receipt of the following financial support for the research, authorship, and/or publication of this article: This research was funded by Humanities and Social Sciences Projects of Universities in Jiangxi Province (No.JJ18202), Science and Technology Project of Jiangxi Provincial Department of Education (No.GJJ209923, GJJ171069) and the General Project of Philosophy and Social Science Research in Colleges and Universities in Jiangsu Province(No. 2019SJA0678).