
Abstract
China’s urbanization has maintained a high growth rate for a long period of time, but the contradiction between urban and rural land use has become increasingly prominent. Link policy, promulgated in 2005 by the Chinese Central Government, made a positive attempt to promote the sustainable use of urban and rural land, which has attracted much attention. This article focuses on the implementation effects of this policy from the micro-perspective of farmers’ satisfaction and its underlying influence factors using a structural equation model (SEM) based on a cross-sectional dataset of 280 households surveyed in Chongqing city, China. The results show that the farmers’ satisfaction under the Link Policy is high, and most of the respondents are satisfied with the Link Policy at present. Furthermore, the farmers’ satisfaction is affected by their expectations, perceived value, and perceived quality. Among these factors, perceived quality has the strongest positive impact on farmers’ satisfaction, for which compensation equity under the Link Policy is most important to farmers. However, farmers’ expectations and perceived value have a negative impact on farmers’ satisfaction, which indicates that the higher the farmers’ expectations and perceived value, the lower their satisfaction. In addition, there is a strong positive correlation between farmer satisfaction and farmer trust, which means that the higher the level of farmer satisfaction, the more support the farmers will give to the government. These main results have heuristic implications for policymakers to improve the Link Policy, thereby enhancing the farmers’ satisfaction and thus achieving the goal of sustainable use between rural and urban land.
Introduction
Land resources, as the predominant carriers of socioeconomic activities, direct the spatial and temporal evolution of the social economy (Hong et al., 2017). With the rapid progress of urbanization and industrialization, many countries in the world are confronted with common land problems, which include disorderly sprawl of urban boundaries, sharp decrease of cultivated land, and destruction of open space (Lisec et al., 2014). To solve these problems, a variety of land policies like Transfer of Development Rights (TDR), Purchase of Development Rights (PDR), and land consolidation have been issued by many countries to allocate the land resource between urban area and rural area more effectively (Cay & Ertunc, 2019; Haldrup, 2015; Lisec et al., 2014). These policies have achieved remarkable effects in the United States and Europe. Land consolidation policy in Europe not only solved the problem of land division between urban and rural areas but also increased the area of agricultural land and improved rural services and infrastructure (Lisec et al., 2014). The TDR policy implemented by the United States had been used to protect agricultural land and ecologically sensitive areas successfully for the past years and the total number of projects has reached 239 in 2016 (H. Wang et al., 2010).
The past four decades have seen increasingly rapid advances in the fields of industry development and urban expansion in China, which has experienced impacts on the social, economic, and environmental landscape of its urban and rural areas (Y. S. Liu et al., 2014; Long et al., 2010; Travers et al., 2015). A huge building boom began in the early 1980s, wherein large stretches of good farmland were converted into urban construction land, leading to a dramatic decrease in farmland (Christiansen, 2009). Data published in China’s Rural Development Report show that, during 1981 to 2015, urban construction land in China increased from 6,720 to 51,584 km2, while the amount of farmland decreased largely from 12,488 km2 in 1991 to 10,570 km2 after 34 years. Conflicts between construction land demand and farmland protection have become more pronounced as a result of the contradictions between continuous economic growth and the strict cultivated farmland protection schemes implemented by the Chinese central government (Jiang et al., 2015; Tang et al., 2015). Meanwhile, with the continuous acceleration of the urbanization process, a large number of rural citizens migrated to cities and towns, which also led to the phenomenon of rural construction land being wasted and used increasingly inefficiently; during this period, many “hollow villages” appeared (Huang et al., 2018; H. Wang et al., 2012a).
With available state-owned construction land decreasing and urban redevelopment costs rising, collectively owned rural construction land that was used inefficiently inevitably became a target for institutional innovation (Wei & Zhao, 2009). To use urban and rural construction land together, the Ministry of Land and Resources of China promulgated a policy in 2005 titled the “Link the increase in urban construction land with the decrease in rural construction land policy” (or simply, the Link Policy), which is characterized by the joint use of urban and rural construction land to increase land-use efficiency and improve the sustainability of rural development (Haldrup, 2015; Huang et al., 2018; Q. Y. Wang et al., 2014; Wei & Zhao, 2009). By implementing this policy, rural construction land is converted to cultivated land through reclamation, and the quantity of newly added cultivated land can be substituted with an urban construction land quota for urban sprawl to ensure that the total amount of rural and urban construction land is constant. In the process of this policy, the residents living in the original area were concentrated in the newly planned centralized residential living areas that were constructed by the local governments (Ong, 2014). Under this policy, the construction land reduced through reclamation in rural areas and the new construction land added to urban areas are referred to as the Link Project (Cheng et al., 2018; Ong, 2014). After the implementation of this policy, the pressure on urban construction land was greatly relieved, and the utilization efficiency of rural construction land was improved to a certain extent, but the living conditions, living environments, and working modes of the farmers who participated in this policy also changed radically (Zou et al., 2019).
As a substantial part of the Link Policy, prior researchers have attempted to evaluate the effects of this policy from the perspective of rural construction land reclamation. Previous studies have reported the methods and implementation processes for land reclamation, including the barriers to effective land reclamation, a path analysis of the land reclamation model, and a new model for land reclamation (Cay & Ertunc, 2019; Haldrup, 2015; Lisec et al., 2014). Different analytical methods, such as probit models, statistical analyses and logistic regressions, and case studies, have been used extensively to analyze the influential factors of rural residents’ willingness to participate in the land reclamation implemented under the Link Policy (Lisec et al., 2014; Luo & Timothy, 2017). To further investigate the changes resulting from rural land reclamation from different perspectives, W. P. Liu et al. (2018) compared two typical rural residential land reclamation and allocation practices to examine the changes on resource–environment effects and rural resident effects. In addition, some scholars have paid attention to the concentration of the original residents, which is another indispensable part of the Link Policy. Multiple types of community-based concentration and rural concentrated resettlement methods have been investigated extensively by scholars using comparative and case study methods (W. P. Liu et al., 2018; H. Wang et al., 2010). Some studies have focused on the changes in farmers’ living conditions after moving to concentrated areas (Zou et al., 2019). Moreover, to interpret and assess the Link Policy, a broader perspective has been adopted by some scholars who analyze and evaluate the Link Policy from a macro-perspective, comparing the related land use policies to indicate current land use challenges (Y. S. Liu et al., 2014; Tang et al., 2015) and discussing the impacts of the Link Policy in response to analyzing the phenomenon of the “hollowing village” (Long et al., 2012). A more substantial approach to assess the impacts of the Link Policy on local economic growth from a macro-perspective can be found in Zhang’s study (Zhang et al., 2014).
Although existing research has analyzed the Link Policy from multiple perspectives, scholars have focused more on policy evaluations of the implementation effectiveness at a macro level, rather than at a micro level from the perspective of farmers. In the few existing micro studies on the Link Policy, scholars mostly explored the farmers’ willingness to participate in the Link Policy, and the research methods were mostly focused on case studies, which lack an empirical analysis using specific micro data from farmers. Farmers are crucial participants of the Link policy, and its success largely depends on farmer satisfaction. In recent years, there has been an increasing amount of literature on farmers’ satisfaction of land use policies in China, such as research on land expropriation (Cao & Zhang, 2018), land transfer (Sun & Zhou, 2019), and land consolidation (Luo & Timothy, 2017), but research on the satisfaction of farmers under the Link Policy is relatively less common. Although some research has explored satisfaction under the Link Policy (Luo & Timothy, 2017; Shui et al., 2014), no single study has constructed a theoretical framework to analyze the underlying factors. Thus, to promote the implementation of the Link Policy, it is necessary to evaluate the policy with quantitative methods from the perspective of farmers’ satisfaction and clarify its influencing mechanisms. To focus on the implementation effects of this policy from the perspective of farmer satisfaction and its influencing factors, this article constructs a theoretical framework of farmer satisfaction under the Link Policy and uses the Structural Equation Model to quantitatively analyze the influencing factors based on a cross-sectional dataset surveyed in Chongqing city, China. This study contributes to the literature on the evaluation of the Link Policy and may help inform public policy makers on how to use urban and rural land resources more sustainably and how to achieve coordinated urban–rural development in China, as well as in other developing countries.
Conceptual Framework
General Customer Satisfaction Model
Since the 1990s, to better enhance the competitiveness of enterprises, many countries have carried out national customer satisfaction index evaluation work (Wood et al., 2008). Sweden pioneered the establishment of a national customer satisfaction index in 1989, known as the Swedish Customer Satisfaction Barometer (SCSB) (Mayer et al., 2009). Next, the United States and the European Union successively established their own customer satisfaction index models: the American Customer Satisfaction Index Model (ACSI) and the European Customer Satisfaction Index Model (ECSI), respectively. Although there were subtle differences in the designs of the three satisfaction models above, the core system of the three models is consistent. Under the core system of the customer satisfaction model, customer satisfaction, customer expectation, perceived quality, perceived value, customer complaints and customer loyalty comprise a causal chain where customer satisfaction is the core variable. This causal chain begins with an antecedent variable affecting customer satisfaction, such as customer expectations, perceived value, and perceived quality. Ultimately, variables like customer loyalty and customer trust are the resulting variables that are directed by customer satisfaction. The customer satisfaction model has been widely used, not only to evaluate the quality of enterprise products and services but also to evaluate the performance of government public services (Verdegem & Verleye, 2009).
Satisfaction Model Under the Link Policy
As a public policy, the Link Policy is closely related to farmers’ lives. As the “customer” of this policy, farmers obtain compensation and the relevant supporting policies provided by local governments, such as a centralized resettlement area, contracted land transfer and social security replacement, at the cost of abandoning their original homestead and housing. Therefore, based on the general customer satisfaction model, this article includes the characteristics of the Link Policy and constructs a farmer satisfaction model, which is shown in Figure 1. The model is a causal chain composed of a core variable, an antecedent variable, and a result variable, among them, farmer satisfaction is the core variable of the model; farmer expectations, perceived value, and perceived quality are the antecedent variables of the model; and farmer trust is the result variable of the model.

Satisfaction model under the Link Policy.
The definition of each variable in the model is explained as follows: Farmer satisfaction is the core variable of this model and the center of the whole causal chain. In the model of this article, farmer satisfaction refers to the overall evaluation of the Link Policy by the farmers who participated in this policy. In consideration of the farmers who participated in this policy but had no previous experience with it, the expectations of farmers in this model are a type of “should expectation” rather than a “will expectation,” which is different from the general consumer satisfaction model (Diaz, 2017). The perceived quality in this model refers to farmers’ intuitive feelings on the services provided by the government in the Link Policy, such as the compensation method, work procedure, and compensation fairness. Perceived value refers to customers’ subjective feelings formed by a comparison between the perceived quality of their gains and the costs the farmers have paid under this policy. In the Link Policy model, the perceived value of farmers refers to their feelings after comparing their revenue and costs under this policy. In the general customer satisfaction model, the result variable is reflected by the variable of customer loyalty, which refers to the psychological tendency of customers to repeatedly purchase a certain product or service. Since the Link Policy belongs to the public service of one-time consumption by farmers, there is no possibility to repeatedly consume this public service. Therefore, this article uses farmer trust as the result variable of the satisfaction degree, which refers to the trust degree of the farmer to the government and the support degree of future policies.
In the satisfaction model under the Link Policy, farmer satisfaction is the core variable of the whole model, and farmer expectation, perceived value, and perceived quality are the antecedent variables that affect farmer satisfaction. Farmers’ expectations of the Link Policy, their perceptions of the service quality provided by the government, and their perceived value of these services will affect farmer satisfaction under this policy. Therefore, the antecedent variables in this model are all directed toward farmer satisfaction in the forms of arrows. Meantime, there is also a causal relationship between the three antecedent variables shown in Figure 1. As the source variable, the expectations of farmers impact the farmers’ perceived quality and perceived value. Perceived quality, as a vital component of perceived value, also has a certain impact on the perceived value. As the result variable of the whole model, farmer trust is directly affected by farmer satisfaction.
Research Hypothesis
Based on the above definitions of the model variable and an explanation of the theoretical framework, we have a clear understanding of the causal relationships among the various variables, but we remain unsure of the specific relationships between the different variables. Thus, we propose the following five hypotheses based on previous research on the Link Policy (Cheng et al., 2018) and related research on the general customer satisfaction model (Chou et al., 2014).
Figure 1 shows the hypothetical specific relationships between the different variables in the Link Policy model.
Data and Method
Study Area
The most imperative role of the Link Policy is to solve the widening gap between the supply of rural construction land and demand for urban construction land, especially in metropolitan areas in China. As shown in Figure 2, Chongqing, located in the southwest of China, is the only municipality directly under the jurisdiction of the central government in the central and western region of China. It covers 82,400 km2 and has jurisdiction over 38 districts and counties. In 2018, Chongqing had a permanent population of 31.017900 and a GDP of 2.036319 trillion Yuan. In the past 10 years, Chongqing has witnessed rapid economic development, continuous upgrading of its industrial structure, and continuous expansion of its urban scale. Although urbanization and industrialization have yielded prosperity in regional development, under the overall rapid economic development, this uncoordinated regional development is becoming increasingly serious and poses a major hidden danger in Chongqing. To solve these problems, Chongqing was approved by the central government in 2007 to established an overall reform pilot area between urban and rural areas; they formally implemented the Link Policy in 2008. Since then, the Link policy has been rapidly promoted in Chongqing. By 2018, 38 districts and counties in Chongqing had participated in this policy, with an accumulated trading rural–urban land quota of 101.26 km2.

Location of Chongqing City and the study area.
In 2020, Chongqing has 38 districts and counties, which are divided into three urban functional regions according to the differences between their geographical locations and economic development levels. The three regions are named the “One-hour Economic Region,” the “Southeast Region,” and the “Northeast Region” (see Figure 2). The “One-hour Economic Region” has the highest level of urbanization and economic development and the largest demand for urban construction land. The urbanization and economic development level of the “Southeast Region” and “Northeast Region” is weak, and the human–land relationship is relatively relaxed. Considering the different numbers of link projects among three regions, we determined the number of sample districts and counties in three regions according to a ratio of 2:2:1. In combination with the implementation situation of the Link Policy in different districts and the economic situation, we finally selected the Qijiang district and Jiangjin district in the “One-hour Economic Region,” the Wanzhou district and Yunyang county in the “Northeast Region,” and the Qianjiang district in the “Southeast Region” as research areas.
Data Collection
The specific data used in this study were collected from a survey sampling of 280 households in the research areas from July to September 2018. Stratified random sampling was adopted for the sample selection. First, we randomly selected two towns as sample areas in each research area based on the number of Link Projects, and we finally identified 10 research towns in Chongqing (see Figure 2). Similarly, two sample villages were randomly selected from each research town. We then randomly selected 10–15 farmers who have participated in the Link Policy in each sampling village. As a result, a total of 300 household questionnaires in 20 villages from 10 towns were investigated using a face-to-face questionnaire survey. We ultimately used 280 samples after eliminating samples with insufficient information. A structured questionnaire was used in this survey that included about 100 questions, nearly half of which were open questions investigated through a face-to-face questionnaire survey by trained interviewers consisting of PhD, Masters, and undergraduate students. This questionnaire was mainly based on the satisfaction model under the Link Policy, on the premise of obtaining an in-depth understanding of the Link Policy and research area in advance, and was designed in combination with the questionnaire used by existing relevant researchers (Ma et al., 2012; Wood et al., 2008). This questionnaire mainly included five sections (Farmers’ expectations, perceived quality [including the three quality factors of compensation method, compensation procedure, and compensation equity], perceived value, farmer satisfaction, and farmer trust) with different observation variables for the six sections. The main body of the questionnaire adopts a Likert-type 5-point Scale Method, including single choice question and open questions.
Specifications of the Structural Model
In this article, the Structural Equation Model (SEM) was selected to explore the internal interactions among the variables in theoretical model to verify the research hypotheses proposed in this article. The SEM is a multivariate statistical method that can analyze the relationship between multiple variables at the same time. Latent variables cannot be directly observed and measured and instead need to be measured indirectly through several indicators. The observed variables are variables that can be directly observed and measured. In the Link Policy satisfaction model constructed in this article, farmer satisfaction, farmer expectation, perceived quality, perceived value, and farmer trust are all latent variables in the structural equation model. These variables cannot be directly measured but should be reflected by the measured data from the observation variables. To accurately reflect the latent variables, we selected 14 related observation variables for different latent variables and built a hypothesized structural equation model (see Figure 3).

The hypothesized structural model.
Variable Definition and Descriptive Statistics
According to previous research, the quality of public services implemented by the government have a great impact on citizens (Wood et al., 2008). Therefore, we selected six observational variables to measure the perceived quality based on three dimensions: compensation method, compensation procedure, and compensation equity. PQ1 and PQ2 refer to the perceived quality of the compensation method provided by the government. PQ3 and PQ4 refer to the perceived quality of the compensation procedure. PQ5 and PQ6 refer to the perceived quality of compensation equity. EP1, EP2, and EP3, respectively, represent the expectations for a compensation fund, supporting policies, and living conditions. PV1 and PV2 measure the perceived value of participation in the decision-making process and changes in living conditions, respectively. FS represents overall satisfaction with the Link Policy. FT1 and FT2 measure the farmers’ confidence in and support for the government. For the different observation variables and demographic characteristics of the interviewed farmers, we designed and asked corresponding questions in the questionnaire based on a 5-point Likert-type scale (see Table 1).
The Variables and the Specific Questions in the Questionnaire.

The descriptive statistics of the variables and the demographic characteristics of the interviewed farmers are shown in Table 1. Regarding the farmer and household characteristics variables, we found that 68.60% of the surveyed household heads were men, and their ages were mostly above 60. Most of the respondents (67.14%) finished primary school or below. The value of the farmer satisfaction variable was obtained by asking the respondents about their overall satisfaction with the Link Policy. From the results, 11.07% of the respondents were very satisfied, and 71.79% respondents were satisfied, with the implementation effect of the Link Policy. The variable of farmer trust was mainly reflected in two aspects: the respondents’ support of this policy and their confidence in the implementation of the policy. The survey results show a high level of farmer trust, as 81.12% respondents chose to support the government. In terms of farmer expectations, we designed three questions to ask the farmers about their expectations for the compensation fund, supporting policy, and living environment. The results show that the farmers’ expectations for these factors were at a medium level, with relatively high expectations for the improvement in living conditions, which means that most farmers are looking forward to a more comfortable living environment by participating in the Link Policy. For perceived quality, we established corresponding questions on the compensation method, compensation procedure, and compensation equity to determine the perspectives of the farmers. The results show that the farmers’ perceived quality was at a high level, among which the perceived quality of the compensation procedure was the highest. Finally, the farmers’ perceived value was also at a high level. Most of the surveyed farmers did not regret participating in the Link Policy and thought that their living conditions were significantly improved.
Reliability Test of Variables
A reliability test is mainly used to measure the stability and reliability of data from a questionnaire. Cronbach’s coefficient alpha is generally used to estimate the reliability of questionnaire data. Churchill and Peter (1984) recommended that an acceptable reliability level for Cronbach’s alpha is greater than 0.60 (W. X. Wang et al., 2012b), while Nunnally and Bernstein (1994) suggested that the minimum Cronbach’s alpha should be 0.6 when a new measure is applied, otherwise the alpha value should not be lower than 0.7 (Nunnally & Bernstein, 1994). Considering this study is the first to use this scale to investigate the factors affecting farmers’ policy satisfaction, the cut-off value for the Cronbach’s alpha was set to 0.60. A validity analysis is mainly used to measure the validity of sample data and the extent to which the sample data reflect the true meaning of the variables that the researchers seek to study. The results of Bartlett’s test of sphericity and the KMO test (Kaiser–Meyer–Olkin) help explain the validity of the questionnaire (Heck, 2008). Kaiser has a common KMO metric: A range of 0.9 to 0.8 indicates a fit; a range between 0.8 and 0.7 means fair; a range between 0.7 and 0.6 is inappropriate; and anything below 0.5 is extremely inappropriate. We used the SPSS 20.0 software to analyze the reliability and validity of the sample data; the results for the overall questionnaire are shown in Table 3. The Cronbach’s alpha for observable variable and latent variable was 0.66, which is greater than 0.60, and the KMO was 0.9–0.8, indicating an appropriate level of reliability and validity.
Results
Goodness-of-Fit of SEM
To obtain the interaction relationships between the different variables, we used the SEM software Amos 20.0 and adapted a maximum likelihood estimation method to fit the model. After preliminary calculations, the estimated results of the model show that the path coefficients of farmer expectations, perceived value, perceived quality, and satisfaction were not significant, and the overall correction coefficients (χ2/df) of the model were as high as 45.08, indicating that it is necessary to modify the model. In the process of correcting the model, we modified the model through the correction index, added the residual correlation path, and then achieved an improved model (see Figure 4). In the end, the correction coefficient of the model was less than 5.00, indicating that the model needs no further modification. Table 2 shows the goodness-of-fit results of the SEM model, which indicates the overall correction coefficients (χ2/df), the Comparative Fit Index (CFI), the Normed Fit Index (NFI), the Incremental Fit Index (IFI), the Tucker–Lewis Index (TLI), the Parsimonious Normed Fit Index (PNFI), and the Parsimonious Comparative Fit Index (PCFI). Compared with the cut-off value, all the results of the goodness fit index are in accordance with the cut-off value, indicating that the improved model is in good agreement with the observed values. These indicators meet the requirements, so the model fits well.
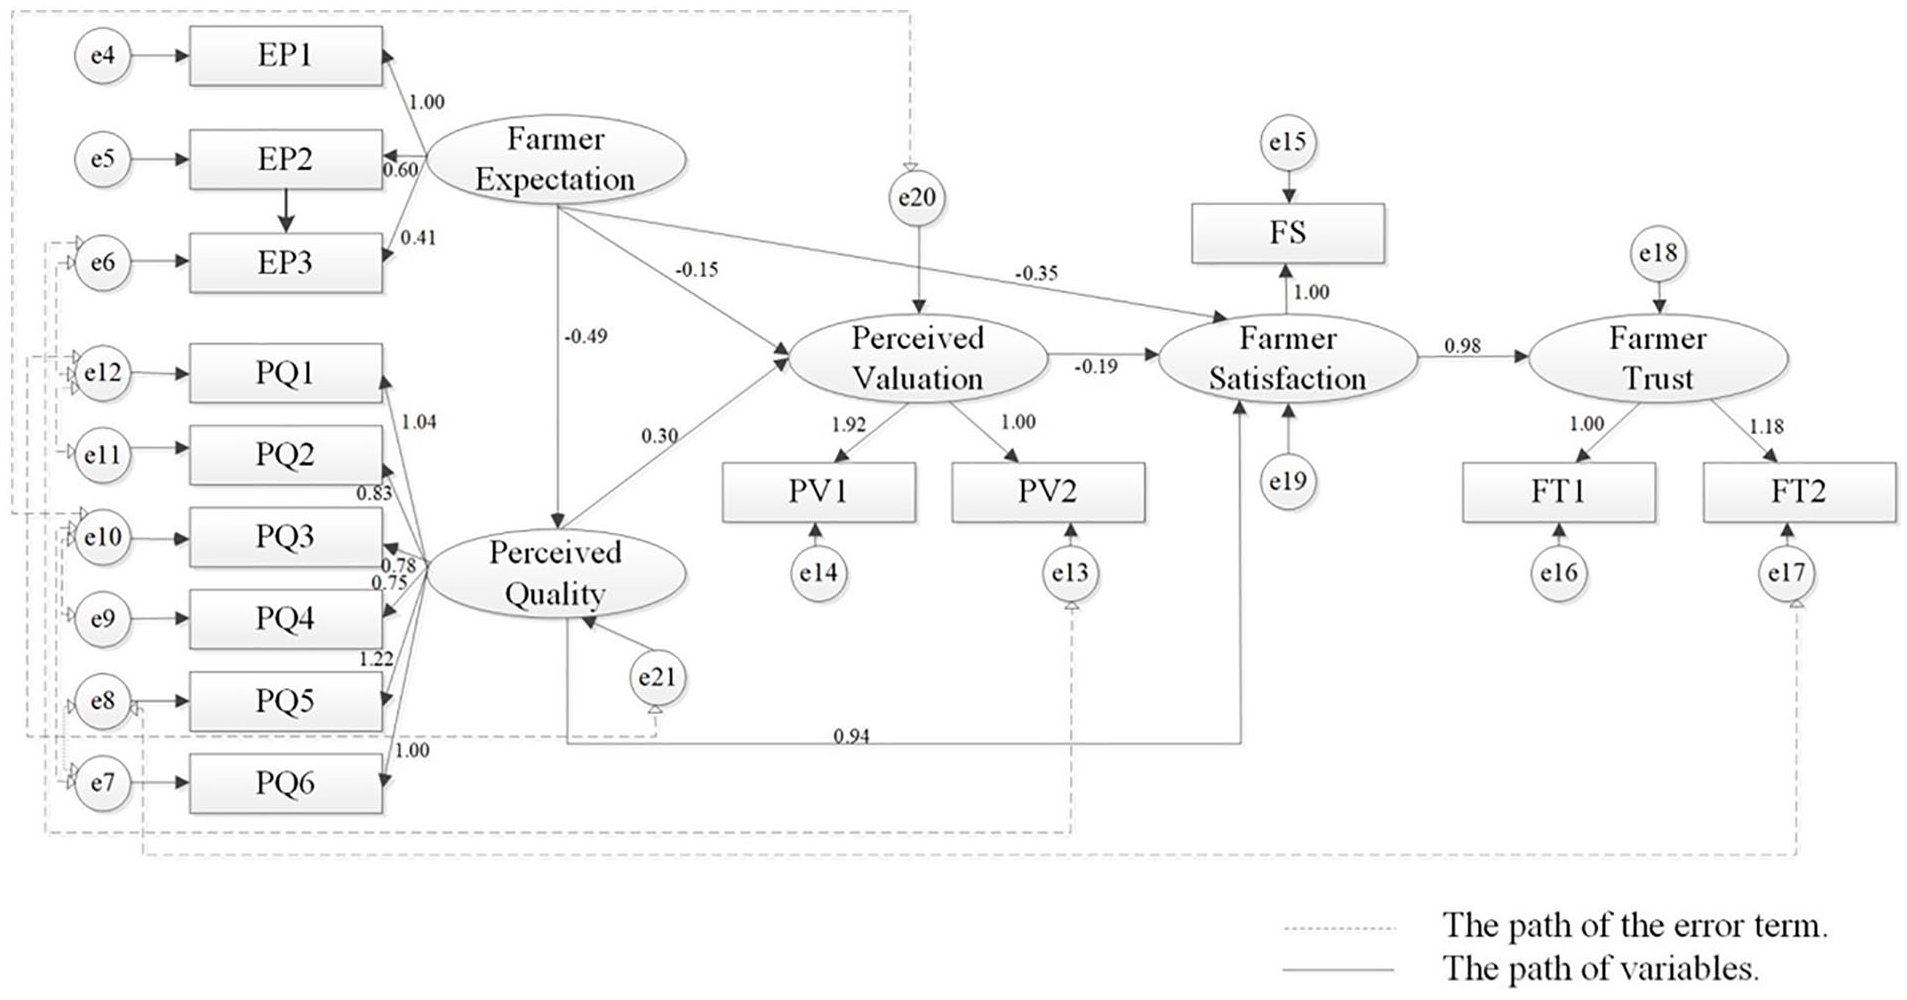
Non-normalized path coefficient of the improved structural equation model.
Index of Questionnaire Data and the SEM Model.
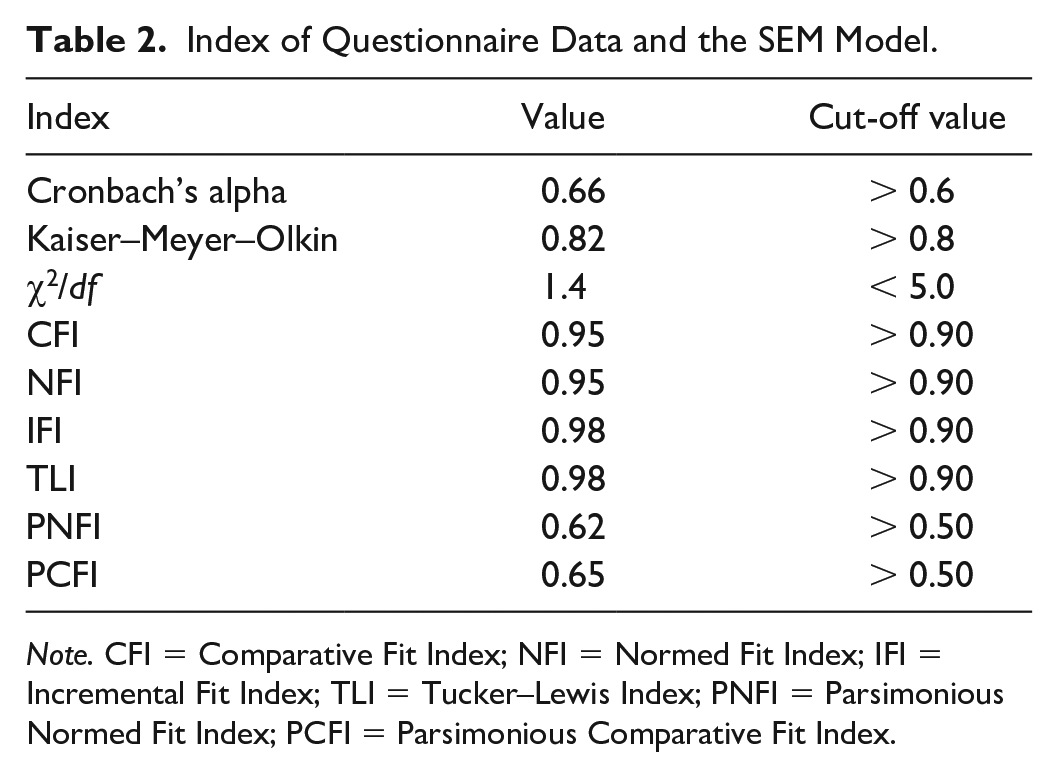
Note. CFI = Comparative Fit Index; NFI = Normed Fit Index; IFI = Incremental Fit Index; TLI = Tucker–Lewis Index; PNFI = Parsimonious Normed Fit Index; PCFI = Parsimonious Comparative Fit Index.
Analysis of the Model Results
The estimated results and normalized path coefficients are shown in Figure 4. To analyze and explain the relationship between the variables in the model, we extracted the normalized path coefficients of the model in Table 3.
Estimation Results of the Structural Equation Model.
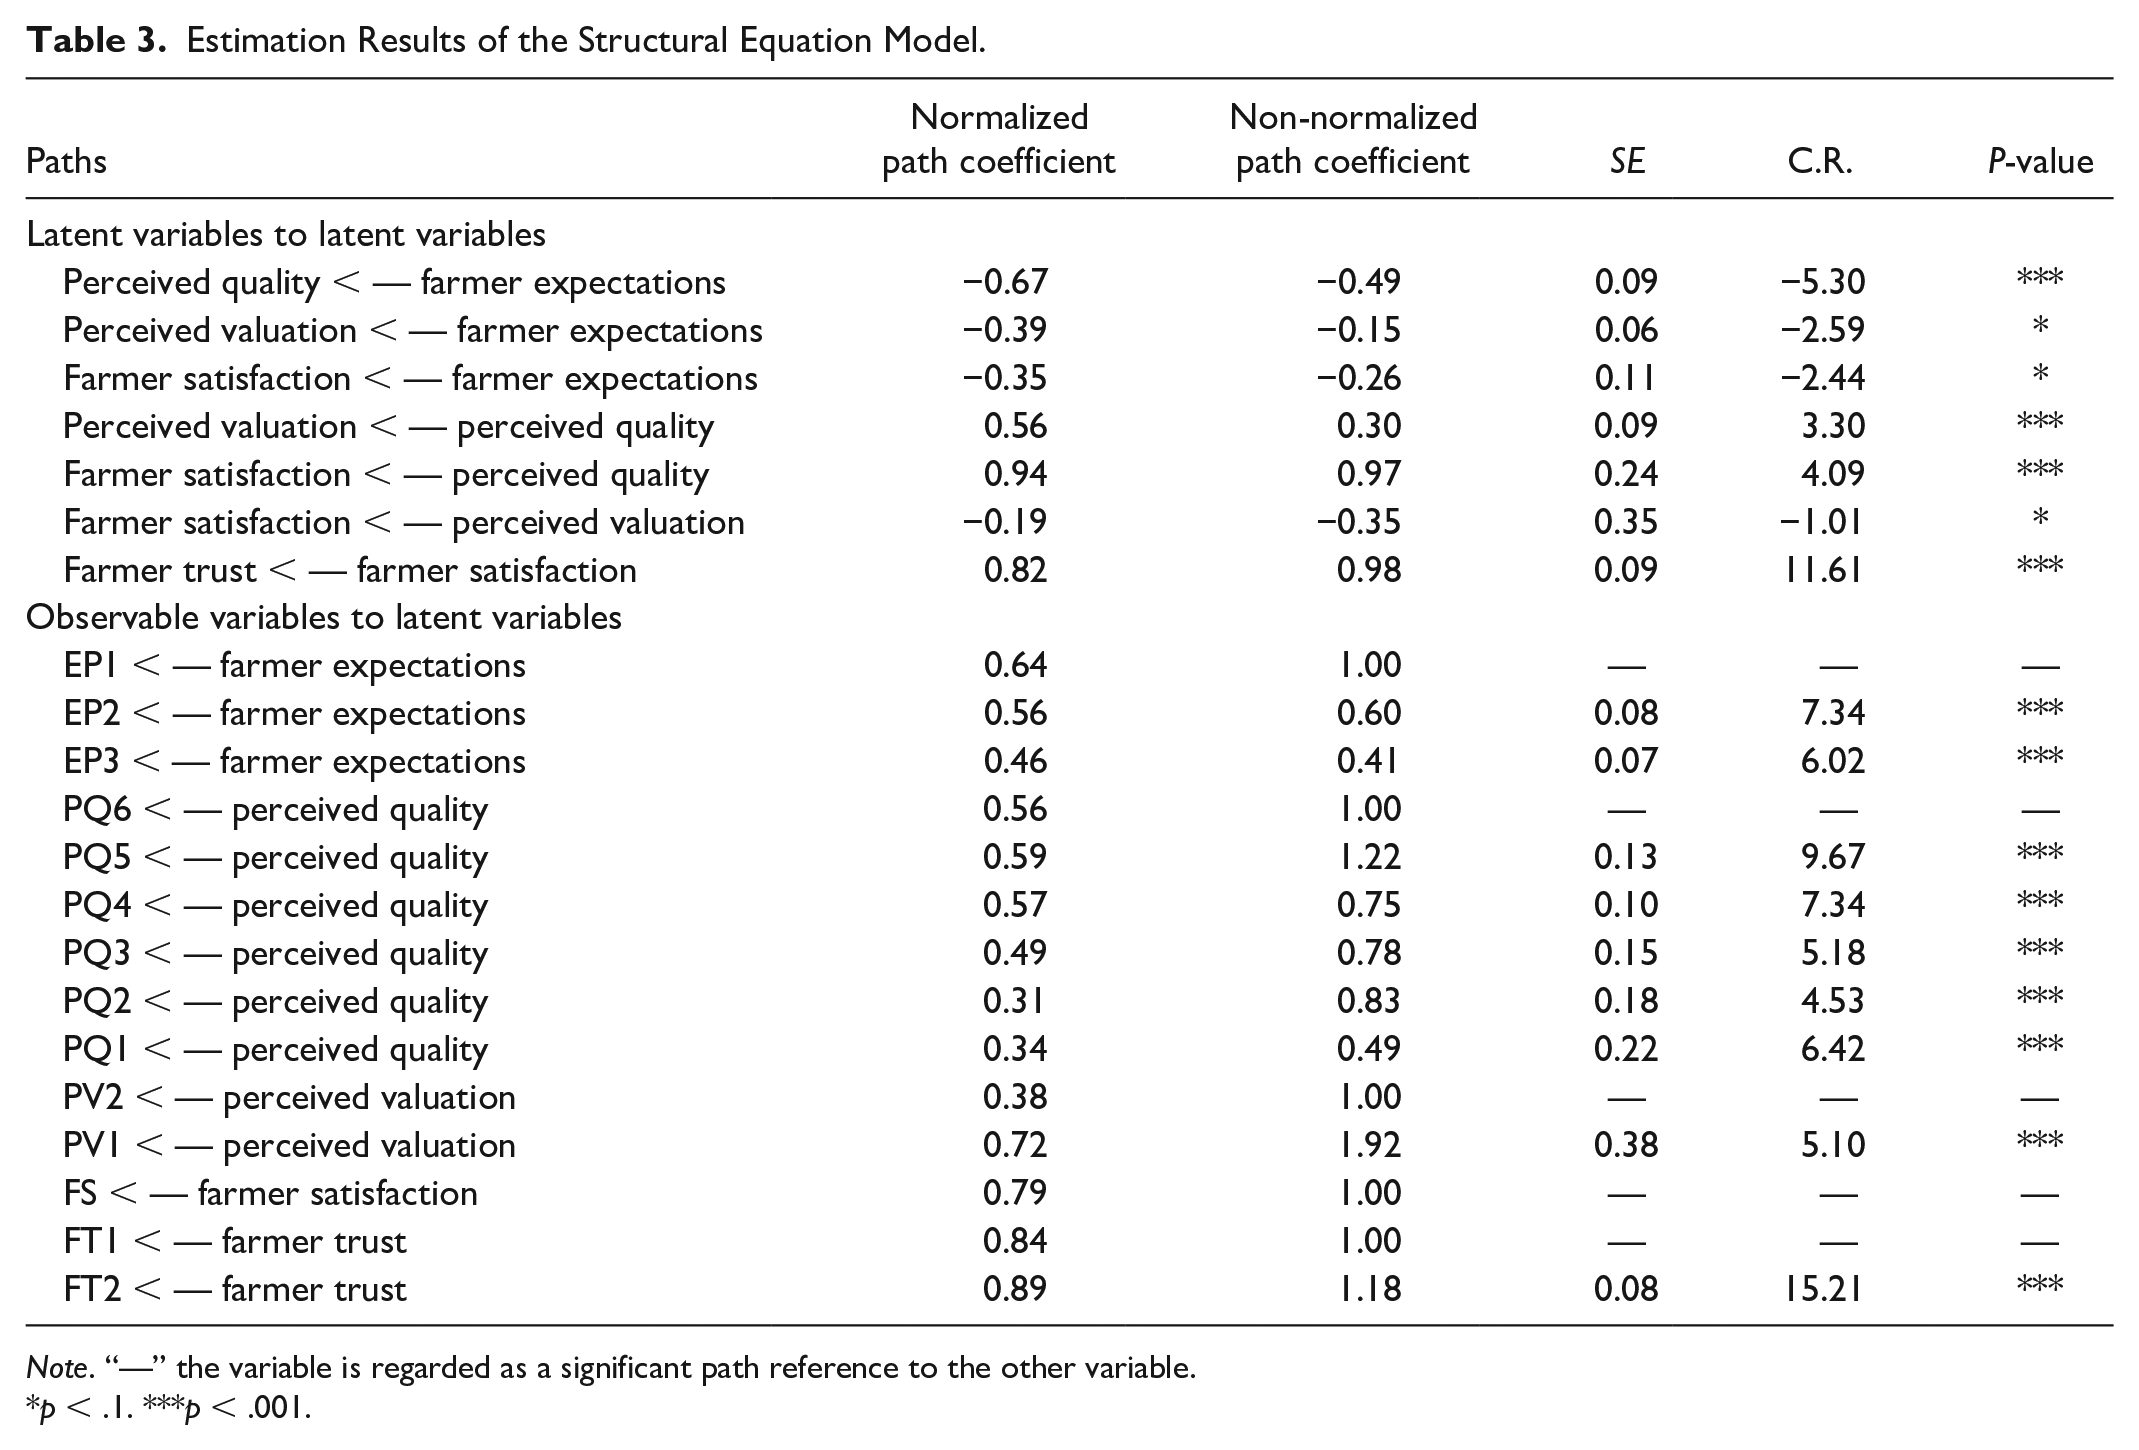
Note. “—” the variable is regarded as a significant path reference to the other variable.
p < .1. ***p < .001.
Latent variable path analysis
In combination with Table 3 and Figure 4, it can be determined that farmer expectations significantly affect perceived quality, perceived value, and farmer satisfaction, and the normalized path coefficients are −0.67, −0.39, and −0.35, respectively. This result reveals that higher farmer expectations of the Link Policy are often accompanied by lower perceived quality, lower perceived value, and poorer overall satisfaction. Farmer expectations have the most obvious influence on perceived quality (the path coefficient is −0.67) and passed the test at a significance level of 1%. These results strongly verify Hypothesis 1. The analysis results in Table 3 also show that the perceived quality of the Link Policy is significantly related to the perceived value and overall satisfaction of farmers. The significance level between both these variables is at a 1% level, which also means that there is a strongly significant correlation between them. For perceived quality and perceived value, the path coefficient between these variables is 0.56, which is less than the path coefficient between perceived quality and farmer satisfaction. The path coefficient between perceived quality and farmer satisfaction is as high as 0.94, which strongly reflects the conclusive role of perceived quality in farmer satisfaction. Thus, the better the farmers’ perceived quality of a policy, the higher their satisfaction. These results strongly validate Hypothesis 2 and are similar to the results of previous studies (Cheng et al., 2018; Zeng et al., 2016). These results also show that the correlation coefficient between perceived value and farmer satisfaction is negative, which indicates that perceived value does not play a key role in farmer satisfaction. However, the negative path coefficient of perceived value and farmer satisfaction (−0.19) indicates that a higher perceived value does not lead to an improvement of satisfaction, which rejects Hypothesis 4. These results indicate that farmers are not sensitive to indirect value comparisons after participating in the policy and that the satisfaction of farmers is still mainly affected by their intuitive policy feelings. However, the data results show that the path coefficient between perceived quality and perceived value is consistent with the direction proposed by Hypothesis 3. The path coefficient is 0.30, which means that a higher perceived quality is also accompanied by a higher perceived value. Finally, the model results show that the satisfaction of farmers has a significant positive effect on farmer trust. The coefficient is 0.82, which significant at a statistical level of 1%. This result also verifies Hypothesis 5, which means that the higher the farmers’ satisfaction is, the greater their trust in the government, and the more support they will give to the government’s follow-up policies.
Observed variable path analysis
The results show that the three observation variables that measure farmer expectations have significant effects on the latent variables of farmer expectations; the correlation coefficient is significant at a statistical level of 1%. Among these three variables, farmer expectations for a compensation fund (EP1) has the strongest impact on farmer expectations, and the coefficient is 0.64, which means that farmers pay more attention to the money they obtained from their compensation at this stage. The six observed variables of perceived quality (PQ1, PQ2, PQ3, PQ4, PQ5, and PQ6) all have a positive effect on farmers’ perceived quality, with a significance level of 1%. PQ5 and PQ6 have the largest path coefficient (0.59 and 0.56), which indicates that the farmers are more sensitive to equity through the implementation of the Link Policy. On the contrary, the correlation coefficient between the observation variables about the policy compensation method (PQ1 and PQ2) and farmers’ perceived quality is relatively low, which shows that farmers are not very concerned about what kind of compensation method the government adopts. The two observed variables of perceived value also have a significantly positive influence on perceived value. The path coefficients of PV1 and PV1 are 0.72 and 0.38, respectively, which means that farmers still mainly judge the participation decision-making of the Link Policy from the perspective of value perceptions. The two observed variables of farmer trust play a significantly positive role in explaining farmer trust, with path coefficients of 0.84 and 0.89 respectively, which indicates that the farmers’ confidence in the government and their support for the government are both essential factors affecting their trust in the government.
Direct and Indirect Effects
The direct effects among the latent variables are analyzed above. However, Figure 4 shows there were indirect paths between these latent variables. As demonstrated in Table 4, the total effect coefficient between farmer expectations and farmer satisfaction is −0.83, which is comprised of a small portion of direct effects (−0.35) and a large portion of indirect effects (−0.49). This result shows that the impact of farmer expectations on farmer satisfaction emerges from the transmission of indirect variables. Correspondingly, farmer expectations have indirect effects on perceived value, which results from the indirect effect of perceived quality. The direct effect of perceived quality on farmer satisfaction is as high as 0.94, but some of the positive effects are offset by the negative indirect effects, making the net total effect 0.84. This result further reflects that perceived quality will indirectly and negatively affect farmers’ satisfaction by influencing their perceived value.
Effect Decompositions of the Latent Variables.

Note. “—” represents no direct/indirect effect.
Conclusion
This article focus on the implementation effects of the Link Policy from the perspective of farmer satisfaction and its influencing factors, thereby building a satisfaction theory model based on the general consumer satisfaction model and putting forward relevant theoretical hypotheses. Subsequently, an empirical study was carried out using the SEM approach to verify these theoretical hypothesis based on a cross-sectional dataset surveyed in Chongqing city, China. The main conclusions and policy implications are as follows.
First of all, according to the survey data, the level of farmer satisfaction with the Link Policy is relatively high, and most of the respondents were satisfied with the existing policy. Furthermore, the empirical results show that farmer satisfaction, expectations, perceived quality, perceived value, and trust constitute a complete causal chain under the Link Policy. Farmer satisfaction with the Link Policy is the core of the whole causal chain and is affected by farmer expectations, perceived value, and perceived quality. Among the variables, perceived quality has the strongest impact on farmer satisfaction, and the total effect between these variables is as high as 0.84. This finding is consistent with related research that farmers are most sensitive to the quality of public services provided by the government, so fair and effective public policy design can effectively improve farmers’ satisfaction with such policies (Tong et al., 2016). For perceived quality, farmers are most concerned about the equity of their compensation, followed by compensation procedures and compensation methods. This finding has an important policy implication: Policy designers must prioritize the equity of public policy to ensure the effectiveness of policy implementation. As a Chinese proverb says, “what tortures people is inequality rather than scarcity.” This proverb underscores the importance of equity from ancient times to the present.
Second, in comparison with perceived quality, farmer expectations and perceived value have a negative impact on farmer satisfaction, with total effect coefficients of −0.35 and −0.19 respectively. This negative relationship confirms the theoretical hypothesis that the higher the farmers’ expectations are, the lower their satisfaction will be. In fact, the survey data show that farmers generally have high expectations for their compensation from the Link Policy; these expectations mainly come from the farmers’ unfamiliarity with the Link Policy. Therefore, the government should strengthen its propagation of the Link Policy and provide farmers with a more comprehensive and accurate understanding of the policy, which is essential for promoting the implementation of the policy and improving farmers’ satisfaction. On the contrary, the negative relationship between perceived value and farmer satisfaction refute the previous theoretical hypothesis, which means that the farmers do not determine their satisfaction with the policy based on indirect cost–benefit comparisons. This result further indicates that the government should pay more attention to improving the quality of their public services.
Third, there is a strong positive correlation between farmer satisfaction and farmer trust, which means that the higher the level of farmer satisfaction is, the more support they will give to the government. This result indicates the significance of the government in paying attention to farmers’ satisfaction under the Link Policy. Similarly, this result also provides suggestions for other public policies involving farmers. Farmer satisfaction is the key to the success of this policy, and improving the quality of services is particularly important.
Discussion and Policy Recommendations
The Link Policy not only provides an innovation of land management system in China, but also adds a new reference to solve land issues between urban and rural area in other country. Compared with previous studies (Haldrup, 2015; Lisec et al., 2014; Luo & Timothy, 2017; Q. Y. Wang et al., 2014), the main contribution of this study is its construction of a farmer satisfaction model under the Link Policy based on a general theoretical model of consumer satisfaction. Specifically, we investigated the implementation effects on the Link Policy from the micro perspective of farmer satisfaction and explored the key factors affecting farmer satisfaction constructed from household survey.
Based on the findings of this study, we provide policy recommendations to enhance farmer satisfaction to the Link policy in future. First, policy designers must prioritize the equity of public policy to ensure the effectiveness of policy implementation. Second, the government should strengthen its propagation of the Link Policy and provide farmers with a more comprehensive and accurate understanding of the policy, which is essential for promoting the implementation of the policy and improving farmers’ satisfaction. Third, farmer satisfaction is the key to the success of this policy, and improving the quality of services is particularly important.
It should be noted that there are differences between the services provided by enterprises and the government, which means that the satisfaction model under the Link Policy may not be completely consistent with the general consumer satisfaction model. For future research, we explore the integration of variables such as the individual characteristics of farmers into the satisfaction model to make the theoretical model more suitable for the Link Policy.
Footnotes
Author Contributions
Conceptualization, H.G. and Y.L.; formal analysis, Y.L.; funding acquisition, R.X.; data curation, Q.F.; methodology, Q.W.; writing—review and editing, H.G. and Y.L.
Declaration of Conflicting Interests
The author(s) declared no potential conflicts of interest with respect to the research, authorship, and/or publication of this article.
Funding
The author(s) disclosed receipt of the following financial support for the research, authorship, and/or publication of this article: This research was funded by the National Natural Science Foundation of China (Grant No. 71603171), the China Postdoctoral Science Foundation (Grant Nos 2020T130433 and 2018M631824), the Liaoning Province Social Science Foundation (Grant No. L19CGL009) and the Scientific Research Foundation of Liaoning Province (Grant No.WSNZK202002).