
Abstract
This study explores the influence of forecasted earnings to price ratio (E/P) and ROE to explain the part of the variation in the Shanghai Stock Exchange (SSE) returns. The study analyzed the explanatory capacity of fundamental, risk, and combined valuation approaches variables on comparative mode between static and dynamic models with the induction of un-balanced panel data estimation. A linear dynamic panel technique is being undertaken to forecast the variables. The research findings indicate that the forecasted E/P ratio and ROE significantly explain the variation in SSE stock return and remain highly statistically significant after incorporating risk proxy variables. Moreover, the author also confirms the existence of size, momentum, liquidity, and dividend yield in the Shanghai Stock Exchange. The study introduces the fundamental valuation approach to the Chinese market based on its unique features and designs a log-linear model, which comprises forecasted E/P and ROE in addition to current E/P as an estimator for future stock returns. The incorporation of Driscoll and Kraay standard errors (DKSE) and Panel Corrected standard error (PCSE) under static while difference and system GMM under the scope of dynamic panel estimation is considered to be another contribution of the study.
Introduction
Modern Finance theory is constituted by the vital contribution of asset pricing models and efficient market hypothesis. Despite considerable inquisitiveness regarding the asset pricing model’s assumptions, it is more important to consider their theoretical and empirical contribution to the rapid growth of the field of finance. Significant contribution in the field of empirical assets pricing was introduced by Sharpe (1963, 1964), Lintner (1965), and Black (1972) by developing a capital asset pricing model (CAPM), which is a single-factor model and helps to describe the relationship between systematic risk and return. The usefulness of CAPM is considered inadequate for a financial decision due to the theory hypothesis’s simplification and its ability to quantify and price the security risk. Well-known former studies such as Stattman (1980), Banz (1981), and Chan et al. (1991) found cross-sectional return movements inconsistent with the capital assets pricing model (CAPM). The capital asset pricing model is named a capital market anomaly due to its inconsistency with the latter studies’ finding and inadequacies in the empirical asset pricing model. Fama and French (1992, 1993) a considerable contribution is the exponents of this approach and develops the three-factor model by using financial indicators such as beta, size, and value of firm formalized through a book to market, earnings to price, an asset to market and cash flow to prices. Carhart (1997) presented a four-factor model with the inclusion of momentum into a three-factor model and explored the strategy that induces to buy a stock that has a positive historical return (win situation) and sell the stock which has a negative historical return (loss situation) and provide significant positive returns. Fama and French (2015) introduced the five-factor model with profitability and investment into a three-factor model and founded more reliable and authenticated to capture the stock return variation for US stocks.
Berk (1995, 1997) developed the Fundamental valuation (FV) perspective and documented that book to market (BM) as a value proxy to be a more consistent variable than size to explain stock returns variations. He hypothesized that book to market tend to have superior predictive power compared to size if BM leads as a reasonable measure for future profit prediction, which was later validated (Fama & French, 2015, 2017). Clubb and Naffi (2007) incorporated the fundamental valuation method to assume that firms’ stocks are rationally valued and explained that it is different from the risk factor approach based on the non-existence of the relationship between firm financial indicators and risk. Besides, Clubb and Naffi (2007) and Cordeiro da Cunha Araújo and André Veras Machado (2018) extended the FV approach with the inclusion of BM as a value component and demonstrated that the explanatory power of a BM ratio could be enhanced with the addition of forecasted book to market ratio (FBM) and forecasted return on equity ratio (FROE) as an additional variable for the UK and Brazilian stocks, respectively. They concluded that the content linking ROE, stock return, and changes in book to market ratio implies that expected stock return can be described by comparing expected ROE and expected change in the book to market ratio during the period.
Even after having a shortage of operation history for the Chinese market with the establishment of the Shanghai Stock Exchange (SSE) and the Shenzhen Stock Exchange (SZSE) in 1990 with the initial listing of 8 and 6 stocks, respectively, it becomes the world’s second largest stock market based on market capitalization and helps to finance an economy. Hu et al. (2019) documented that Chinese stock market regulations are quite different from the United States and the world’s other developed and developing economies. They acknowledged that it is treated as an order-driven market, strict initial public offering (IPO) process, the dominance of individual investors, invest only in “A” type of stocks, asymmetric information prevails in market and decision regarding the size of market done by the government. Few pieces of research considered earning to price (E/P) ratio as value measure due to unique market features and findings were diverse such as Cakici et al. (2017), Hsu et al. (2018), Zhang et al. (2018), and Jianan Liu et al. (2019) documented a significant effect while Hu et al. (2019) and Chen et al. (2010) reported an insignificant presence of value measure. Zhang et al. (2018) and Jianan Liu et al. (2019) explored that the E/P ratio as a value measure is a better and comprehensive proxy to represent the Chinese stock market due to the mentioned unique features compared to the world’s other stock markets.
The preceding work provides evidence that the predictability power of E/P as a superior component of value measure and FROE to explain the stock variation in SSE has been ignored, based on the non-existence of the relationship between firm financial indicators and its risk. The former work studied in this section Clubb and Naffi (2007) recommended that the relevance of Book to market and return on equity explain the stock variation incorporated either as a fundamental valuation approach or multidimensional risk perspective. Based on this observation, the current study makes three contributions to the literature. First, this article makes an extension in the fundamental valuation perspective by replacing BM with E/P along with forecasted earning to price (FEP) because of the unique features of the Chinese equity market. Second, this study considered both fundamental and risk valuation approaches with E/P, FEP, and FROE to explain the part of the variation in the SSE market. Third, this study contributes to statistical analysis with the incorporation of Driscoll and Kraay standard errors (DKSE), and Panel Corrected standard error (PCSE) under static while difference and system GMM under the scope of dynamic panel estimation to examine the cross-sectional variation for the SSE market.
Eventually, the fundamental approach variables (E/P, FEP, and FROE) have been estimated and analyzed for consistency through robustness tests, in which the variables of fundamental and risk valuation approaches have been combined, respectively. Traditional pricing models have been considered to explain variations in SSE market return and the formation of the following variables: beta, size, E/P (instead of the traditional use of BM for value component), momentum dividend yield, and liquidity. This work hopes to have more definitive empirical findings to consistently explain the Chinese stock market return variation by taking advantage of a comprehensive/ complete (WIND) database.
The remaining portion of this study proceeds in the following pattern. Section “Literature Review and Hypothesis Development” intends to discuss the literature review and developed the hypothesis, which helps the author design a fundamental analysis. Section “Methodology and Design of Research” refers to the methodology and design of research based on population and sample, data sources, variable description, model description, and data analysis technique. Section “Result and Discussion” discusses results and discussion, while section “Conclusion and Recommendations” includes the conclusion and recommendation. Section “Limitations and Future Study Direction” discusses the limitations and defines the direction for future studies.
Literature Review and Hypothesis Development
The seminal work of Fama and French (1992) is considered a significant and influential contribution in empirical asset pricing models, efficient market hypothesis, and market anomalies. Their findings prove that the firm value (BM) estimator explains stock return variations in a much better way than the size and systematic beta estimates and stimulates various discussions on the importance of accounting and financial indices as an estimator of stock market returns. Berk (1995, 1997) developed the fundamental valuation approach based on size and book to market and revealed the superior explanatory power of the book to market because of the relevance of expected future cash flow with a market value of equity. He undertakes the relationship between the BM ratio and expected returns due to the estimation of BM as a proxy for the expected cash flows, referring to an omitted term in the relationship between the required rate of return and market value of the security as demonstrated by (Fama & French, 1992). Fama and French (2012) argued that stock’s fundamental performance might be measured through a change in book rate of return, change in the log of accounting returns, and change in the log of revenue in the relevance of BM and size factor in stock returns.
Clubb and Naffi (2007) extended the FV perspective of Berk (1995, 1997) for UK stocks with the inclusion of book to market and the forecasted value of the book to market and return on equity to explain the stock return variation. They documented that the addition of forecasted return on equity (in addition to BM) control cross-sectional firm variation in current BM, which will be caused by differences in expectations of short-term fundamental analysis for the UK market returns. Moreover, Cordeiro da Cunha Araújo and André Veras Machado (2018) replicate the work of Clubb and Naffi (2007) on the Brazil stock market and find that BM under the FV perspective was insignificant to explain the stock variation in the Brazilian market but become statistically significant while combining with risk proxy variable under combine valuation approach. They also ratify that BM and its predicted variable are more valuable to control stock return variation.
Cakici et al. (2017) empirically investigate the predictability of stock return in china along with the consideration of cross-sectional Fama–MacBeth regression. This study was limited to “A” type of shares and concluded a robust predictive power of earning to price (E/P) ratio based on cross-sectional and portfolio regression results. Zhang et al. (2018) developed a modified version of Carhart’s four-factor model for Chinese stock by replacing book to market ratio with earning to price ratio (E/P) and momentum strategy with reversal effect. Furthermore, they mentioned that earning to price is a better proxy to explain the firm’s value compared to book to the market for the Chinese stock market due to its unique features that were later endorsed by (Carpenter et al., 2021). Jianan Liu et al. (2019) design a CH-3 factor model (replication of FF-3 factor model with Chinese market properties) with the consideration of earning to price (E/P) instead of a book to market (BM) for the calculation of firm value and compare its findings with FF-3-factor model. Visible dominance of the CH-3-factor model has been observed by the researcher with the concluding remarks that FF-3 cannot price CH-3 in terms of value and size, which have FF-3 factor model (significant) annual alphas of 16.7% and 5.6%, respectively, while, presence of forecasted earnings to price (FEP) also being ignored in this study. The superiority of the E/P as a value component is being documented in China for two reasons. First, Fama and French (1992) elaborated that E/P subsumes another value measure such as (BM, AM, and CP) to explain the average stock returns with the inclusion of cross-sectional regression. Second, the CH-3 factor model suggested by Jianan Liu et al. (2019) demonstrates the superiority of the E/P ratio as a value measure for Chinese stock returns instead of the traditional valuation model (FF-3 factor model). The reviewed literature provides a rationale to induct an E/P as a value measure instead of BM under the fundamental valuation approach to explain the stock return variation in the SSE market, which has been ignored previously.
Jing Liu et al. (2002) empirically investigate value drivers’ valuation characteristics based on a fundamental approach that demonstrates the direct relationship between prices and earnings to price drivers for the U.S. firms from the same industries. They documented that forecasted earnings based on a multivariate approach efficiently explain stock return variation for most of the sample. As far as relative performance is concerned, they confirm the superiority of forecasted earnings concerning historical earnings, book value, and cash flow measure. Yee (2004) compared forward and trailing earnings to price to evaluate U.S. equity markets’ stock returns. His findings help develop the two conceptual backgrounds, such as having an accurate value of forecasted earning leads to mandate less accrual accounting than earning value based on historical performances. The other finding discusses the significant role of forward earning to price ratio to explain stock return variation and more helpful compared to trailing earnings to price.
Wu (2014) investigate the association of forecasted earnings to price (FEP) ratio with the growth in equity return based on risk prevail in each FEP portfolio. They documented a positive relationship between FEP and earnings growth on a shorter horizon while finding a negative association on the longer horizon. Moreover, they demonstrate that forward earning to price was exclusively efficient instead of trailing E/P from a growth perspective. Baird et al. (2020) incorporated the residual income valuation model to determine the influence of earning to price and its predictability for cross-section variation in U.S. data. They documented a strong impact of predicted E/P on equity investment because of both realized and predicted information. The existing literature helps us to use the forecasted earnings to price (FEP) under the Chinese market’s fundamental valuation approach, which serves as another contribution of this study.
Frankel and Lee (1998) incorporated the U.S. data and provide evidence of a variable for predicting earning to price ratio. This variable, which incorporates market analysts’ forecasts, had greater explanatory power than the realized value because it incorporated both past and present information. They documented a book value as a proxy measure for expected future cash flow. They mentioned that firm’s return on equity (ROE) should be equal to the weighted average cost of capital (opportunity cost) in a competitive equilibrium. These findings provide a rationale for an inverse association between BM and ROE, which was later endorsed by Lee and Zhang (2014) with Chinese market data. Clubb and Naffi (2007) investigate the role of forecasted return on equity to explain the variation in the U.K. stock market return under the fundamental valuation (FV) approach. They mentioned that the features connecting stock return with ROE and BM demonstrate that stock return variation can be observed with the inclusion of forecasted return on equity (FROE) and forecasted book to market ratio. Skogsvik and Skogsvik (2010) examine the different patterns to access how publicly available information helps investors make abnormal earnings. They inducted a probabilistic base model to forecast the medium-term book ROE and estimated FROE changes through the residual income valuation model and stock price variation. They find that optimistic market return bias contributed to abnormal returns because the positive return on equity (ROE) surprises refer to a substantial price reaction compared to negative ROE. Moreover, they confirm the significant presence of FROE to explain the variation in Swedish Stock Market returns.
Li et al. (2007) examine the importance of ROE to explain the part of the variation in Chinese stock market return and find insignificant effect while, Guo et al. (2017) replicate the Fame-French five-factor model in the Chinese market and used ROE factor as a proxy for profitability, and they find a significant role of ROE for explaining the stock return. Hu et al. (2019) and Jianan Liu et al. (2019) also find a positive and significant ROE presence to address the Chinese equity market variation. Cordeiro da Cunha Araújo and André Veras Machado (2018) documented evidence through literature reviewed that the importance of forecasted return on equity (FROE) to predict the Chinese stock market returns was still undiscovered, leading to another prominent contribution in this study.
Clubb and Naffi (2007) introduce aggregate predicted variable (FRM) with the combination of current book to market ratio (BM), the forecasted book to market ratio (FBM), and forecasted return on equity (FROE) to investigate its explanatory power for U.K. stock returns instead of having the individual effect of each variable. They used fundamental, risk, and combine approaches to explain stock return variation based on FRM. They documented a positive and significant presence of FRM to explain the stock returns beyond an extensive series of variables widely observed as proxies for stock mispricing and magnitudes of equity risk. Cordeiro da Cunha Araújo and André Veras Machado (2018) replicate the concept of FRM to explore its impact to explain the part of the variation in the Brazilian stock market return. They documented that FRM shows a significant association with stock return under the FV approach, but its explanatory power was being enhanced with risk proxy variables. Existing literature enables us to mention that FRM still needs to discover in the Chinese market to explain the variation in returns. Therefore, the author modifies the original equation proposed by Clubb and Naffi (2007) as (FRM = BM − FBM + FROE) into (FRM = EP − FEP + FROE) based on unique features of the Chinese equity market, which refers to another noticeable contribution in this study.
Methodology and Design of Research
Population and Sample
The current study sample covered all the non-financial listed firms at the Shanghai Stock Exchange (SSE) from January 1, 2000, to December 31, 2018. Post- 2000 period is considered in this study due to two main explanations. Such as first related to shorter history and other as uniformity and standardization of accounting data. The rules and regulations required to prepare and report the financial data did not implement in the Chinese equity market until 1999. Moreover, this study only focused on A type of shares of listed companies because the general public in China is not allowed to invest in non-floating, B, and H types of shares except A type of floating shares.
Some basic filters have been used to uphold the exactness of financial data. Based on that, this study dropped all listed financial firms because of two main reasons. According to Fama and French (1992), their high leverage may distort the firm value results and do not provide meaningful implications for the high leverage of non-financial firms. The second consideration demonstrates that capital structure stands different for financial and non-financial firms. To have a forecasted model for each variable, data from EPt-1 and ROEt-1 variables for all selected firms have been an encounter for 1999–2017. Furthermore, a model suggested by Arellano and Bond (1991) will forecast each firm based on year t−1, annually. Thus, the study’s final sample range from 497 to 805 stocks for 19 years by having unbalanced panel data in nature and leads to 14,018 observations.
Data Sources
This study has been taken the data from WIND and considers the most prominent and reliable financial/economic data facilitator in China; 75% of the Qualified Foreign Institutional Investors and 90% of Chinese financial institutions operating in China serve through WIND data facilities. Data from this database lead to reliability, accuracy, and transparency in results, as mentioned by Jianan Liu et al. (2019).
Variables Description
Table 1 concludes the procedures adopted to calculate the study variables to check out the cross-sectional variation on the Shanghai Stock Exchange (SSE) returns.
Variable Description.
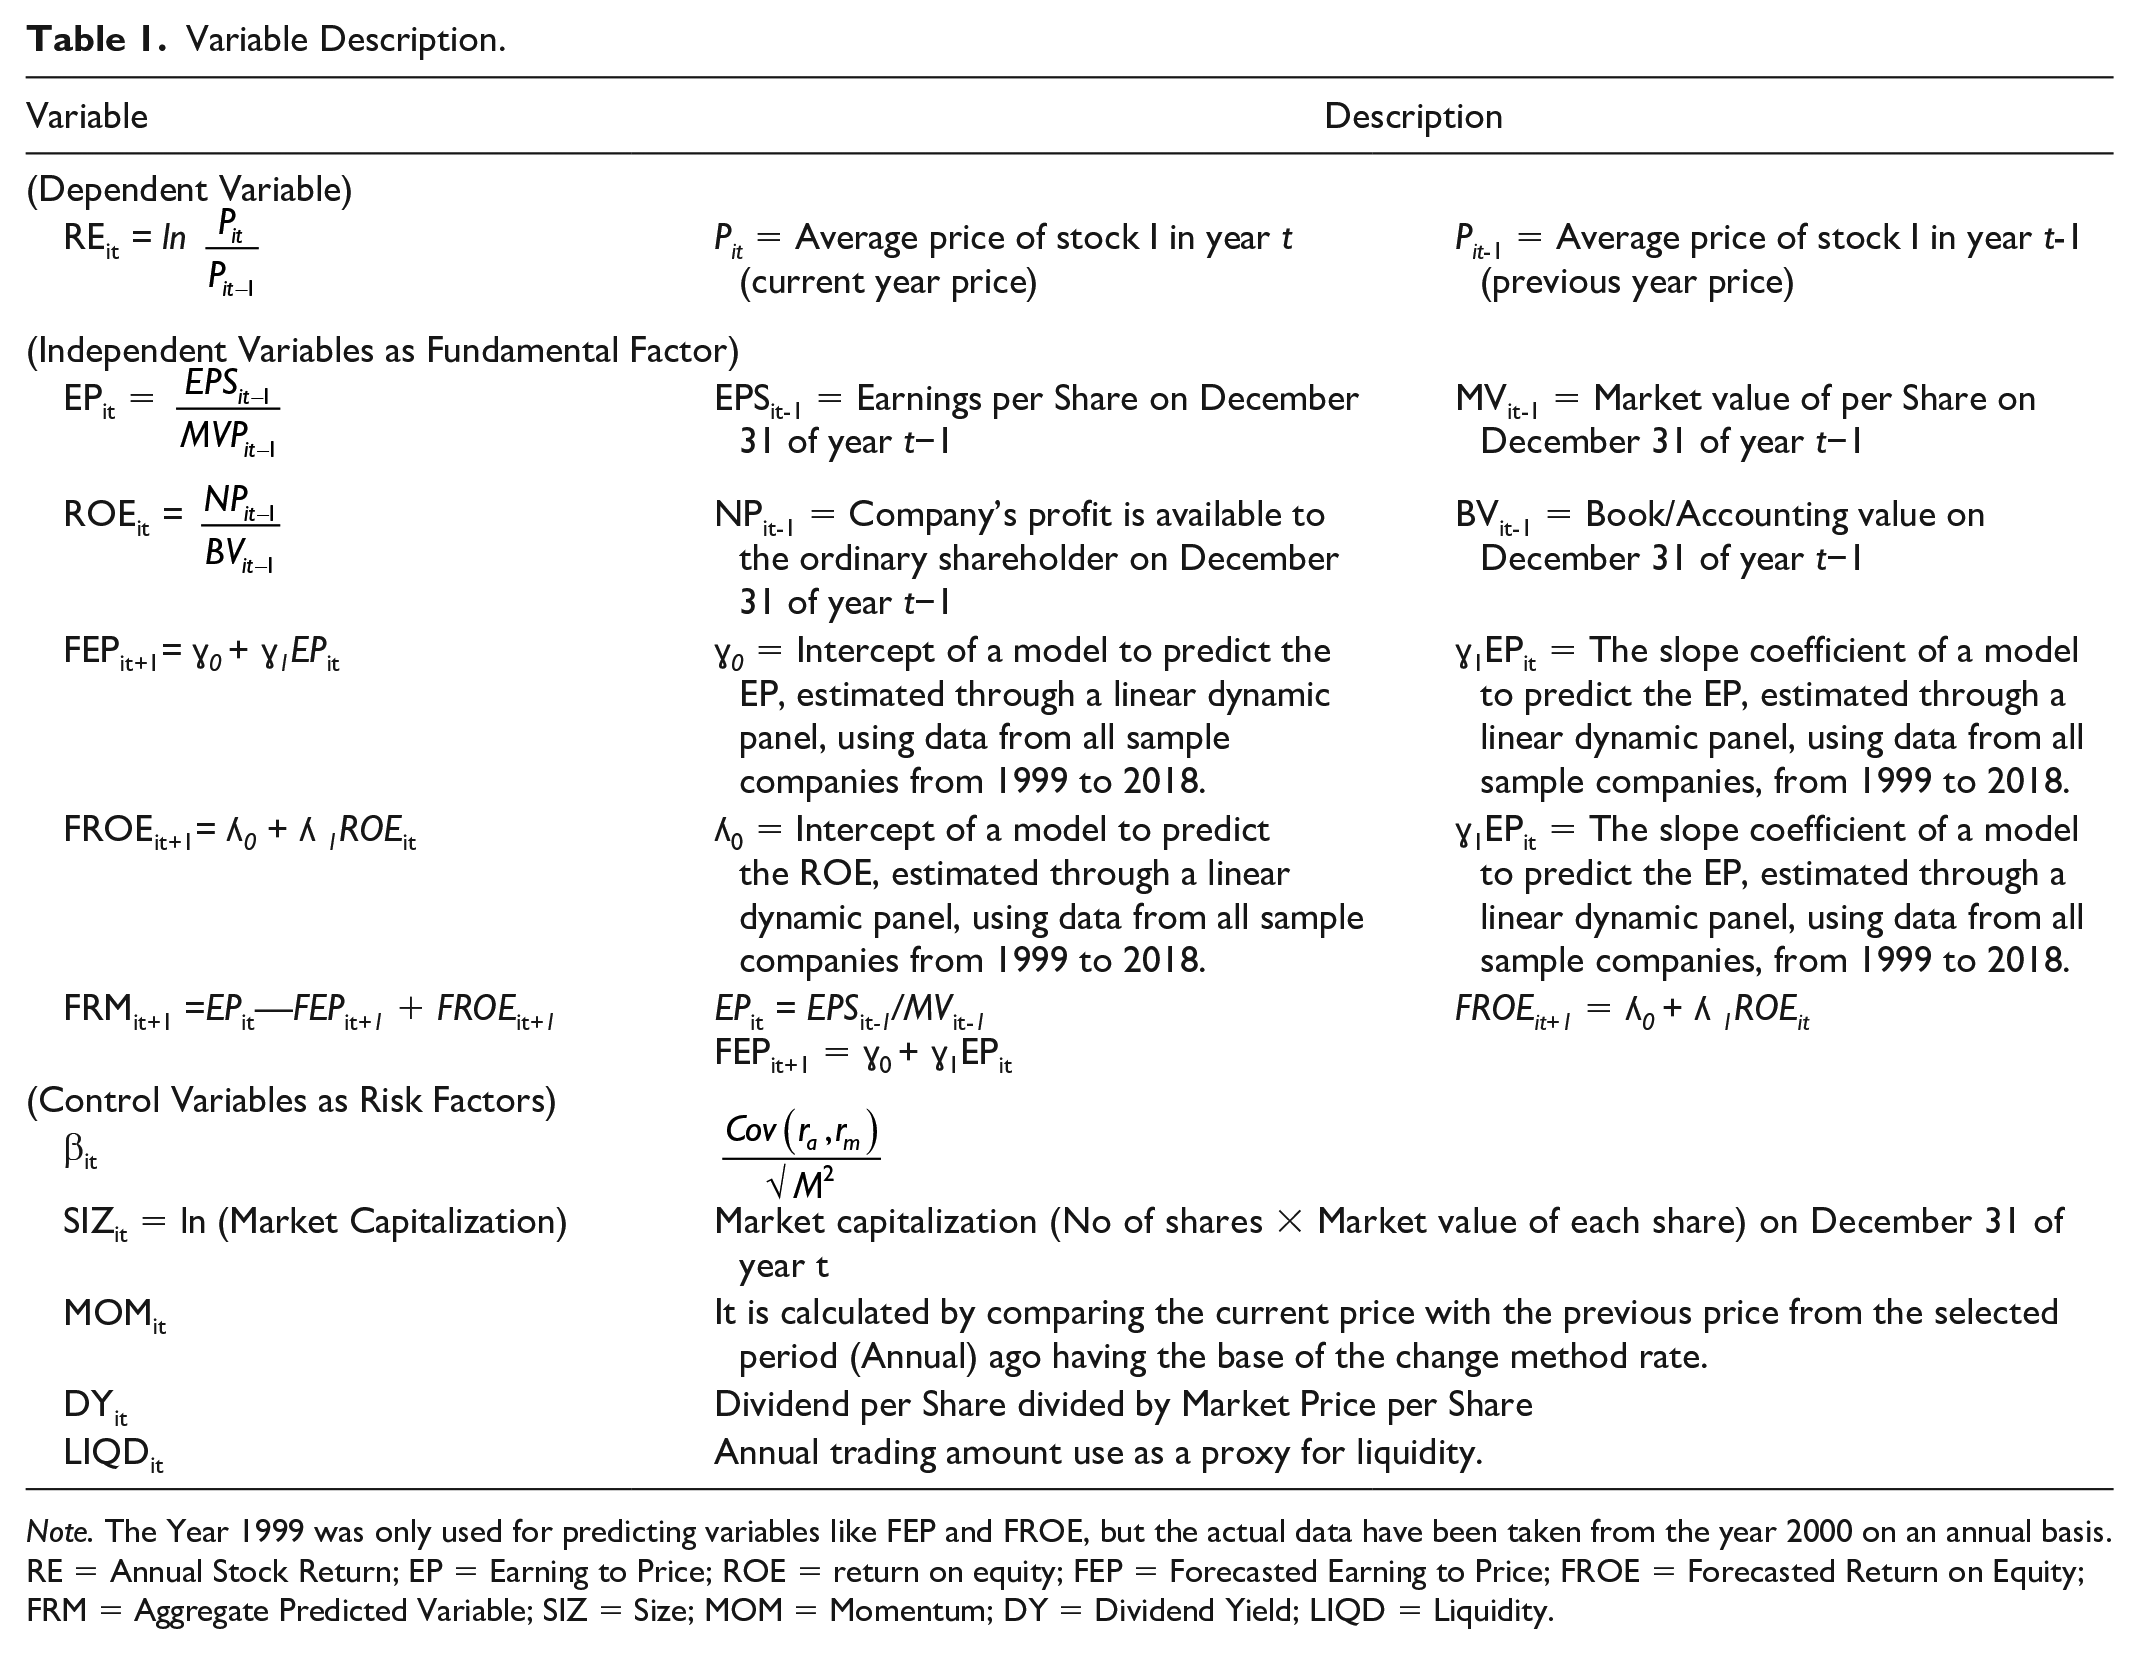
Note. The Year 1999 was only used for predicting variables like FEP and FROE, but the actual data have been taken from the year 2000 on an annual basis. RE = Annual Stock Return; EP = Earning to Price; ROE = return on equity; FEP = Forecasted Earning to Price; FROE = Forecasted Return on Equity; FRM = Aggregate Predicted Variable; SIZ = Size; MOM = Momentum; DY = Dividend Yield; LIQD = Liquidity.
Model Description
As shown in Table 2, fundamental valuation approaches encounter to regressed two models (Model 1 and 2), while (Model 3) was estimated based on the risk valuation approach. The core theme is to determine the limit to which the variables of fundamental and risk valuation approaches are helpful and provide the benchmark to explain the part of the variation in cross-sectional return in the SSE market. Moreover, this study explores how both approaches’ explanatory power might be compensated and enhanced simultaneously by putting into the joint valuation based on (Model 4 and 5). Both static and dynamic panel data estimation techniques are considered and conclude that which approach has greater ability to explain the variation in SSE market return.
Estimation of Regression Models.
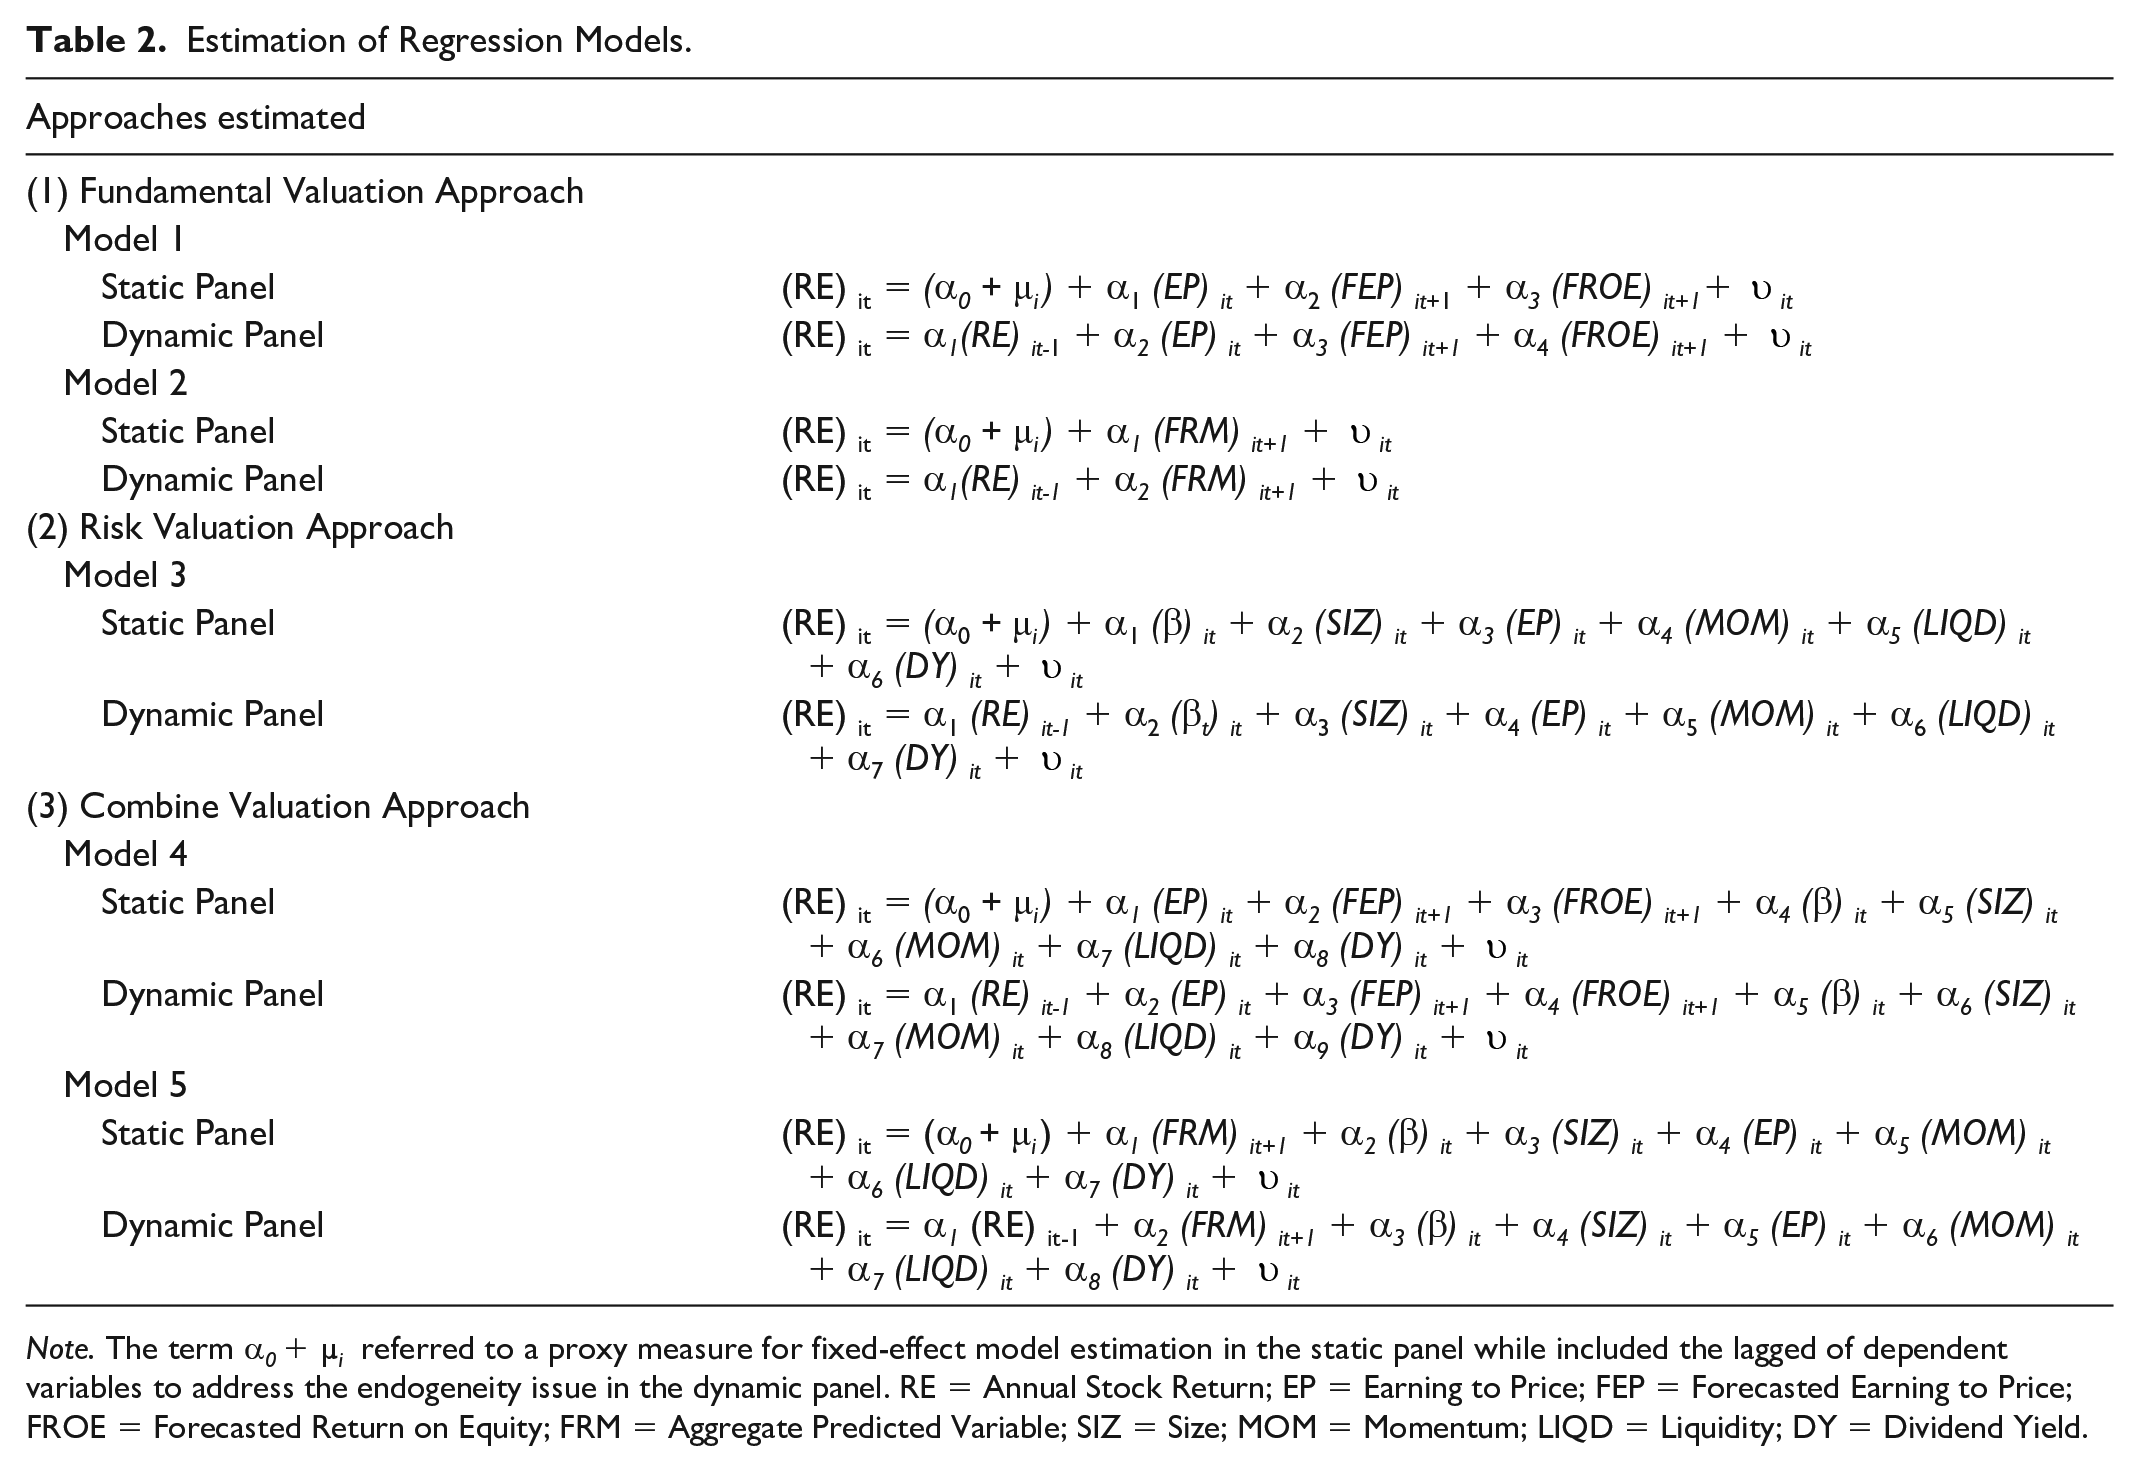
Note. The term α0 + µi referred to a proxy measure for fixed-effect model estimation in the static panel while included the lagged of dependent variables to address the endogeneity issue in the dynamic panel. RE = Annual Stock Return; EP = Earning to Price; FEP = Forecasted Earning to Price; FROE = Forecasted Return on Equity; FRM = Aggregate Predicted Variable; SIZ = Size; MOM = Momentum; LIQD = Liquidity; DY = Dividend Yield.
Data Analysis Techniques
This study analyzed the financial statements and stock market data of listed companies in the Shanghai Stock Exchange (SSE). An unbalanced panel data set was included in this study with many years and different cross-sections (Baltagi, 2008). This work included comparative base research by having static and dynamic panel data estimation. The static panel data estimation included fixed effect, random effect, or Pooled OLS by applying Hausman (1978) and Breusch and Pagan (1980) specification test and fixed effect have been selected in case of probability value less than 5%, otherwise move to random effect estimation technique. The GMM discourse the methodological issues relevant to dynamic panel data estimation and minimize the asymptotic variance with the induction of two population moment sets. Besides, as the number of cross-sections in the study is higher as compared to time dimension and data are unbalanced, so it has paved the way toward dynamic panel data estimations, which requires to include lagged dependent variable, which resulted in endogeneity issue as per the suggestions of Mileva (2007) and Das (2019). It provides an efficient estimation in the presence of serial correlation at first order and heteroscedasticity in the model. The System GMM was proposed as a superior estimation technique because it is more convenient to overcome the weak instrument’s issue by inducing an internal instrument to cope with endogeneity issues to yield unbiased and reliable findings (Verbeek, 2008).
For each model specified in all approaches, the t-test has been estimated to check the significance level of proposed variables on stock returns, and F-test was also estimated to observe the joint significance. Furthermore, model assumptions checked through different tests such as the Wald test (used for heteroscedasticity), Lagrange Multiplier test (used as a selection tool between pooled OLS and random effect estimation), Pesaran’s test (used for cross-sectional dependency), Variance Inflation factor test (used for multicollinearity) and Wooldridge test (used for autocorrelation). Several diagnostic tests have been accomplished as autocorrelation at first stage AR (1) should be significant but insignificant at second stage AR (2) to implement the GMM estimation (Baum, 2013; Baum et al., 2003). Second, the Hansen test is being used to deal with over-identification restrictions that instruments must not be correlated with the error term. Finally, the number of an instrument should be lower than groups.
Result and Discussion
Summary Statistics
Table 3 refers to summary statistics in the form of average, standard deviation, minimum and maximum values for each analyzed variable. The contribution of earning to price ratio is relatively low as .015 compared to other variables that refer to growth opportunities, suggested by (Fama & French, 1993). Forecasted return on equity contributed more in aggregate prediction with an average value of 2.42 instead of earning to price and its predicted value. Variation in stock momentum shows very high with a value of 6.34 and a low amount of contribution by .01. The trading amount was used as a proxy for liquidity and showed a significant contribution with an average of 17.16 and low variation.
Summary Statistics.

Note. The number of observation for all variables is 14,019 except DY (14,018) and LIQD (13,871). RE = Annual Stock Return; EP = Earning to Price; FEP = Forecasted Earning to Price; FROE = Forecasted Return on Equity; FRM = Aggregate Predicted Variable; Β = Beta; SIZ = Size; MOM = Momentum; DY = Dividend Yield; LIQD = Liquidity.
Correlation Analysis
As an initial stage, to know the relationship among one dependent variable, four independent, and five control variables, correlation analysis has been taken, shown through Table 4. A positive and highly significant relationship of earning to price with its forecasted variable exists with a coefficient value of 0.1333.
Correlation Analysis.

Note. Robust standard errors in parentheses (). RE = Annual Stock Return; EP = Earning to Price; FEP = Forecasted Earning to Price; FROE = Forecasted Return on Equity; FRM = Aggregate Predicted Variable; B = Beta; SIZ = Size; MOM = Momentum; DY = Dividend Yield; LIQD = Liquidity.
p < .1. **p < .05. ***p < .01.
Aggregate predicted variable (FRM) also showed a positive and significant association with fundamental valuation approach variables: (EP, FEP, and FROE) with coefficient values of 0.0259, 0.0444, and 1.000, respectively. Besides, fundamental valuation approach variables (EP, FEP, FROE, and FRM) have shown a positive and significant relation with stock return having a coefficient value of 0.0731, 0.0226, 0.0177, and 0.0178, respectively. The author has undertaken a variance inflation factor test (VIF) to investigate the multicollinearity presence in multivariate models for each explanatory variable. As Levine et al. (2000) define if VIF is equal to 1, there is no correlation between explanatory variables, but multicollinearity exists if the value exceeds 10. Results from Tables 5–9 showed individual and overall values for the VIF test and confirmed multicollinearity’s inexistence across all explanatory variables of the study. Collinearity inexistence refers to the consistency and reliable use of panel regression models and reduces the problems caused by multicollinearity.
Model 1—Fundamental Valuation Approach.

Note. The table shows regression results for fundamental approach variables base on static and dynamic estimation for comparison purposes. DKSE and PCSE applied in case of the significance of Pesaran’s and Wooldridge test to address the issues relevant to cross-sectional dependency and autocorrelation (Driscoll & Kraay, 1998; Hoechle, 2007; Torres-Reyna, 2007). VIF = variance inflation factor test; DKSE = Driscoll and Kraay standard errors; PCSE = Panel Corrected standard error; L.RE = lagged stock return; EP = Earning to Price; FEP = Forecasted Earning to Price; FROE = Forecasted Return on Equity.
p < .1. **p < .05. ***p < .01.
Model 2—Fundamental Valuation Approach.

Note. The table shows regression results for FRM base on static and dynamic estimation for comparison purposes. DKSE and PCSE applied in case of the significance of Pesaran’s and Wooldridge test to address the issues relevant to cross-sectional dependency and autocorrelation (Driscoll & Kraay, 1998; Hoechle, 2007; Torres-Reyna, 2007). VIF = variance inflation factor test; DKSE = Driscoll and Kraay standard errors; PCSE = Panel Corrected standard error; L.RE = lagged stock return; FRM = Aggregate Predicted Variable.
p < .1. **p < .05. ***p < .01.
Model 3—Risk Valuation Approach.

Note. The table shows the regression results for the risk valuation approach variable. DKSE and PCSE applied in case of the significance of Pesaran’s and Wooldridge test to address the issues relevant to cross-sectional dependency and autocorrelation (Driscoll & Kraay, 1998; Hoechle, 2007; Torres-Reyna, 2007). VIF = variance inflation factor test; DKSE = Driscoll and Kraay standard errors; PCSE = Panel Corrected standard error; L.RE = lagged stock return; SIZ = Size; EP = Earning to Price; MOM = Momentum; LIQD = Liquidity; DY = Dividend Yield.
p < .1. **p < .05. ***p < .01.
Model 4—Combined Valuation Approach.

Note. The table shows regression results by making a combination of (EP, FEP, FROE) with risk valuation approach variables. DKSE and PCSE applied in case of the significance of Pesaran’s and Wooldridge test (Driscoll & Kraay, 1998; Hoechle, 2007; Torres-Reyna, 2007). VIF = variance inflation factor test; DKSE = Driscoll and Kraay standard errors; PCSE = Panel Corrected standard error; L.RE = lagged stock return; EP = Earning to Price; FEP = Forecasted Earning to Price; FROE = Forecasted Return on Equity; SIZ = Size; MOM = Momentum; LIQD = Liquidity; DY = Dividend Yield.
p < .1. **p < .05. ***p < .01.
Model 5—Combined Valuation Approach.

Note. The table shows regression results by making a combination of FRM with risk valuation approach variables. DKSE and PCSE are used for fixed effect test assumptions. DKSE and PCSE applied in case of the significance of Pesaran’s and Wooldridge test to address the issues relevant to cross-sectional dependency and autocorrelation (Driscoll & Kraay, 1998; Hoechle, 2007; Torres-Reyna, 2007). VIF = variance inflation factor test; DKSE = Driscoll and Kraay standard errors; PCSE = Panel Corrected standard error; L.RE = lagged stock return; FRM = Aggregate Predicted Variable; SIZ = Size; EP = Earning to Price; MOM = Momentum; LIQD = Liquidity; DY = Dividend Yield.
p < .1. **p < .05. ***p < .01.
Panel Regression Results
This section aims to explore the ability of fundamental and risk valuation approach variables to explain the part of the variation in Shanghai Stock Exchange (SSE) returns and the inclusion of both static and dynamic panel techniques for comparison purposes. The First two models covered the fundamental valuation approach. In contrast, the third model enclosed the risk valuation approach, and the last two models explain the combination of fundamental and risk valuation approach by making it combine.
Fundamental Valuation Approach Models
Table 5 reports the estimation of the basic panel data model using a fundamental approach. The estimations include static as well as dynamic estimation for comparison and explanation purposes. The static panel indicates that the Hausman (1978) and Breusch and Pagan (1980) tests are significant at a 1% level with a value of 0.0001, which means that a fixed effect approach is a suitable option. Pesaran’s and Wooldridge test showed significant results, which paved the way to introduce the Driscoll and Kraay standard errors (DKSE) and Panel Corrected standard error (PCSE) in study to address the issues relevant to cross-sectional dependency and autocorrelation (Driscoll & Kraay, 1998; Hoechle, 2007; Torres-Reyna, 2007). Moreover, the significance of autocorrelation at first stage AR (1), insignificant at second stage AR(2), and insignificant of Sargan and Hansen test provide evidence to implement the GMM estimation (Roodman, 2009).
Model 1 developed the multivariate approach with the inclusion of E/P and the predictability of E/P and ROE. The positive coefficients of E/P were statistically significant at a 1% level in both static and dynamic approaches and were consistent with a theoretical framework (Zhang et al., 2018) and (Jianan Liu et al., 2019). However, a higher coefficient value of E/P (0.29) in sys-GMM compared to other static and dynamic approaches represents its aptitude for explaining the stock variation in a more precise manner. The predicted variable of earning to price (FEP) also shown a significant and positive association with SSE return at 5% level in case of static approaches (DKSE and PCSE) with the coefficient value of 0.41 and 0.42, respectively, while significant at 1% level with a coefficient value of 0.47 in case of sys-GMM. Forecasted return on equity (FROE) was aligned with the expected result, and its coefficient was significant at 1% level in all approaches but with the higher value (0.0007) in sys-GMM, which was following (Clubb & Naffi, 2007; Cordeiro da Cunha Araújo & André Veras Machado, 2018; Skogsvik & Skogsvik, 2010) conclusion. Besides, the coefficient of determination having 0.0058 was deficient compared to Clubb and Naffi (2007) findings, having R2 0.0932 and Cordeiro da Cunha Araújo and André Veras Machado (2018) 0.0287. The lagged stock return (L.RE) was also significant at a 1% level with a positive coefficient (0.04) to overcome the issue related to the weak instrument by inducing an internal instrument to cope with the endogeneity issue to yield unbiased and reliable findings (Verbeek, 2008).
The second model, univariate, covered the fundamental valuation approach to describes the association between stock return and aggregate predicted variable (FRM) suggested by (Clubb & Naffi, 2007). The author transforms the original equation suggested by Clubb and Naffi (2007) as (FRM = BM − FBM + FROE) into (FRM = EP − FEP + FROE). The rationale for the transformation is that E/P as a value measure is more reasonable and suitable due to the Chinese market framework and operation, referred by (Jianan Liu et al., 2019). Table 6 indicates that the Hausman (1978) test and Breusch and Pagan (1980) tests are significant at a 1% level, validating fixed effect estimations for Static Panel, likewise in the first model. The coefficient value for FRM in all approaches was observed significant at 1% level but having a higher positive coefficient in sys-GMM with 0.0031. The coefficient of determination (R2) for Model 2 was 0.0083, demonstrate a significant increment in comparison to Model 1, which follows the pattern, as defined by Clubb and Naffi (2007) for U.K. stock returns and Cordeiro da Cunha Araújo and André Veras Machado (2018) for Brazilian stock returns. The lagged dependent variable was also shown a consistent and significant association with the current stock return at 1% and validated the sys-GMM approach’s applicability.
As statistical approaches were a concern, the difference GMM consider being less informative because of increment of unobserved fixed effect and closeness of variable to random walk, which supports the fact that the system GMM technique gives a better estimate to overcome the biases (Antoniou et al., 2006; Eicher & Schreiber, 2010). The findings demonstrate that both multivariate and univariate models proposed by Clubb and Naffi (2007) are appropriate to explain the variation in Shanghai Stock Exchange (SSE) return. Moreover, a univariate model discourse that the E/P ratio and ROE predictor are dominant to the E/P ratio.
Risk Valuation Approach Model
This section is based on (Model 3) to use a risk valuation approach for a comparative explanation with a fundamental approach, showed through Table 7. The static panel indicates that the Hausman (1978) test is highly significant at a 1% level which validates the estimation of the fixed-effect model whereas, the Breusch and Pagan (1980) is not significant at any level, which does not validate the use of the random effect model as an appropriate estimation method. The assumption of fixed effect estimations like cross-sectional dependence, heteroscedasticity, and autocorrelations was also tested using Pesaran’s test, Wald test, and autocorrelation tests. All these tests are highly significant, resulting in using the DKSE and PCSE models to estimate the study as per the guidelines (Driscoll & Kraay, 1998; Hoechle, 2007; Torres-Reyna, 2007). Significance of autocorrelation at first stage AR (1), insignificant at second stage AR (2) and lesser number of groups as compare to instrument provide a rationale for the incorporation of sys-GMM approach to explaining variation the SSE return in prominent means (Baum, 2013; Baum et al., 2003).
The values of the coefficient for the beta were statistically significant at a 1% level. However, they showed an inverse relationship opposing the theoretical background, reflecting market inefficiency and speculative behavior of investors in the Chinese market, and findings are aligned with previous studies (Hu et al., 2019). Size showed a more significant and negative association at a 1% level in dynamic estimation to explain the variation in SSE returns and are consistent with Cheung et al. (2015) and Hu et al. (2019). They refer that firms with small size outperform and produce more returns than firms with a larger size. E/P is significantly allied with returns at 1% and 5% in DKSE and sys-GMM, respectively, and is consistent with the finding drawn in the fundamental approach. Momentum showed significant and positive association at a 1% level in all testing while having a higher coefficient of 0.07 in sys-GMM, which contradicts the standard result that refers to the absence of momentum effect and tends to have a reversal effect in the Chinese market due to a high speculative environment. Findings for momentum variables are consistent with Pan et al. (2013) findings, which support momentum profitability in the comparative Chinese equity market because of its pervasiveness in short-term stock return. The author has undertaken TA as a liquidity proxy and find statistically significant at a 1% level in both estimations with the higher coefficient value of 0.07 in sys-GMM, which implies that the liquidity factor was likely to be more pervasive and significant in the Chinese market (Narayan et al., 2011). Finally, the dividend yield is significantly positive associated at a 1% level with the coefficient value of 0.06 in sys-GMM, which are consistent with (He et al., 2009) and (Cheung et al., 2015) findings. They imply that Chinese firms tend to have more profit, significant cash holding, low levered, and looking to undertake subsequent equity offering are more likely to pay a dividend. The two-step system GMM technique gives better estimates than statistic panel data techniques due to high significant coefficients with the inclusion of lagged dependent variables.
Combine Valuation Approach Models
This section discusses the finding of joint regressions presented through Tables 8 and 9 based on (Model 4) a combination of (EP, FEP, and FROE) with risk valuation variables and (Model 5) a combination of an aggregate predicted variable (FRM) with risk valuation variables. The static panel indicates that the Hausman (1978) test is highly significant at a 1% level, which validates the fixed-effect model’s estimation, whereas the Breusch and Pagan (1980) is not significant at any level which validates the use of the fixed effect. All tests considered for fixed effect assumptions are highly significant, which results in using the DKSE and PCSE models. Table 8 presented that E/P and ROE predictors when combining with risk valuation variables, generate the statistically significant and consistent result as separately in Table 5. However, the coefficient of determination (R2) was observed to remain improved with 0.6768 compared to the findings evident by FV approach variables separately. These findings endorse the results of Clubb and Naffi (2007) that E/P and ROE predictors’ explanatory power was assumed to be improved when combing with risk variables. The first lagged dependent variable is significant at 1% level with the coefficient of 0.003, significance of autocorrelation at first stage AR (1), and insignificance of Sargan and Hansen test leads to valid and superior incorporation of sys-GMM.
Aggregate predictor (FRM) and control variables were instituted with the same result as testing separately. However, the combined technique is giving many efficient results as compared to fundamental as well as risk-based approach individually as the coefficient of determination (R2) remain improved with 0.6843 as compared to the value of (R2) available in Tables 2 and 3, aligned with the findings of Clubb and Naffi (2007) and Cordeiro da Cunha Araújo and André Veras Machado (2018). These findings lead to accepting the hypothesis developed by the author that the aggregate predicted variable (FRM) with the inclusion of both forecasted earning to price (FEP) and forecasted return on equity (FROE) to comprehensively explain the part of the variation of the Shanghai Stock Exchange (SSE) returns. The findings confirm the superior explanatory power of FRM having R2 (0.6768) in Table 8 compared to other FV approach variables having R2 (0.6843) in Table 9 when conjoining with risk valuation approach variables. Summing up, the results demonstrated that the E/P along with E/P and ROE predictors are useful to explain the stock variation in the SSE market. Moreover, the combined approach had superior explanatory power to the model of FV and RV approaches variables when taken separately. Both static and dynamic estimation provide significant results for combined valuation approaches, while system GMM dominates because it helps to overcome the problem attached with a weak instrument.
Conclusion and Recommendations
This study is designed to analyze the explanatory power of forecasted earnings to price ratio (E/P) and ROE to capture the variation in the Shanghai Stock Exchange (SSE) returns. The research findings indicated that E/P and its predicted variable (FEP) are positively significant to explain the part of SSE returns, but the value of R2 is shallow in the multifactor model suggested by Clubb and Naffi (2007). However, both variables remain positively significant, and explanatory power keeps improved under the combined valuation perspective, which helps accept the initial two hypotheses of this study. The forecasted return on equity (FROE) is also documented a positive correlation with stock return in the FV perspective, and the explanatory power is increasing while combining with the risk proxy variables. Based on empirical findings, the third hypothesis of this article cannot be rejected that the predicted ROE significantly explains the variation of SSE stock returns and is exclusively consistent with rational stock valuation. For the formation of an aggregate predicted variable (FRM), forecasted E/P and ROE were combined with the E/P ratio, which was statistically significant but the explanatory capacity of FRM is not much satisfied but higher as compared to other variables involved in the FV approach. FV approach variables were also regressed along with the inclusion of the control variable, which enhancing their explanatory capacity with the improvement of R2 value in a combined approach. These findings paved the way to accept the last hypothesis that the aggregate predicted variable (FRM) with the inclusion of both forecasted earning to price (FEP) and forecasted return on equity (FROE) significantly explain the part of the variation of the Shanghai Stock Exchange (SSE) market returns.
This research’s contribution to the existing literature introduces a fundamental valuation approach to the Chinese market based on its unique features to explain the importance of E/P, forecasted E/P, and ROE, compared with traditionally use variables. This study’s variables were selected based on the Chinese market’s unique characteristics as E/P ratio as value measure instead of BM, which incorporated globally, and the beta factor results are not consistent with asset pricing theories. Moreover, the author confirms the existence of size, momentum, liquidity, and dividend yield in the Shanghai Stock Exchange market. The System GMM estimations techniques provided more reliable results because of its convenience to overcome the issue related to the weak instrument by inducting internal instrument to cope with endogeneity issue to yield unbiased.
Finally, this study also covered the latest accounting literature trends to induce residual income model and earnings growth model covered under the FV approach to estimate the cost of equity. Furthermore, it proved that the variables covered as FV components are expedient to explain the cross-sectional variation of actual future stock returns in the SSE market both independently and with the combination of variables usually anticipated to detain stocks’ risk characteristics. This study also helps the investors to estimate the variables as E/P ratio and ROE in next year, which improves the analytical capability of the current E/P ratio and combines the format of the aggregate predicted variable (FRM) for equity returns.
Limitations and Future Study Direction
As far as the limitations are concerned, this study was limited to only “A” type of stocks, ranging from 497 to 805 non-financial companies traded at SSE from January 1, 2000, to December 31, 2018. So, the findings are restricted up to the sample used in this research. The author suggests to a prospective researcher that they can conduct the relevant study with the inclusion of BM ratio as a value measure and make a comparative analysis with E/P ratio to explore its significant and superior impact to determine the Chinese stock return variation Market. Moreover, the prospective researcher implements this study with the inclusion of different statistical applications.
Footnotes
Acknowledgements
I want to take this opportunity to acknowledge the time and effort devoted by reviewers to improve the article’s quality.
Author Contributions
The author confirms sole responsibility for the following: Conceptualization, data collection, formal analysis, writing, and editing an original draft.
Availability of Data and Material
The data have been taken from the Chinese database, WIND, and provided on demand.
Declaration of Conflicting Interests
The author declared no potential conflicts of interest with respect to the research, authorship, and/or publication of this article.
Funding
The author received no financial support for the research, authorship, and/or publication of this article.
Ethics Statement
This material is the author’s original work, which has not been previously published elsewhere. The paper is not currently being considered for publication elsewhere.