
Abstract
Future trends in customers’ postpurchasing habits and the identification of the structures that affect the formation of these trends are key determinants of long-term financial performance and competitive advantage for businesses. In the field of marketing, service quality, perceived value and customer satisfaction, and the relationship between these structures are the main factors for the determination of customer loyalty. However, empirical findings have proven to be inadequate in revealing relationships between related structures in low- and high-involvement levels of consumer groups. Therefore, the aim of this study was to examine the moderating effect of involvement in the relationship between the behavioral intentions of members of a sports-fitness center and their antecedents. For the research, face-to-face questionnaires were administered to 842 subjects who had been selected by convenience sampling performed at sports and fitness centers operating in Istanbul, and the collected data were analyzed using the structural equation modeling technique. Our results showed that there were differences in the effects of service quality, perceived value, and customer satisfaction on behavioral intentions among consumer groups in terms of low- or high-involvement levels. This article discussed the theoretical and managerial effects of the obtained results.
Keywords
Introduction
Globally, the sport-fitness industry is rapidly growing and attracts attention due to the growing industry. According to the 2018 Global Wellness Institute report, the Global Health and Wellness Sector, including the fitness sector, is worth €3.83 trillion. This sector, which achieved a growth of 12.8% between 2015 and 2017, represents 5.3% of the economic production worldwide (Global Wellness Institute, 2018). The fitness sector has a market share of approximately 21% in the global health and wellness sector, and the size of the fitness sector in 2018 was €83.4 billion (Deloitte, 2019; International Health, Racquet & Sportsclub Association, 2019). Today, Turkey is the ninth largest national fitness market in Europe with total revenues of about €823 million with the number of members estimated to be around 2.2 million (Deloitte, 2019). Moreover, Turkey fitness market in 2018 is one of the fastest growing markets with a growth rate above the average of European membership (about 8%). At the same time, the fitness industry in Turkey still displays considerable market potential with a penetration rate of 2.6%. All these reports indicate that the market could have higher growth potential in the medium and long term for Turkey.
The number of fitness centers and the diversity of memberships around the world accelerate to grow in the fitness industry (Walker et al., 2017). In addition, the diversity of fitness center types and fitness center products contributes to greater competition in the national fitness market (García-Fernández, Gálvez-Ruíz, Fernández-Gavira, et al., 2018; Moxham & Wiseman, 2009a). These developments are triggering the number of domestic and/or foreign investments. In sectors where intense competition is experienced, business entities must accurately represent the perceptions and expectations of target consumer groups to survive and achieve success. It is well known that the satisfaction and retention of current customers are needed to win new customers due to less marketing resources (Kotler, 2003). In this sense, it is becoming increasingly important for sports-fitness enterprises and marketing practitioners to build a loyal customer base to increase the profitability of the company and to ensure its continuity. Customer loyalty, seen as an easier and more reliable source of competitive advantage, is an important component of a company’s long-term viability (C. F. Chen & Tsai, 2008). When the marketing literature is examined, the concepts of service quality, perceived value, and customer satisfaction are the main points of many studies in determining and explaining consumer behaviors (C. F. Chen & Tsai, 2008; Cronin et al., 2000; Murray & Howat, 2002; Taylor & Baker, 1994; Yu et al., 2014). Relevant studies show that service quality, perceived value, and satisfaction are good determinants of customer loyalty (repurchase intention, recommending; Petrick, 2004). However, there is a limited number of studies that have evaluated the interaction between these related structures for sports-fitness centers (García-Fernández, Gálvez-Ruíz, Fernández-Gavira, et al., 2018; García-Fernández, Gálvez-Ruíz, Pitts, et al., 2018).
For many years, the concept of consumer involvement has been an important subject for understanding and explaining consumer behaviors (Beharrell & Denison, 1995). Various studies have demonstrated that consumer involvement affects the cognitive and behavioral reactions of consumers at each stage of the purchasing decision process (recognition of problem, the search for and processing of information, evaluation of alternatives, purchase decision; Bennett et al., 2005; C. F. Chen & Tsai, 2008; Knox & Walker, 2003; Swinyard, 1993; Tsiotsou, 2006; Tsitskari et al., 2014). The level of involvement in goods and services varies widely because customers consider goods and services as a reflection of personal image. Differences in the level of involvement (high/low) may affect consumers’ psychological (Russell-Bennett et al., 2007) and attitudinal commitment levels (J. Lee & Graefe, 2001) and their knowledge seeking and buying intentions (L. Y. Lin & Chen, 2006). In this context, involvement can be a useful factor in maintaining a long-term relationship with the business in the purchasing decision process.
The aim of this study was to investigate the relationships between quality of service, perceived value, customer satisfaction, and behavioral intentions and to analyze the moderating effect of the involvement variables (i.e., high or low involvement) on the relations between the structures.
Literature Review
Behavioral Intentions and Its Antecedents
According to Ajzen (1991), the realization of behavior depends primarily on the intentions of that behavior. The stronger the intent to behave in a certain way, the greater the likelihood of that behavior. Oliver (1997) defines that intention as a personally determined probability level of the prospect for a certain behavior to be achieved. Researchers have emphasized that behavioral intentions are strong predictors of real behavior (Han & Ryu, 2009; Kwon et al., 2007) and that an individual’s behavior is predictable based on their intentions (Ajzen & Fishbein, 1980). In this framework, behavioral intentions are considered as a determinant of consumer purchasing behaviors in the marketing literature, and some researchers in various sectors have examined the formation of behavioral intentions to better understand the purchasing behavior of customers. Accordingly, consumers can develop positive intentions, such as positive verbal feedback, repurchasing, and purchasing from the organization, as well as counter-intentions (Ali & Amin, 2014; Han & Kim, 2009; Ladhari, 2009). In fact, behavioral intentions are seen as a clue as to whether customers will either continue to receive service from the organization or leave the organization (J. Lin & Hsieh, 2005; Zeithaml et al., 1996).
In the service marketing literature, different studies, including recent satisfaction studies, have focused on what constitutes decisive factors in the formation of behavioral intentions and the effects of service value (Cronin et al., 2000). From the findings obtained in these studies, although certain ideas related to various subject matters have begun to emerge, certain questions remain unresolved (Taylor & Baker, 1994). For example, Bitner (1990) and Bolton and Drew (1991) argue that the relationship between service quality and customer satisfaction is a priority in maintaining service quality. On the contrary, there are researchers who suggest that customer satisfaction depends on perceived service quality, emotional state of the customers, social interactions, and other subjective evaluations that ultimately lead to the overall experience by customers (Chang, 1998; García-Fernández et al., 2014; García-Fernández, Gálvez-Ruíz, Fernández-Gavira, et al., 2018; García-Fernández, Gálvez-Ruíz, Pitts, et al., 2018; Rahman et al., 2012; Taylor & Baker, 1994b). Howat and Assaker (2013) argue that the quality of service indirectly affects behavioral intentions solely through the satisfaction experienced by the customer. In contrast, Chang (1998) notes the relationship between quality of service, customer satisfaction, and behavioral intentions by two separate models (First Model: Service Quality → Customer Satisfaction → Behavioral Intentions; Second Model: Customer Satisfaction → Service Quality → Behavioral Intentions) and shows that the first model is better fit than the second model. However, the first model that satisfaction is a variable dependent on perceived quality is widely accepted in the sport-fitness sector (García-Fernández, Gálvez-Ruíz, Fernández-Gavira, et al., 2018; García-Fernández, Gálvez-Ruíz, Pitts, et al., 2018; García-Fernández, Gálvez-Ruiz, Vélez-Colon, et al., 2018).
Accordingly, service quality can be regarded as a priority for customer satisfaction in explaining behavioral intentions in sport-fitness services (Brady et al., 2001; Brady & Robertson, 2001; Chang, 1998; Dabholkar et al., 2000). Thus, the results of empirical efforts to confirm the specific nature of the relationship between service quality, satisfaction, and behavioral intentions present conflicting ideas on the possible relationships between the structures.
On the contrary, Zeithaml (1988) suggests that consumers evaluate goods or services according to price, quality, and value perceptions. However, researchers tend to generally agree on the conclusion of the analysis of data from different sectors, like communication (Bolton & Drew, 1991), fast food (Brady et al., 2001), and sports (Hightower et al., 2002), which shows that similar results are achieved and that perceived service quality is an important determinant of perceived value (García-Fernández, Gálvez-Ruíz, Fernández-Gavira, et al., 2018; García-Fernández, Gálvez-Ruíz, Pitts, et al., 2018; García-Fernández, Gálvez-Ruiz, Vélez-Colon, et al., 2018). When the relations between perceived value and behavioral intentions are evaluated, there are meaningful and positive relations between the structures. Although some studies have demonstrated that there is a positive relationship between these variables (perceived value and repurchase intentions; García-Fernández et al., 2017), recent studies reveal that there is a positive and direct relationship between perceived value and future intentions in fitness centers (García-Fernández, Gálvez-Ruiz, Vélez-Colon, et al., 2018; Murray & Howat, 2002). In other words, researchers generally accept the perceived value by consumers that directly affects their postpurchase behavior (such as repeated purchases of the same product, turning to alternatives, or recommending products/services to others; Li et al., 2012; Sweeney & Soutar, 2001; Sweeney et al., 1999). Similarly, it has been found in studies conducted on baseball (Hightower et al., 2002) and rugby spectators (Clemes et al., 2011) that the quality of service is, quite naturally, an important determinant of service quality and that the perceived value has a direct and positive influence on behavioral intentions.
Only a limited number of studies have examined the relationship between perceived value and customer satisfaction and the effect of these two concepts on behavioral intentions (Chiou, 2004; Eggert & Ulaga, 2002; McDougall & Levesque, 2000; Ryu et al., 2012; Uzkurt, 2007). However, they are often confused with each because perceived value and satisfaction are closely related concepts. In some studies, the two concepts are even used interchangeably, and the subtle distinctions between them are overlooked other (Uzkurt, 2007; Uzkurt & Koc, 2007). In this context, Howat and Assaker (2013) point out that perceived value does not have a direct effect on behavioral intentions, but rather that the perceived value, as a mediator of customer satisfaction, has a significant positive effect on behavioral intentions. Murray and Howat (2002) put forward statistical evidence showing that causal orderings between structures have taken the form of “Perceived Value → Customer Satisfaction → Behavioral Intentions.” Moreover, García-Fernández, Gálvez-Ruiz, Vélez-Colon, et al. (2018) emphasize the importance of quality and service convenience as factors that affect value, followed by the repercussion on satisfaction and loyalty on a model of loyalty in a low-cost sports organization. In summary, it is suggested that perceived value and customer satisfaction variables are important priorities in terms of behavioral intentions and that a causal relationship generally influences cognitive evaluation (perceived value), affective evaluation, and indirectly action (behavioral intention).
The Role of Involvement in Interstructural Relationships
Mitchell (1979) describes involvement as a personal variable, or an internal state variable, that expresses the amount of attention, arousal, and motivation triggered by a stimulus or situation. Studies have shown that the needs, self-expression value, and individual reactions to the product have an impact on the emergence and degree of involvement (Koc, 2019; Zaichkowsky, 1985). The degree of consumer involvement in a product, brand, and/or purchase decision is an important determinant of the individual’s cognitive and behavioral attitude (Bennett et al., 2005). For example, low-involvement consumers tend to forget or not store marketing communication information in their memory, whereas high-involvement consumers may be more sensitive to marketing communication information, as well as inadequate information (Koc, 2019). Therefore, involvement is related to the importance attributed to the purchasing behavior by the consumer and will affect the entire nature of the purchasing decision process (Knox & Walker, 2003). It could be argued that involvement affects consumer behaviors in the purchasing decision process and that behavioral changes occur according to the degree of involvement (Bennett et al., 2005; C. F. Chen & Tsai, 2008; Swinyard, 1993; Tsiotsou, 2006). Although the involvement context has received considerable attention since 1980 in leisure and recreation sport studies, the application of involvement context in the fitness clubs’ membership has been limited (Tsitskari et al., 2014; Vlachopoulos et al., 2008). On the contrary, Tsitskari et al. (2014) state that individuals who are more involved in an activity are more likely to remain customers in the future according to different studies in the field of sports and recreation. Especially increasing competition and the extremely high cost of acquiring new customers have gained a critical importance to retain or keep the existing customer. However, the fact is that businesses in the fitness industry seem to be inadequate to retain their customers. According to Tsitskari et al. (2014), fitness facilities have suffered low retention rates in spite of the industry’s size and provided services.
It can be seen that studies in different sectors, including the sports and fitness sector, have been conducted on the structural relations between the variables of service quality, perceived value, and customer satisfaction, all of which are recognized as determinants of behavioral intentions (Chang, 1998; Y. C. Chen et al., 2013; Clemes et al., 2011; Hightower et al., 2002; Howat & Assaker, 2013; Kouthouris & Alexandris, 2005; D. Lee & Trail, 2011; Murray & Howat, 2002; Theodorakis et al., 2014). All the above studies demonstrate the importance of the repurchase intention in sport-fitness centers and the need for ongoing research in this field. In general, the relevant literature provides information about the relationships between the variables (service quality, perceived value, customer satisfaction, and repurchase intentions) to be analyzed. However, there is a gap in the literature about how interorganizational relations are shaped in terms of the level of involvement; otherwise stated, there is a lack of clarification on the causal relationships between variables. More specifically, the limited number of studies associated with the fitness industry has performed in Turkey. García-Fernández, Gálvez-Ruíz, Pitts, et al. (2018) note that the literature can be enriched with such studies and the results will contribute to the management of the sport-fitness center. This study presents a model of the relationship between perceived quality, perceived value, satisfaction, and repurchase intentions in two different customer segments (low and high involvement) of sport-fitness centers. Based on the above definitions and the proposed relationships of the variables in the literature, the following hypotheses can be defined as (Figure 1):

The model of hypothesized.
Method
Participants and Procedure
This research was carried out at eight different sports and fitness centers in Istanbul. The data were collected through a face-to-face survey questionnaire, which was administered via convenience sampling by six educated interviewers at different days and times of the week in the first 3 months of 2015. The completion time of the questionnaire varied between 10 and 12 min on average. Participation in the research was voluntary. In proportion to the number of members in the selected sports and fitness centers, 3,000 surveys were administered, of which 1,253 were completed. After an examination of the completed surveys, a total of 842 (nearly 28.0%) were accepted for analysis. Survey questionnaires that had constant markings of the same value, inconsistent markings for the control questions, missing values, or errors were eliminated. Although the approximately 28% response rate in social studies is perceived as relatively low, it is an acceptable value for consumer research due to the difficulty in obtaining cooperation with the participants (De Vaus, 2014).
Among the participants, 57.7% (n = 486) were male, 42.3% (n = 356) were female, 39.1% (n = 329) were married, and 60.9% (n = 513) were single. A large majority 40.3% (n = 339) of the participants were in the age range of 20 to 29 years, 28.5% (n = 240) in the age range of 30 to 39 years, 19.7% (n = 166) in the age range of 40 years and above, and 11.5% (n = 97) in the age range of 19 years and below. A total of 54.3% (n = 457) had a university degree, 34.2% (n = 288) graduated from high school, and 11.5% (n = 97) held a graduate-level degree. Regarding the participants’ membership, 48% (n = 404) were members of their respective sports and fitness centers for 3 to 7 months, 18.4% (n = 155) for 8 to 12 months, and 33.6% (n = 283) for more than 1 year. In terms of the participants’ weekly attendance at the centers, 5.1% (n = 43) attended less than once a week, 55.4% (n = 466) 1 to 3 times a week, and 39.5% (n = 333) 4 to 7 times a week. Furthermore, 8.7% (n = 73) used the sports-fitness center for less than 1 hr per visit, 54.2% (n = 456) used it from 1 to 2 hr per visit, 25.6% (n = 216) from 2 to 3 hr per visit, and 11.5% (n = 97) for more than 3 hr per visit. Weight training was the most popular activity, followed by step-aerobics and group lessons. The participants’ main reasons for going to the sports and fitness centers were to maintain their health, to control their weight, to relax, and to socialize.
Measurement Tool
The questionnaire form used for the study was developed within the framework of the theories and findings presented in past studies. On the form, the perception of the service quality of the sports and fitness center was determined with 38 items (nine items on staff, seven on program, four on locker rooms, eight on physical facilities, six on training facility, and four on other members), which were compiled based on the studies by Lam (2000) and Gurbuz et al. (2005). Another 18 items were on the questionnaire to address perceived value (three items: Cronin et al., 2000; Petrick, 2004; Zeithaml, 1988), customer satisfaction (four items: Oliver, 1980; Westbrook & Oliver, 1991), involvement (seven items: Bauer et al., 2006; Bloch, 1981), and behavioral intentions (four items: Zeithaml et al., 1996). The scale of involvement was used as the semantic differential scale. A 5-point Likert-type scale was used for other all scales. In addition, six items were included to determine the participants’ sociodemographic characteristics and experience levels.
In developing the questionnaire form, there were several factors taken into consideration for ensuring the suitability of the scale for measuring the research variables, including the selection of the group, that the statements were clear and understandable, that the correlated statements were presented in groups, and that the participants were not bored. The questionnaire was initially administered to 43 people to determine whether there was any lack of clarity, comprehensibility, fluency, or meaningfulness before entering the field study. Necessary changes were made to the questionnaire based on the findings obtained from these preliminary applications to detect and screen for possible defects.
Analysis Data
IBM SPSS 20 and IBM AMOS 20 programs were used to analyze the data. Descriptive statistics, including frequency distributions and arithmetic mean, were performed. The relationships between the structures in the research model were examined through structural equilibrium modeling and the hypotheses tested. The analysis of the research model was carried out in two stages. In the first phase, confirmatory factor analysis (CFA) was performed for the measurement model, and in the second phase, the structural relationships between the structures were tested. After completing the CFA, the values of Cronbach’s alpha, average variance extracted (AVE), and composite reliability (CR) were examined to test the reliability of each structure (Fornell & Larcker, 1981; Hair et al., 2009). To confirm structural validity, discriminant validity and convergent validity tests were performed. In the discriminant validity test, the “uncorrelated model,” where interrelationships between dimensions are identified, as opposed to the “correlated model,” where correlations between all dimensions are fixed at “1,” was used (Bagozzi et al., 1991). For convergent validation, Hair et al. (2009) and Fornell and Larcker (1981) proposed values based on the values of CR and AVE. Accordingly, the AVE must be greater than 0.5 and the CR must be greater than .7. The adequacy of the model using a set of fit indexes was analyzed through the maximum likelihood method. Different goodness-of-fit indexes, including the ratio of chi-square to its degrees of freedom (χ2/df ≤ 3), goodness-of-fit index (GFI ≥ 0.8), adjusted goodness-of-fit index (AGFI ≥ 0.8), Tucker–Lewis index (TLI ≥ 0.9), comparative fit index (CFI ≥ 0.9), incremental fit index (IFI ≥ 0.9), and root mean square error of approximation (RMSEA ≤ 0.08), were performed (Byrne, 2010; Kline, 2015; Schermelleh-Engel et al., 2003; Schumacker & Lomax, 2004).
Results
The research model was analyzed in two steps. In the first step, CFA model was performed. Then, several items (service quality [staff: one item; training facility: two items; and program: three items] and involvement: two items) had to be removed to obtain good or acceptable in terms of CFA and internal consistency (Supplementary Table 1). The fit index values of the CFA model were given in Table 1. Compliance index values were found to be within an acceptable range (Byrne, 2010; Schermelleh-Engel et al., 2003; Schumacker & Lomax, 2004).
CFA Fit Index Values.

Note. CFA = confirmatory factor analysis; GFI = goodness-of-fit index; AGFI = adjusted goodness-of-fit index; TLI = Tucker–Lewis index; CFI = comparative fit index; IFI = incremental fit index; RMSEA= root mean square error of approximation.
The structure model was analyzed by the values of Cronbach’s alpha, AVE, and CR to evaluate the reliability of each structure (Table 2). The obtained results showed that the internal consistency of the items contained in the factors was satisfactory.
Structure Validity Test Results.

Note. CR = composite reliability; AVE = average variance extracted.
For both the correlated and the uncorrelated models, discriminant validity was confirmed, as 5χ20.05 = 11,070 and the table value Δχ2 = 237,326 > 11,070. As shown in Table 2, the conditions specified for the model constructions were within acceptable limits and the equivalence validity was confirmed.
Following the analysis of validity and reliability, the aim was to analyze the hypotheses and the interrelationships between variables. Consumer groups with low and high levels of involvement were tested on the model to compare the effect levels of the variables that have an impact on their behavioral intentions in terms of their level of involvement as sports-fitness consumers. The compliance index values obtained from the analysis were shown in Table 3.
Fit Index Values and Variance Accounted for in Latent Variable Models.

Note. GFI = goodness-of-fit index; AGFI = adjusted goodness-of-fit index; TLI = Tucker–Lewis index; CFI = comparative fit index; IFI = incremental fit index; RMSEA = root mean square error of approximation; R2 = variance accounted for.
p < .001.
All the analysis endpoint compliance indices were found to be at an acceptable level. From the results of these analyses, direct, indirect, and total effects, as shown in Table 4 and Figure 2, were calculated to determine the relative effects of the variables in the model on one another.
Results of Models.

p < .05.
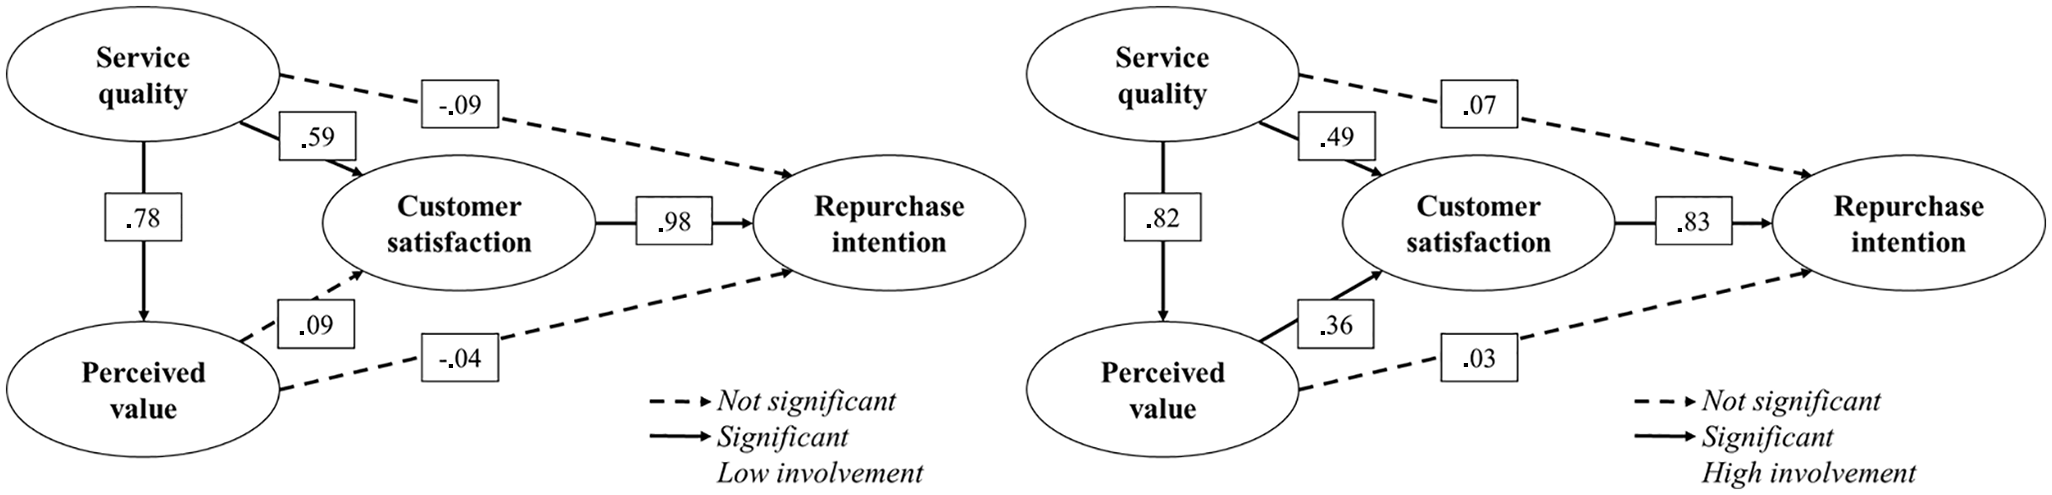
A schematic diagram of model results “low-involvement (left) and high-involvement (right) customer group.”
The similarities and differences among the groups with low and high levels of involvement, in terms of the effects of the research variables on behavioral intentions, could be summarized as follows:
First, the effects of the quality of service (βlow = −0.09; βhigh = 0.07; p > .05) and the perceived value (βlow = −0.04; βhigh = 0.03; p > .05) for both groups (low- and high-involvement consumer groups) on behavioral intentions were not statistically significant. The indirect effects of the service quality variable on the behavioral intentions of both groups were very similar to each other. In evaluating the total effect of service quality on the behavioral intentions, the value of the high-involvement group was very similar to the total effect on the perceived value and the behavioral intentions, with the impact value being about 20% greater than the impact value of the low-involvement group.
The effect of the service quality on the perceived value of both groups was similar, as shown in the variance of the perceived value, which, being explained by the antecedents, was 62% in the low-involvement group and 68% in the high-involvement group (p < .05).
The variance values of the customer satisfaction variable, which can be explained by the antecedents, were different in both groups, with it being 66% for the high-involvement group and 45% for the low-involvement group. The fact that the effect of perceived value on satisfaction was very low and not significant in the low-involvement group could best explain the low value seen in the low-involvement group. This also resulted in differentiation in the total effect of service quality on satisfaction. When the direct effects were examined, the effect of satisfaction on service quality (βlow = 0.59, p < .05) was higher in the low-involvement group than of that in the group with high involvement (βhigh = 0.49, p < .05). There was a difference of about 12% in the effect levels of the variables between the two groups.
Finally, for the low-level involvement group, the effect of customer satisfaction on behavioral intentions was very high (βlow = 0.98; p < .05), being 15% higher than the value in the high-involvement group (βhigh = 0.83; p < .05).
Finally, a multigroup moderation was conducted for involvement through critical ratios (Gaskin, 2016). There was a significant difference (p < .001) between low and high involvement along the path from customer satisfaction to repurchase intention and also between from perceived value to repurchase intention (p < .01), as shown in Table 5.
Difference Test Between Low- and High-Involvement Groups (With Critical Ratios).
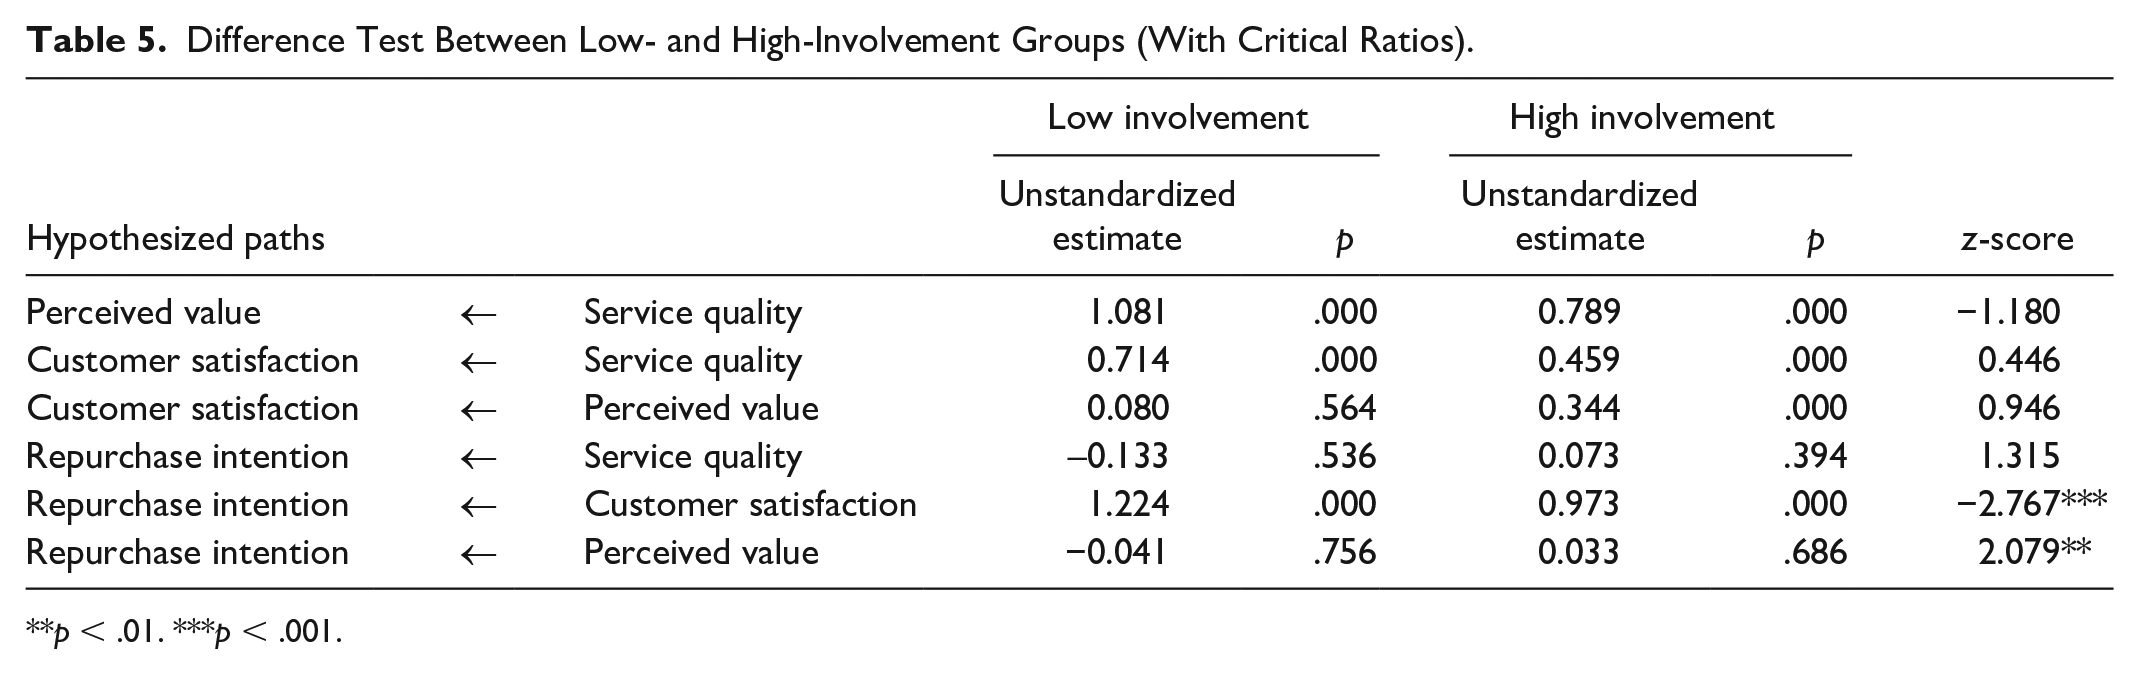
p < .01. ***p < .001.
Discussion and Conclusion
From the beginning of the 20th century, the service sector has become increasingly prominent and creating added value. The continuous growth of the service sector share in the gross national product (GNP) of countries around the world testifies to the sector’s rising prominence (Lovelock & Wirtz, 2011). Parallel to these recent developments in the service sector is the transformation in the sports and fitness industry in Turkey, where competition among companies has increased. This increase in competition leads to businesses struggling to find cost-cutting measures and to retain existing customers. To retain existing customers, accurate analysis of the cognitive, emotional, and behavioral structures that impact the direction of future purchasing attitudes and trends of customers’ needs to be conducted for the development of proper marketing strategies. Accordingly, this research was conducted to determine whether consumer differences in the level of involvement in a product cause differentiation in the causal relationship between the determinants of behavioral intentions (service quality, perceived value, customer satisfaction). The obtained results were discussed below.
Consumers With Low Involvement
The perceived value did not have a direct or indirect effect on either customer satisfaction or behavioral intentions. On the contrary, service quality was found to have a direct effect on perceived value and customer satisfaction but no direct effect on behavioral intentions. Rather, the quality of service was found to have an indirect effect on behavioral intentions. These results showed that customer satisfaction played a mediating role between service quality and behavioral intentions. In the model specifically tested for sports-fitness services, the causal relationship between variables for low-involvement consumers was as follows:

Consumers With High Involvement
Service quality was found to have a direct impact on perceived value and both a direct and indirect influence on customer satisfaction. Perceived value had a direct impact on customer satisfaction, and while both service quality and perceived value were shown to not have a direct impact on behavioral intentions, both structures did have indirect effects on behavioral intentions. In the tested model, the causal relationship between variables for consumers with high involvement was as follows:

In other words, customer satisfaction played a mediating role in perceived service quality and perceived value and behavioral intentions. The obtained findings were correlated with those reported by De Barros and Gonçalves (2009) and Yu et al. (2014), that is, the cited studies report a similar causal relation of “evaluation–emotional response–behavioral intention” (Cronin et al., 2000).
General Evaluation
For both consumer groups (low and high involvement), the effects of the perceived quality and value variables on behavioral intentions were not found to be significant. However, the variance values related to the customer satisfaction variable explained by antecedents were different for the groups. In effect, this means that behavioral intentions have a strong impact on customer satisfaction in the formation of customer loyalty. In the formation of this powerful effect, it was observed that service quality, for consumers with low involvement, and both service quality and perceived value, for consumers with high involvement, were important antecedents. This suggests that consumers are making purchasing decisions in a very comprehensive, complex manner (C. F. Chen & Tsai, 2008).
In this study, consumers with a high level of involvement were more sensitive than consumers with a low level of involvement, and for the highly involved group, costs and sacrifices had a stronger influence on the purchase decision process. With this finding, it can be argued that highly involved consumers are more informed and/or have more knowledge about the market and therefore are more sensitive about the value presented. On the contrary, quality of service, perceived value, and customer satisfaction appeared to have considerable influence on both groups and were indirectly played an important role in shaping consumers’ future decisions. Therefore, when the effects of customer satisfaction on behavioral intentions are taken into consideration, it is very important that sports-fitness center managers aim to retain current customers, gain new customers, gain competitive advantage, and increase profitability by securing customer satisfaction. Indeed, García-Fernández et al. (2018a) state that organizations providing sports-fitness services should focus on customer satisfaction as it directly affects customer loyalty. Therefore, sport-fitness centers should focus on dealing with processes that guarantee high-quality standards to increase customer satisfaction and reduce the perception of time and effort in implementing sports services. It is important that managers responsible for sport-fitness centers to continuously evaluate their consumers. In addition, loyalty will be based on their perception of variables, including quality, value, and satisfaction. As in previous studies (García-Fernández, Gálvez-Ruíz, Pitts, et al., 2018; García-Fernández, Gálvez-Ruiz, Vélez-Colon, et al., 2018), sport-fitness center managers should correctly manage the three factors examined (perceived quality, value, and satisfaction) in the current study. Furthermore, it should also be noted that differences in consumer involvement levels need to be taken into account in this management process.
Customers who are satisfied with an organization are more likely to recommend it to another person (relative/acquaintances) and tend to be more involved and willing to purchase products or services from the business concerned (Grönroos, 2000; Lovelock & Wirtz, 2011). Positive verbal communication and recommendations are the cheapest and most effective ways to promote the business. To create and sustain customer satisfaction, it is necessary to take initiatives to enhance and improve service quality. These initiatives are so imperative because members whose expectations have been met and/or whose satisfaction has been gained through the services offered by the sports-fitness center will be more likely retained.
Finally, this study revealed the differences between customers of sports-fitness centers in terms of the effect of obtained results on management. Improvements can be made in the quality of the service by keeping a close eye on the market and by instituting Customer Relationship Management (CRM) applications. Through these efforts, businesses can enhance their perceived value, the dynamic of which includes pre- and postpurchase evaluations and taking competitors into account. Our findings showed that the relationship between perceived quality and repurchase intentions and customer satisfaction was important for both the low- and high-involvement consumer groups as customers are very rigorous and critical in making purchase decisions (García-Fernández, Gálvez-Ruiz, Vélez-Colon, et al., 2018). Improving perceptions of consumer quality and value by implementing constructive changes throughout the business (e.g., launching different programs, class and marketing efforts, taking into account consumers’ levels of involvement) will have a positive impact on the cognitive evaluation process carried out by consumers. The effects of these efforts will show in the way a business secures or increases customer satisfaction (Koc, 2019). As the data show that the level of customer satisfaction primarily affects repeat purchases and consumption (more frequent/infrequent; Kotler, 2003), it can be argued that customer satisfaction will have a significant impact on a business’s long-term relationship with their customers and their survival.
Consequently, our findings demonstrated that the effects of service quality, perceived value, and customer satisfaction on behavioral intentions among consumer groups were different in terms of low- or high-involvement levels among customers. However, our study had some limitations. These limitations and relevant future suggestions are given in the following section.
Limitations and Suggestions
The rate of return to the questionnaire was weak in our study. Participants could be hesitant or reluctant to participate in the survey due to factors related to the research topic (questionnaire length, difficulty, or boringness of the questions, etc.) and/or the participants (exiting the exercise, time constraint, etc.). In addition, Oriade and Schofield (2019) state that it is often not easy to stop, engage, and collaborate with potential participants in a completely random manner in attractions, shopping malls, or destinations. It seems possible to state that a similar situation is valid for sports-fitness centers. For this reason, choosing the online survey method in addition to applying face-to-face surveys in future studies may help eliminate this handicap. Another issue is related to the research model fit index values. Although there are different opinions about the model fit index values, there are sources stating that the GFI value should be 0.90 and above (Byrne, 2010; Kline, 2015). In this context, attention should be paid to model fit in future studies and measures should be taken to improve and develop the model.
Within the scope of this study, involvement in sport-fitness services was evaluated according to the “low/high product involvement” of consumers. However, the effects on the model can be further investigated by the evaluation of other classification types (such as continuous and situational involvement) in the related literature. Furthermore, this study was carried out in Istanbul, which is the greatest number of the sports-fitness center in Turkey with nearly 15 million people population. However, the obtained results can be performed in different cities to expand our findings. Finally, a small number of items were used to measure the perceived value, customer satisfaction, and repurchase intentions in the present study as in previous studies. However, it may be recommended to use more comprehensive scales to measure these variables to a better understanding of consumers.
We provide some suggestions for future directions. First, the causal relationships between the variables in the model and the results on the effects of the variables on behavioral intentions should guide future work in terms of low- and high-involvement groups. Second, consumers can be divided into various market segments in terms of their level of involvement (Alexandris & Tsiotsou, 2012; Nella & Christou, 2014), and customized marketing strategies can be developed for one or more of the target market segments. Third, the year of collection of research data can be considered as another limitation. As stated earlier, Turkey fitness industry has a rapidly growing market structure and consumer perceptions can vary continuously. For this reason, it is of strategic importance to systematically measure consumer desires and expectations in developing markets and to organize business practices in line with this information. Finally, similarities and differences between sectors can be evaluated by applying the proposed model on different sectors in terms of the level of involvement. The model considered in this study can be improved by including variables such as experience situation, risk perception, consumption emotions, and cultural characteristics for sport-fitness services, or alternative models.
Supplemental Material
sj-pdf-1-sgo-10.1177_21582440211014495 – Supplemental material for The Moderating Effect of Involvement in the Relationship Between Customer Behavioral Intentions and Its Antecedents
Supplemental material, sj-pdf-1-sgo-10.1177_21582440211014495 for The Moderating Effect of Involvement in the Relationship Between Customer Behavioral Intentions and Its Antecedents by Ersin Eskiler and Remzi Altunışık in SAGE Open
Footnotes
Declaration of Conflicting Interests
The author(s) declared no potential conflicts of interest with respect to the research, authorship, and/or publication of this article.
Funding
The author(s) received no financial support for the research and/or authorship of this article.
Supplemental Material
Supplemental material for this article is available online.
References
Supplementary Material
Please find the following supplemental material available below.
For Open Access articles published under a Creative Commons License, all supplemental material carries the same license as the article it is associated with.
For non-Open Access articles published, all supplemental material carries a non-exclusive license, and permission requests for re-use of supplemental material or any part of supplemental material shall be sent directly to the copyright owner as specified in the copyright notice associated with the article.