
Abstract
There is an upward trend in housing prices around the world, and Pakistan is no different either; being a developing county, it is facing a rising population. Due to this, the demand for housing has exceeded its supply and in turn rinsing their prices. This study is the first attempt to identify housing price bubbles in Pakistan from 1972 to 2018. The data are available on an annual basis, and to capture the price volatility, it is converted into a quarterly and monthly format. The Generalized Supremum Augmented Dickey–Fuller (GSADF) test is used to detect multiple bubbles. Monthly data showed more episodes of bubbles than yearly and quarterly data; in each case, it reported two periods of bubble episodes. The results of the house price dynamics suggest a higher return with high risk in the short run.
Introduction
Global house prices have increased dramatically, earning the attention of academia, economists, and policy makers. There are examples of excessive lending for housing, and such events became a cause of the subprime mortgage crisis. The 1997 Asian financial crisis which jolted most of the Asian financial markets and caused global financial turmoil (Acharya & Richardson, 2009) also affected housing markets. Recently, the macroeconomic research has focused on heavy fluctuation in asset and especially property prices; this has raised new phenomena of house price bubbles (Vogiazas & Alexiou, 2017). The nominal prices of housing have increased in developed economies like Spain, Sweden, Britain, Australia, and Ireland. This increase has been up to 100%, albeit the United States has also experienced the highest increase in house prices. It rose to 95% in just 8 years from 1997 to 2006 (Malpezzi & Wachter, 2005). Three events caused great house price volatility, namely, rising house prices in the 1980s, the housing boom of Japan 1989, and finally, the 1997 financial crisis in Asia (Meen, 1998). This rise in housing prices has been experienced in most real estate markets around the world, leading to the coinage of the new term “housing bubble” (Kapur, 2006).
The bubbles in house prices are usually unpredictable and are not stable either. They are attributed to the abrupt and continuous increase in house prices from the fundamental value of the asset, which usually hampers economic performance (Kritayanavaj, 2008). The variables like GDP (gross domestic product), interest rate, inflation rate, and exchange rate are known as economic fundamentals in determining house prices (Garber, 2001; Shiller, 2003). Two different criteria help in deciding the house prices while keeping in view the market fundamentals; the flow of rent and expected gain or loss from it in the future (Xiao & Randolph Tan, 2007). The phases of expansion and recession cause changes in future prices dramatically. In recent times, housing markets have experienced bubbles more frequently, of which there are two famous examples in economic history.
According to the agenda for global development, housing has got priority among other sectors; the motive is to provide housing services at affordable rates to underprivileged headcounts. Rapid urbanization has aggravated this problem not only in developed countries but also in developing ones. The dilemma is more or less the same for South Asia, where a large number of households face many problems related to housing, the provision of financing is at the top of it. The upper class of the society usually get loans easier than the lower class that face trouble due to poor repayment capacity and cumbersome formalities related to it. This reflects in low mortgage to GDP ratio for South Asian economies. For instance, the numbers for India in 2017 were 7.7%, Bangladesh 3%, and Sri Lanka 7.5%. In the case of Pakistan, this ratio was as low as 0.5% (Pakistan Bureau of Statistics [PBS], 2018). The fact is, South Asia comprises about half of the world’s population. The majority of this population is primarily poor and lives just on the poverty line which badly needs low cost and affordable housing units. It is the need of time that these people are provided with urgent and soft housing finance modes instead of the prevailing ones.
Housing price is considered as a proxy for the measurement of changes in the value of houses. In Pakistan, the house rent has increased tremendously from 9% during 1972–1980 to 165% in 2011–2018; this decade-wise phase of rapidly rising prices creates the housing bubble and it needs to be addressed (Ministry of Finance, 2018). The economy grew at a moderate rate of about 4% to 5%, albeit 6% during the 1980s. Many factors play a crucial role in house price volatility like rural–urban migration, rapidly increasing population, and urbanization. Table 1 shows some of the indicators which relate to the current debate about the housing market.
Overview of Pakistan Economy and Housing Market (Averages).

Source. Author’s calculations.
Note. GDP = gross domestic product.
Pakistan has been facing an acute shortage of housing for a long time; the need is most profoundly felt by the poor and destitute part of society. The country’s population grew at 2.4% annually and stood at 208 million in the year 2017, with an estimated demand of 700,000 dwelling units annually. However, hardly 50% of this is being met with the current resources (Ministry of Finance, 2018). The financial sector’s role in the provision of finances is deficient due to the high cost of housing finance and its difficult procedure. There is a deficit of about 10 million housing units, and with the growing population, it is growing persistently. The financial sector earmarked Rs. 92.4 billion for December 2018 in the housing sector, which is equal to 0.5% of the GDP. The total housing finance as a ratio to GDP is low in Pakistan. India and Bangladesh, on the contrary, are enjoying a higher amount of this ratio than Pakistan. Hence, the provision of housing finance is mandatory for the development of the housing sector. There is another aspect of dealing with the issue at hand. The market for stocks, and in general the financial market, is prone to frequent ups and downs. This results in market volatility where people prefer to invest in real estate. The rising population and rural to urban migration has increased the scope of the housing sector. Figure 1 shows the trend of housing in Pakistan.

Growth rate of House Price Index and Consumer Price Index.
The comparison of the Consumer Price Index (CPI) with the House Price Index (HPI) shows interesting facts about the bubble dilemma. At the start of the sample period, the general price level was above the HPI. Over time, it reached its peak in two instances, once in 1974 and second in 2010. This compelled us to carry out a research study to find out the events underlying the housing price bubble.
Therefore, motivated by the current economic outlook of Pakistan, the current study is intended to ascertain the risks involved, and answer the question that for how long this rising trend in housing prices will persist (or collapse). This is the first study to analyze the housing price bubble focussed dedicatedly on the economy of Pakistan. For this purpose, it will be using a sophisticated and newly developed econometric technique known as Generalized Supremum Augmented Dickey–Fuller (GSADF), which is popular also among asset price modeling. The rest of the article is organized as follows: the “Literature Review” section discusses relevant literature; the “Methodology and Data” section presents methodology and data; the “Results” section shows results, and finally “Conclusion and Policy Recommendations” section presents the conclusion and policy recommendations.
Literature Review
This section covers the literature related to the housing price bubbles around the world. There are a large number of studies that addressed the housing from different perspectives and techniques of analysis. Huston and Spencer (2018) applied GSADF and Campbell–Shiller approach to study the bubbles for the economy of the United States. The focus of their study was equity, bonds, and housing markets to find out the price bubbles. When the central bank of an economy purchases assets in large quantity or so for a long span, this action causes asset prices to rise, and gives the signal for a financial crisis soon. In the United States, due to such interventions of the central bank, housing and bond prices rose quickly, this gives evidence of price bubbles, which ultimately led to the subprime mortgage crisis.
Dufitinema (2020) analyzed the housing prices in relation to stock prices in the Finland economy from 1988 to 2018 on quarterly basis. The study is focused on the 15 regions which are further divided into 45 cities and the unit of analysis is the residential unit with different characteristics. The results indicate the clustering effects for the studied apartments which pertains to the respective cities and regions. Given the ARCH effects, the analysis suggests that the investors in the housing sector should be aware of the high risk during the volatile economic times, and the diversified portfolio has been preferred. The housing market in Finland is sensitive to the bad news and Helsinki experienced a bubble in the housing prices.
Bangura and Lee (2020a) analyzed the housing price diffusion from low to high priced submarkets for housing in Sydney. They used the quarterly data set from 1991 to 2016 for the two submarkets, and results confirm the association of housing price in both the submarkets, the greater degree of diffusion is reported from less priced to high priced submarket in the city. This finding is in favor of the hypothesis of equity transfer. The reaction in the economic fundamentals has been reflected from the low priced submarket.
Bangura and Lee (2020b) analyzed the housing price bubbles in the five major regions of the metropolitan city of Sydney. The Backward Supremum Augmented Dickey–Fuller (BSADF) test is used to see the bubbles in the housing prices. There is not cointegration in the western region; however, strong correlations are seen in northern and eastern regions between house rent and prices. There are evidences of the explosive bubbles only in the western parts of Sydney and other regions does not show any signs of bubbles in the house prices. The study proved the speculative investment in the housing sector argument put forward by the Psychological theory proposed by Shiller (2007). In this case, it is proved that the housing market shows different behavior according to the submarket basis.
Begiazi and Katsiampa (2019) examine the price volatility of different types of residential units of the British economy. The results confirm the structural breaks in the mean and variance, seven regions reportedly showed structural breaks for and in three types of property and six regions for both type of equations. Such results provide a suitable base for future investment decisions in the various forms of residential units in the housing sector.
Al-Masum and Lee (2019) analyzed the rising housing prices in the Australian city Sydney using time-series data from 1991 to 2016 on quarter basis, the cointegration results indicate long-run relationship between the macroeconomic fundamentals and housing prices in Sydney. The housing prices is positively related to disposable income and population; however, it is negatively related to the housing supply, interest rate, unemployment rate, and GDP. The impact of population is dominating around the world; it is also reflected in this study and it is also reflected from the short-run analysis.
Hu and Oxley (2018a) analyzed the asset price bubbles of the 1980s and 1990s for the Japanese economy from 1970 to 1999 quarterly. They used the methodology of the right-tailed unit root test developed by Phillips et al. (2015b) besides the technique suggested by Greenaway-McGrevy and Phillips (2016) for the exploration of the phenomenon of contagion among markets. The results of the study confirmed the presence of the bubbles by applying the newest techniques for both markets during the said time. It is also the first such effort that revealed the contagion of bubble from stock markets to the real estate sector.
Hu and Oxley (2018b) found out bubbles in the housing market of the United States on the state level from 1975 to 2014 monthly. They used the price–income ratio in their analysis. During the 1980s, the evidence of bubbles was observed in various states like New York, Massachusetts, Hawaii, and California. In addition, the bubbles were also noticed in the 2000s for about 20 states that were greater than that of the 1980s. The GSADF method was used for detecting the bubbles in the U.S. housing market.
Pavlidis et al. (2019) have focused their attention on the effect of cross-section aggregation. They have done this through experiments of simulation to the power properties of the tests which highlight the bubbles in the asset prices. They have considered the data set of metropolitan areas of the United States as well as of other countries to simulate and draw conclusions for their aggregations. However, this lowers the power of the said tests (SADF and GSADF). The test proposed by Pavlidis et al. (2016) for the panel GSADF gives better results than the univariate tests. They also showed the date stamping of the housing bubbles for the univariate as well as panel GSADF data. The interest rate and uncertainty of policy have a lot of impact on the mildly explosive dynamics of the housing prices.
Gomez-Gonzalez et al. (2018) analyzed the rapid spread of housing bubbles among nations from 1970 to 2015 quarterly for the 20 Organisation for Economic Co-Operation and Development (OECD) economies. They calculated the ADF unit root test for the multiple recursive regression and used GSADF test proposed by Phillips et al. (2015b) for 24 quarters as window size simulated with the Monte Carlo procedure. The results reveal the presence of housing bubble all over the set of countries however, the transmission of the bubbles is also seen among countries. The cause of such a bubble transmission is from the subprime financial crisis that originated from the United States. The European economies were the recipients of this housing bubbles except for the Spanish housing bubble which did not get affected by the U.S. housing market.
Gomez-Gonzalez and Sanin-Restrepo (2018) used Phillips et al. (2011, 2015b) approach for the analysis of housing market of Canadian provinces; they used monthly data from January 1986 to September 2016 for nine provinces on house price and rent. This strategy is advantageous over aggregate data in the sense that the transmission of bubbles could be identified from one province to another. Their results confirm the coexistence of housing market bubbles and monetary policy easing, this has also been found out by many studies (Cecchetti et al., 2017; Dell’Ariccia et al., 2017; Jiménez et al., 2014). The study concluded that bubbles migrate from province to province.
Shi (2017) analyzed the bubbles for U.S. national and 21 metropolitan statistical areas of the housing market from 1978 to 2015. The modified form of the bubble detection method is used which systematically incorporates a vector autoregressive model to identify the role of market fundamentals in the housing markets and identification of bubble as the ultimate objective. The proposed method, unlike Phillips et al. (2015a, 2015b) who identified a bubble for the entire sample for the U.S. national housing market and regional level, found two bubbles—one in the 1980s and second in 2000s.
Huang and Shen (2017) investigated the house price bubbles for 2009–2015 on a monthly basis in the Hong Kong housing market. They used the GSADF test to find out the presence of bubbles and dynamic Probit model based on the GSADF test to identify the cause of boom or bubble in the housing market. The findings show the presence of a bubble which is caused by the increase in money supply and speculative demand of investors; the luxury market will get attracted through the two factors mentioned earlier. The government should be vigilant to the U.S. monetary policies and the exchange rate arrangements. Furthermore, the government should give special importance to the speculative demand of investors to curb the housing market bubbles.
Coskun et al. (2020) analyzed the housing market for Turkey by utilizing the two series with different periods. The HPI is used for the period 2010: M1–2014: M12, which is published by the Central Bank of Turkey, while Reidin’s HPI covers the period 2007: M6–2014: M12. The stationarity of the series was checked with Augmented Dickey Fuller (ADF), Phillips and Perron (PP), and Ng-Perron (NP) tests, while the bound test was performed to see the order of cointegration among the series. In addition, ordinary least squares (OLS), fully modified least squares (FMOLS), dynamic least squares (DOLS), and Kalman Filter were used; while ARIMA is used to forecast the housing prices. The results reveal that there is overvaluation in the house price rather than bubble formation. Similarly, Vogiazas and Alexiou (2017) analyzed the relation of property prices with the business cycle and detected the bubbles in the housing prices. They used the data from 2002 to 2015 for the seven OECD economies, namely, Australia, Denmark, the United Kingdom, Belgium, Sweden, Canada, and Norway. The bubbles detection for every country is done with the help of Phillips et al. (2011, 2015b) method.
Escobari and Jafarinejad (2016) have tested the existence of single or multiple bubbles in the housing price of the United States from 1980 to 2013 monthly. They used the three real estate investment trusts, namely, Equity index, Mortgage index, and Hybrid index. Supremum Augmented Dickey–Fuller (SADF) and GSADF tests were also used to explore the starting and ending points of bubbles in time series. The results reveal that there are speculative bubbles in the real estate investment trust indices.
Liu et al. (2016) analyzed housing price bubbles for the Chinese economy by dividing its 70 cities into three categories by the size of cities; they took monthly data from 2006 to 2013. They employed SADF and GSADF proposed by Phillips et al. (2015b) to detect bubbles. The results showed the presence of bubbles in various cities except for Tangshan. Furthermore, these bubbles were seen for a sample of 70 cities.
Lee and Reed (2014) analyzed the price volatility decomposition of the Australian housing market with the help of CGARCH tool to segregate the permanent and transitory components. The Australian capital cities include Sydney, Melbourne, Brisbane, Adelaide, Perth, Hobart, Darwin, and Canberra. The results reveals that transitory effects are longer than the permanent effects, and the short-run effects of prices is lesser than long-run shocks. The general price level and GDP has stern influence on the housing prices, whereas transitory volatility is shown by the GDP, one period before housing prices, and the population. Such factors explain varying nature of the housing price volatility.
Yiu et al. (2013) detected six bubbles in the housing prices of Hong Kong; the first four bubbles are positive during 1995, 1997, 2004, and 2008. However, two negative bubbles also occurred in the years 2000 and 2001. Their method of investigation was suggested by Phillips et al. (2011). During 2011, the method found bubbles for the overall housing market including the market for luxury apartments, and those bubbles are attributed partly to the excess demand of ultimate users, and partly to the small and medium-sized houses.
Ren et al. (2012) tried to find out the housing price bubbles in the Chinese housing market with the help of rational expectations technique as it was first used in the literature by Blanchard and Watson (1982). They also discussed other methods to test housing price bubbles like present value approach, a discount of cash flow for future, house price concerning economic fundamentals, and finally the supply–demand models of housing. They used economic data of 35 cities in testing housing bubbles but failed to find them in the housing price in China.
Mahalik and Mallick (2011) analyzed housing price bubbles for the Indian economy for 1996–2007 quarterly by employing the cointegration and vector error correction model (VECM) technique. They found that the house prices in India are positively affected by the real income in the long run. The relation of non–food bank credit is negatively explained with house prices and is, in fact, the major cause for variations in these prices. In emerging economies, the role of credit availability significantly affects housing prices.
Lee (2009) analyzed the price volatility of the housing market from 1987 to 2007 for the eight Australian cities. The housing price volatility is estimated with the EGARCH modeling and the volatility clustering is checked with the Engle Lagrange Multiplier (LM) test. The findings revealed that the Australian housing markets are consistent with other markets and report housing price volatility for the selected cities, and the bad news is the major contributor of the raising housing prices. The general price level rise is another phenomenon with increase in the housing prices in the capital cities. Such an information about the market volatility is considered an indication to the investors working in the housing sector.
Coleman et al. (2008) tried to analyze the subprime lending regarding the housing price bubbles for the period of 1998–2006, covering 20 metropolitan cities. The study indicated that the economic fundamentals were the primary cause of subprime lending; this was for the period earlier than 2004. The prices rose mainly because of the interest of the investors in the real estate. It is also established that after 2003, lending in the housing sector shifted due to the emergence of other loan products. There are various measures to assess housing price bubbles, these include a comparison of ratios, regression models, and growth rates of house prices (Bourassa et al., 2019). However, the techniques proposed by Phillips et al. (2011, 2015b) of the SADF and GSADF are applied to find out periods of bubbles in the housing markets for Pakistan’s economy.
Garber (1990) gave a detailed theoretical justification of the housing price bubbles with the help of three important examples, which include the Mississippi Bubble (1719–1720), South Sea Bubble (1720), and the Dutch tulip mania (1634–1637). His approach was mainly focused on explaining the market fundamental factors in defining the housing price bubble phenomenon. Similarly, Driffill and Sola (1998) analyzed the Markov-switching process about intrinsic bubbles. However, they concluded that it is not that easy to distinguish both the bubbles and switching process, nonetheless, it is established that the former is better than the later.
The housing has been studied from the perspective of supply constraints as compared with later studies that focused their attention on the demand side of the housing. Glaeser et al. (2005) studied housing supply elasticity which is affected by the regulations of the authorities concerned. The argument supplements that as the number of regulations increases so does the condition of housing. This affects housing supply elasticity in a declining way and this eventually raises the housing prices. Some of the studies also endorse such results (Malpezzi, 1996, 1999; Malpezzi & Maclennan, 2001). This argument is also established from the perspective of increasing housing prices due to regulations in a cross-sectional data set.
Blanchard and Watson (1982) analyzed housing prices from the present value approach, which says that the present value of an asset depends on its future income segment. They have assumed that there is neither a rational bubble nor any arbitrage. Furthermore, the price of housing is dependent on the rent it will earn shortly. When investors guess the future price of housing, it increases. They willingly pay a higher amount than the actual price, and this gives impetus to the price bubble. In this sense, the bubble component is added to its fundamental value to form rational bubbles.
In Pakistan, there are a few studies available on the housing sector (Umar et al., 2019), which have analyzed the housing price with respect to the monetary policy, by taking time-series data set from 2011 to 2016 on a monthly basis. They used VAR methodology and concluded that there is significant impact of monetary management on the housing prices in the country albeit stock price does not affect it at all. This study limited to the monetary perspective only in analyzing the housing prices fluctuations. There is wide area available for research into the domestic as well as foreign factors that affect housing prices.
There is a huge amount of literature available on the housing from asset prices to bubbles formation and detection. We have presented a review of relevant studies for developed and developing countries, some of which are focused on the city or provincial level. The motivation to undertake such a study is to identify the detection of bubbles in the housing market because there is not any study carried out in Pakistan to address this issue. Hence, this is a novel work and the pioneering attempt to study the housing price bubbles. Most of the studies have used annual time series for the analysis; however, the segregation of data into quarterly and monthly will produce interesting results which show the matter very closely.
Methodology and Data
This section covers the description of the data that will be used in the analysis and its sources. The methodology that is most relevant to the proposed topic of housing price bubbles is discussed afterward. It also contains a description of the relevant methods and remarks about their behavior. In this study, house rent is used as a proxy for the housing price and it has also been used as a proxy of house price by a number of studies (Coskun et al., 2020; Hu & Oxley, 2018a; Oust, 2013; Ren et al., 2012; Yiu et al., 2013). To analyze bubbles in the house price of Pakistan’s economy, the data on house rent index are taken from various issues of the Economic Survey of Pakistan, which is published by the Ministry of Finance. The time-series data cover 47 observations, ranging from 1972 to 2018 on an annual basis.
The economic data are available usually every year for most of the variables; however, it is quite interesting to work with high-frequency data. High-frequency data are superior to low-frequency data in terms of capturing empirical volatility. If these data are to be converted into high frequency, like breaking it into smaller components, it, in turn, will suggest a different link with other variables. The low-frequency data show results which are less attractive as compared with the high-frequency data like quarterly, monthly, and so on. It is converted with Best Linear Unbiased Estimator (BLUE), suggested by Chow and Lin (1971), and is better than other techniques (Fernandez, 1981; Kalman, 1960; Litterman, 1983). The number of observations used in this study is limited to data availability from sources.
However, this technique satisfies all the properties of the BLUE approach, and therefore it is preferred over the earlier ones econometrically (Meese & Wallace, 2003). However, the data have been converted into monthly and quarterly sets using the methodology of Chow and Lin (1971). This is the best method having great econometric implications in the forecasting as well. The data of the house rent index are used in the logarithms. The use of high-frequency data is increasing, for example, Cotter and Stevenson (2006) have used daily data in comparison with the monthly data for the analysis of real estate investment trust. In another study conducted by Lee (2017) for the five Australian cities, he used daily data to investigate the housing price volatility. Such studies confirm the benefits of the usage of the high-frequency data in the analysis.
After the 1997 Asian financial crisis, several studies have explored the phenomenon of the bubble in the house prices around the world, some of them are Yiu et al. (2013), Caspi (2016), and Hu and Oxley (2018b), whereas many more use it for other types of assets. Pakistan’s economy has also been facing an increase in the housing prices, but no study was aimed at addressing this housing price bubble phenomenon. This is the first attempt to explore the bubbles for the Pakistani housing market.
The housing bubble is an important economic concern, it has been surveyed in detail by Mayer (2011). To address this issue efficiently, the study will highlight the phases of bubbles in the housing prices for the economy. The price level boom has been experienced many times as it hampers all the economic fundamentals. Housing is considered an important economic indicator nowadays. Therefore, its price stability is a prerequisite for successful and smooth economic growth. The abruptly rising prices above the mean level growth are generally regarded as house price bubbles, although economists have failed to give a comprehensive definition of the bubbles until now. Nevertheless, this serves the idea of housing price bubbles at the primitive stage.
Various tests can be used to find out asset price bubbles. These include West’s two-step tests (West, 1987); variance bounds test (LeRoy & Porter, 1981; Shiller, 1980), and the cointegration test (Diba & Grossman, 1988). These tests serve as the basis of the present value model. In the case of the variance test, the bubble exists when observed prices are greater than the fundamental prices of an asset. Whereas, the West’s test compares the starting and ending points of an asset’s price to form a bubble. Finally, the Hausman test will indicate their validity. In this way, both the methods are related to the fundamental value of the asset and try to infer based on their value, though the fundamental value is of great ambiguity. This is the reason why it is not useful in the empirical design of any study (Hui & Yue, 2006). In the context of the above two methods, the bubbles refer to the increase from fundamental factors to its actual price. However, this is just a theoretical consideration that is contributed by Hui et al. (2011), Hui and Yue (2006), and Chan et al. (2001). The major criticism for both the models is about their specification; the null hypothesis rejection leads to simply the misspecification of the model (Gürkaynak, 2008).
The explosive process of the bubbles is the preferred opinion over the fundamental values of an asset to inquire about the possible bubbles (Phillips et al., 2015b). The cointegration method proposed by Diba and Grossman (1988) is used to find out the bubble in the asset price with the stationarity property of any time series after it is differenced by the left-tailed Dickey–Fuller test. Evans (1991) criticized this on the ground that it failed to detect the collapsing bubbles in the asset price periodically. Conversely, the argument of Diba and Grossman (1988) reiterates that if there is a bubble, it means it was in the past. There is an opinion that collapsing of an asset price bubble resembles the stationarity of a time series. Evans (1991) described this with the simulation method provided by Monte Carlo. Phillips et al. (2011) suggested the remedy for this problem by introducing the sub-Dickey–Fuller test based on the recursive right-tailed DF which can detect the single bubble in the asset prices.
To meet the challenges of bubble detection in asset price, Phillips et al. (2015b) developed an efficient version of the sub-Dickey–Fuller test. It can now allow the adjustment of the initial or endpoints of the range and also the window size. This new method is efficient enough to detect the multiple bubbles over a long sample period; it is also preferable over Chow and CUSUM techniques. Pavlidis et al. (2014; Phillips et al., 2015a, 2015b) proved its efficiency by the Monte Carlo simulation of the experimental data and the data gathered by the stock market. This method is popular enough for its effectiveness and is increasingly being used to find bubbles in the financial market (Bettendorf & Chen, 2013) and the housing market as well (Jo & Kim, 2014; Pavlidis et al., 2014; Wan, 2015; Yiu et al., 2013). Some of the writers also used a co-explosive VAR method, like Engsted and Nielsen (2012) and Engsted et al. (2016), as it does not allow the bubble to be burst for the sample period. In this case, bubble stamping is not performed; however, the test must detect the period of bubbles.
The price of an asset is dependent on its future dividends, which follow the pattern of discounted flow. In such a case, the behavior of the asset’s price should be explosive. If the said return from asset shows stationarity at the level or first difference, then its price also follows the same pattern. However, the component for the bubble will be simply added to address the assumption of sub-martingale. This assumption clarifies that it should be a stochastic process. The expected value of the said asset should be greater than the price of the asset or higher from its current value, which is the price. The equation below shows the lambda.

It is established that the price


If the series contains multiple numbers of bubbles, then it will be difficult for the SADF test to give a complete picture of the series empirically. Because SADF starts the process with the first observation, in this case, identification of multiple bubbles will not be satisfied.
In this context, the GSADF test is preferred over the SADF. To find out the periods of multiple bubbles in the house price, the study will adopt the GSADF tests as suggested by Phillips et al. (2011) and Phillips et al. (2015b). The test is a GSADF test. The GSADF is superior to SADF in the sense that it starts simulating from the smallest feasible observation h till the full sample H. To detect house price bubbles, the study uses the GSADF test and its standard format is given as under.


It is clear from the above discussion that the GSADF technique is suitable and superior to other techniques, and it is used to find out episodes of multiple bubbles in the economy of Pakistan. This test is also used by Gomez-Gonzalez et al. (2018) to analyze the multiple bubbles in the housing prices of the OECD economies.
Results
To analyze the bubble phenomenon for the developing economy like Pakistan, GSADF technique is adopted which is proposed by Phillips et al. (2011) and Phillips et al. (2015b), containing null hypothesis of unit root against the mild explosive behavior of the house price as an alternate one. The guideline suggests that if the calculated value of test statistics exceeds the right side critical values at different levels, then the series is said to be containing explosive behavior. The bubbles in the log of house rent index are found out with the help of the GSADF test and the results are reported in Table 2. To show the price volatility, the analysis was performed on a yearly, quarterly, and monthly basis to know variations in the housing market of Pakistan. This is evident from the test statistic values from the yearly data (GSADF 4.834 > 2.795), quarterly data (GSADF 10.735 > 2.704), and finally, the monthly data reports (GSADF 19.978 > 2.906). It shows the evidence of bubbles in house prices.
The GSADF Test Statistics.
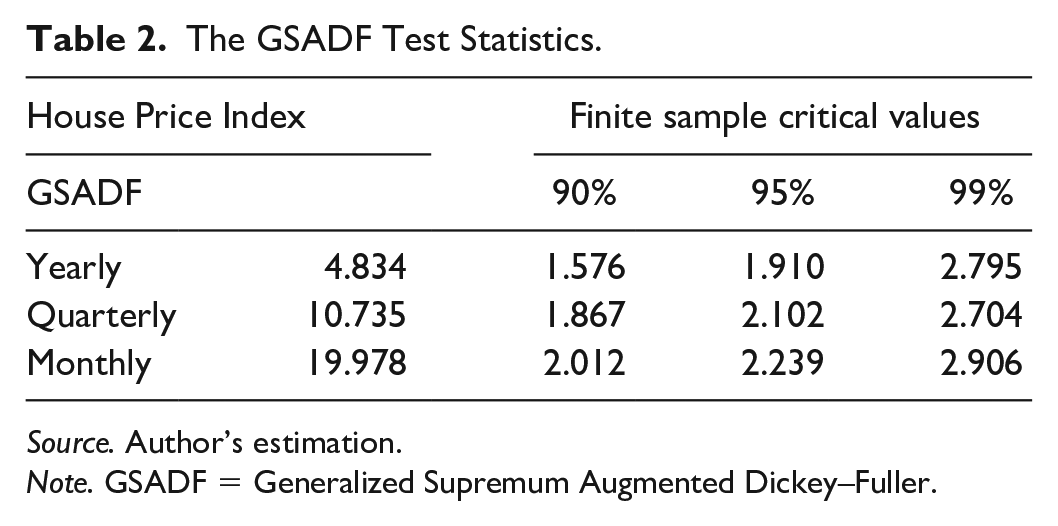
Source. Author’s estimation.
Note. GSADF = Generalized Supremum Augmented Dickey–Fuller.
The GSADF test detects multiple episodes of bubbles; it has been applied to housing prices in the Pakistan economy. Rejection of the null hypothesis is possible only if the calculated value of test statistics is greater than the right-tailed critical value at different levels. This means that the series at hand contains multiple episodes of bubbles (Table 3). It will be clear from the graphical description that in which periods the economy has experienced bubbles in the particular series under study. It is evident from Figure 2 that the bubble is found in the case of yearly analysis in the house prices, provided that the blue line of the forward ADF test crosses the red line of 95% critical value, the result is valid for GSADF. In the yearly analysis, the first episode of the housing bubble starts from 1993 to 2002, and after the slight difference, the economy of Pakistan experiences the bubble again in 2005 to 2018.
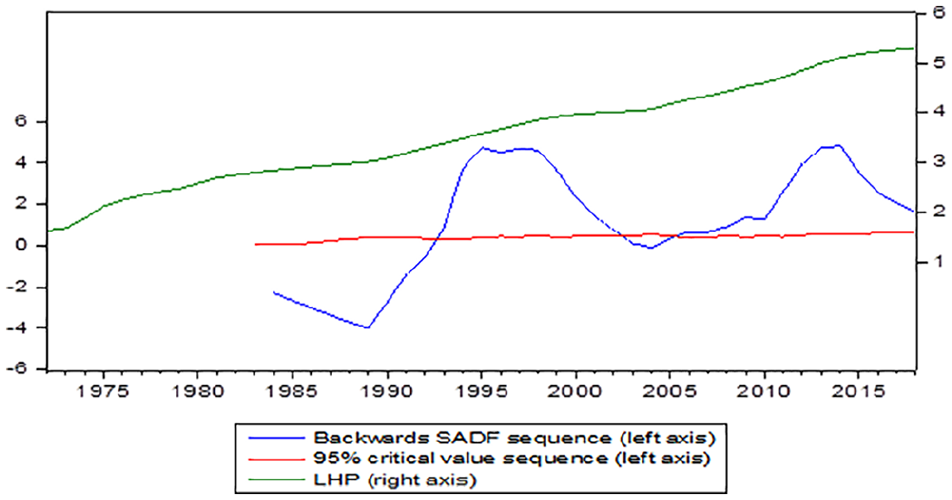
Results of GSADF test for yearly data of House Price Index.
Episodes of House Price Bubbles in Economy of Pakistan.

Source. Author’s estimation.
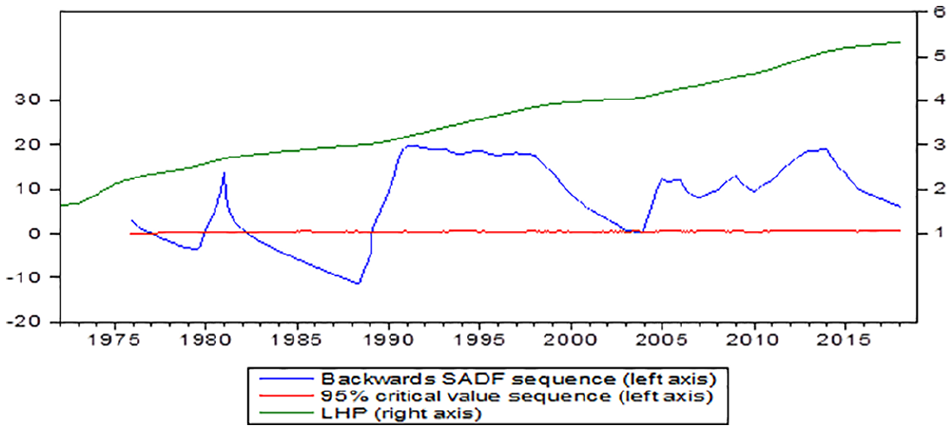
Furthermore, the same analysis is carried out every quarter to show the robustness of the results. The GSADF test shows large periods of the bubbles quarterly. The first bubble episode starts from 1989Q3 to 2002Q4, and the second started with a little time difference, from 2004Q4 to 2018Q4 (Figure 3).

Results of GSADF test for quarterly data of House Price Index.
The results of the GSADF tests for monthly data of the house prices are depicted in Figure 4; showing a highly volatile trend. The economy of Pakistan has undergone large episodes of housing bubbles in the short run, which is evident from monthly analysis. It seems that short-term investment is risky but more profitable rather than long-term on a yearly or quarterly basis.
Results of GSADF test for monthly data of House Price Index.
The monthly analysis of the house price with the GSADF test shows that the first bubble in the house price starts from 1980M01 to 1982M02. However, this is the additional information that we got when we continued our analysis up to monthly data. Such close information about the house price bubbles was missing in the previous two analyses. The second phase of the bubble in the house price of Pakistan started in 1989M02 and continued till 2003M01, and it is considered the biggest episode of a bubble in the sample period. With the little fluctuation in the series, the bubble started again in 2004M01 till the end of the sample that is 2018M12. Such kind of information was hidden when it was analyzed on a yearly and quarterly basis. This information about the monthly trend of house prices is crucial for individuals, investors, and policy makers.
The close analysis of the yearly, quarterly, and monthly data reveals the fact that in the economy of Pakistan, an investor can gain a large amount in the short run that is monthly. The housing price trend in the yearly data shows that the first episode of the bubble started from 1992 till 2002, whereas the quarterly analysis highlights that the bubble started in 1989, 3 years before the annual analysis. This sensitivity of the result is due to the segregation of the sample period into quarterly data. However, the spell of the bubble period is shorter in the yearly analysis rather than quarterly because it ended in 2002 for yearly analysis as compared with the 2003Q3 for quarterly analysis.
However, the real estate sector in the economy of Pakistan is more volatile in the short run like a monthly basis. The first bubble started in the period 1980M01 to 1982M02, such information is missing from the earlier two analyses. Similarly, the second episode of the bubble started in the 1989M02 and lasted till 2003M01. The individuals as well as investors from both sides, local and foreigners, are attracted to invest in the housing market because the short-term investment is more profitable than the long run. However, it is a risky venture even though the housing market has great potential to grow.
Conclusion and Policy Recommendations
This is the pioneering study to analyze housing price dynamics from 1972 through 2018. The data on house prices are available on an annual basis. Due to the benefits of using high-frequency data and accessing sensitivity, the series has been converted into a quarterly and monthly basis using the methodology proposed by Chow and Lin (1971). To identify multiple bubbles in the housing price of Pakistan, the right-tailed ADF test suggested by Phillips et al. (2011, 2015b) is used that is popularly known as the GSADF test. The results suggest that multiple episodes of the bubble in the house price have been seen for the three strands of analysis that is annual, quarterly, and monthly data sets. Using the above technique, Almudhaf (2017) was successful in detecting multiple bubbles and date-stamping them for the economies of Tunisia, Ghana, Nigeria, Botswana, Egypt, and Kenya.
The results suggest that two episodes of bubbles are found each in the yearly and quarterly data. The detection of multiple bubbles in the monthly data shows interesting implications for policymakers. In the economy of Pakistan, the housing price is highly volatile in the very short run like monthly. The price trend shows three episodes of bubbles in monthly data that were not identifiable in the case of long-run analysis like yearly and quarterly. There is a good earning opportunity in the housing sector in case an investor intends to invest in the short run, that is, monthly. The results of the study are valuable for risk-loving investors who intend to invest in the short run and earn a supernormal profit. Therefore, the housing sector in Pakistan is most attractive in this respect, the profit motive will attract foreign investors as well as local investors to reap the profits.
The government of Pakistan has published its housing policy for the first time in the year 2001 and discontinued afterward. Publishing housing policy on a regular basis will serve policy makers and the public at large about housing decisions. The rising trend of housing prices can be controlled through corrective measures by building housing units in large quantities by the public authorities to control the rapidly rising prices in the future. Housing is a durable asset, it needs to be addressed at top priority.
Direction for Further Research
Pakistan is the fifth most populous country in the world (United Nations, Department of Economic and Social Affairs, 2019); it is suffering from a shortage of housing due to rapid urbanization and rising population. The cities are expanding day by day and becoming densely populated due to the lack of urban planning. Karachi is the largest and fastest-growing city in the country and it is known as the “city of lights,” having a large industrial base. It is housing a huge population of around 15 million according to the 2017 population census (PBS, 2019). The city alone is the largest market for investing in the housing sector. The rising demand for housing units has put upward pressure on the price. The city-level analysis of both rental and owner-occupied properties will be highly preferable to carry out this theme for future research.
Footnotes
Declaration of Conflicting Interests
The author(s) declared no potential conflicts of interest with respect to the research, authorship, and/or publication of this article.
Funding
The author(s) received no financial support for the research, authorship, and/or publication of this article.