
Abstract
This article selects A-share state-owned listed companies in Shanghai and Shenzhen stock exchanges from 2007 to 2018 as samples and uses OLS together with intermediary effect tests to study the impact of state-owned enterprise’ (SOEs) policy burdens on credit resources and their allocation efficiency. The research finds that the heavier the policy burden SOEs assume, the more credit resources they obtained. However, they are also more likely to make inefficient investments after obtaining the credit resources, and these credit resources have a negative effect on the value of the SOEs which bear the policy burden. These negative impacts are more significant in SOEs with low degree of marketization in the region, low level of government control, and low information transparency. The path analysis elaborates that the policy burden of SOEs reduces the efficiency of resource allocation by increasing management agency costs and reducing financing constraints. The conclusions enrich the understanding of the consequences of policy burdens under the background of Chinese system, further broaden the analytical framework of the efficiency of credit resource allocation, and unveil the importance of relevant government departments that can optimize the efficiency of credit resource allocation.
Introduction
Government–enterprise relations are a major issue in economic reform and development, and policy burdens are one of the most important manifestations of government intervention in enterprises. Enterprises are burdened with excessive redundant staff and employee benefits. J. Y. Lin and Tan (1999) refer to the burden created by government functions as a policy burden. The autonomy of managers of state-owned enterprise (SOEs) has increased with the imposition of state-owned enterprise reforms, but the actual control of enterprises at all levels is still in the hands of governments. Its dual attributes create favorable conditions for government intervention in the operating decisions of SOEs. The government protects people’s lives, maintains social stability, and promotes economic development, but it has limited financial resources. In order to seek development in all aspects, the government turns its political and economic goals into SOEs. This causes SOEs to undertake a large political burden, which is mainly manifested by redundant staff, employee benefits, employee endowment insurance, and maintaining social stability (J. Y. Lin & Tan, 1999). So how did the government smoothly transfer policy burdens to SOEs? Since performance reviews, power of appointment, and removal of SOE executives are controlled by the government, the government likely uses its influence and authority to allocate various items to the SOEs’ policy burden, Such as redundancy and employee benefits (F. M. Liao et al., 2019). Especially in the tournament mode of developing economics, under the encouragement of promotion mechanisms and in order to quickly achieve performance goals, the internalization of political and economic goals has become more salient for governments at all levels, and the phenomenon of policy burdens on controlled enterprises has become increasingly serious. As a result, it has led to the distortion of the micro-decision-making behaviors of enterprises (M. Zhang et al., 2013).
Policy burdens have a dual impact on SOEs. On one hand, SOEs help the government by assuming responsibilities, while the government also provide SOEs with a certain degree of support, such as credit preferences, tax incentives, and financial subsidies (G. M. Liao & Shen, 2014). On the other hand, policy burdens cause SOEs to focus more on the political and economic impact of their corporate behavior and less on the business performance of enterprises. This kind of corporate target deviation distorts the incentive and restraint mechanism of state-owned enterprise management (G. M. Chen et al., 2006; Shleifer, 1998), therefore, reducing the economic efficiency of enterprises (Zhao & Ao, 2016). Then it further weaks the market competitiveness of enterprises (Xue & Bai, 2008), which may hinder the increase in enterprise value. Although policy burdens have brought a lot of available resources to SOEs, it is not clear whether those resources are effectively allocated. Since credit is an important source of funds for corporate financing and investment, the efficiency of credit allocation will inevitably affect the development of SOEs and even the health of the national economy. Therefore, research on how policy burdens affect the efficiency of credit allocation is valuable for academic and practical purposes. Currently, SOEs shoulder heavy policy burdens, which is a major manifestation of government intervention (G. M. Liao & Shen, 2014). There are differences in resources and implementation of national policies throughout various regions, which leads to different levels of marketization in each region. Objective functions also do not converge at all levels of government. Therefore, SOEs controlled by all regions and all levels of the government are subjected to administrative interventions, and the degree and direction of these interventions significantly differ (L. P. Wang et al., 2011). Under the circumstances of different levels of marketization and different levels of government control, this work also studies the differences in the impact of policy burdens of SOEs on the efficiency of credit allocation. Moreover, given that the level of information transparency affects government intervention in enterprises (Bushman et al., 2004) and also acts as a restraint mechanism for corporate managers, it can seriously affect the relationship between the policy burden of SOEs and the efficiency of credit allocation. Overall, this article inspects how the level of information transparency influences the efficiency of credit resource allocation.
Literature Review
From the research status at home and abroad, the existing literature mainly focuses on the impact of policy burden on enterprise resource allocation and the impact of policy burden on enterprise performance.
The Impact of Policy Burden on Enterprise Resource Allocation
Literature on the impact of policy burden on enterprise resource allocation is mainly reflected in two aspects of enterprise financing and investment.
(a) The impact of policy burden on enterprise financing activities. First of all, from the perspective of government subsidies, enterprises can obtain explicit and implicit financial subsidies from the government because they bear the policy burden (W. J. Li et al., 2012; Xue & Bai, 2008; M. G. Yu et al., 2010; Z. Yu et al., 2020). Second, from the perspective of credit support, the enterprises that bear the policy burden are more likely to obtain financing support from the government (Fan et al., 2008; Ji et al., 2018; G. M. Liao & Shen, 2014; J. Y. Lin & Tan, 1999; Z. Sun et al., 2005; M. G. Yu & Pan, 2008). Third, from the perspective of tax benefits, the enterprises that bear the policy burden are more likely to obtain tax concessions and other benefits from the government (W. J. Li et al., 2012; J. Lin et al., 1998).
(b) The impact of policy burden on enterprise investment activities. In terms of investment activities, enterprises that bear the policy burden can obtain more investment projects and preferential policies from the government, which makes it easier for these enterprises to enter into some monopoly or regulatory industries, thus making them have more investment opportunities (Berglof & Roland, 1997; Hu, 2006; Luo & Liu, 2009; Martin, 2008); at the same time, the policy burden will lead to the soft budget constraints, which will make the governance of bank liabilities ineffective and increase the agency cost of enterprises, thus affecting their investment behavior (F. M. Liao et al., 2019; J. H. Liu, 2006; Sheng & Li, 2010).
The Impact of Policy Burden on Enterprise Performance
The theory of policy burden holds that due to incomplete contracts and incompatible incentives, the existence of policy burden will aggravate the problem of operator agency caused by asymmetric information, damage the viability of enterprises (J. Lin et al., 1998; J. Y. Lin & Tan, 1999), thereby reducing enterprise value. A large number of studies have shown that the operating efficiency of state-owned enterprises is generally lower than that of non-state-owned enterprises (Megginson & Netter, 2001), which is caused by the excessive intervention of the government to bring a lot of policy burden to state-owned enterprises (W. G. Li & Yu, 2012; Ni et al., 2019). Holz (2002) and X. Y. Chen and Huang (2007) confirmed that the policy burden will reduce the operating performance of state-owned enterprises, that is consistent with the results of Holz (2002). Qi and Wang (2004) believe that redundant unemployment and social burden are the important reasons for the low efficiency of state-owned enterprises.
It has been generally found that the burden of redundant employees has a significant negative effect on corporate performance (Yang & Zhao, 2016), while reducing government intervention and increasing the power of companies to allocate employees freely can significantly improve corporate performance (Q. S. Zeng & Chen, 2006). Fan et al. (2008) and Xue and Bai (2008) all found that the heavier the policy burden on enterprises, the greater the negative effect on their performance. G. M. Liao and Shen (2014) used the data of China’s state-owned listed companies to find that the burden of redundant personnel borne by state-owned enterprises would damage their economic efficiency and reduce their accounting performance and market value. Y. J. Shen and Ni (2014) found that the policy burden significantly reduced the executive pay performance sensitivity. Based on the perspective of audit fees, Chu (2020) found that policy burden has a significant negative effect on enterprise operation.
Through the above literature review, we can see that the first kind of literature is generally limited to the investigation of the state-owned enterprises that bear the policy burden can obtain a series of credit preferential resources, but it has not paid attention to the allocation efficiency of the resources, so it is difficult to reasonably judge the impact of the policy burden on the national economy; the second kind of literature generally directly studies the impact of the policy burden on the enterprise efficiency or performance However, it does not provide a specific impact mechanism, that is, the channel through which policy burden affects enterprise efficiency or performance. This study reveals that policy burden exerts an impact on resource allocation efficiency through agency costs and financing constraints, which promotes the existing literature.
The contributions of this research are mainly reflected in the broadening of the research framework of policy burden and enterprise resource allocation efficiency. Previous research has thoroughly discussed policy burdens, which bring a lot of preferential policies to SOEs, but few have focused on the efficiency of preferential resource allocations. Thus, this study explores the impact of policy burdens on the efficiency of credit resources allocated to SOEs. In addition, this study enriches the research on the economic consequences of policy burdens by studying different levels and directions of government intervention. To further compliment related research on policy burdens of SOEs, we also provide a good reference for deepening reforms of SOEs. Finally, we also study the path through which the policy burden of SOEs affects the efficiency of credit resource allocation. Overall, this study explores the mechanism by which SOEs’ policy burdens affect the efficiency of credit resource allocation and provides specific ways for enterprises to solve the problem of credit resource allocation efficiency.
Theoretical Analysis and Research Assumptions
Impact of Policy Burden on SOE Investment Efficiency
Shleifer and Vishny (1997) believe that government interventions affect enterprises’ business activities for the sake of special political goals (mainly including absorbing redundant staff, creating more employment opportunities, maintaining regional stability, etc.). Moreover, in the context of China’s current economic transition, various legal systems are still incomplete, and the level of legal protections for private property rights is not high. In addition, the government controls many scarce resources (J. J. Zhang & Zhang, 2005), which they often allocate in a manner that best allows them to achieve their political goals (Shleifer & Vishny, 1997).
Studies have found that governments may either be a “grabbing hand” or a “supporting hand” (Frye & Shleifer, 1997). On one hand, the government interferes in enterprises and requires them to bear policy burdens; on the other hand, the government provides enterprises with credit financing privileges, forming a relationship between the government and enterprises with Chinese characteristics (G. M. Liao & Shen, 2014). Meanwhile, to achieve public goals such as reducing unemployment and promoting employment, the government tends to interfere with employment decisions in enterprises. According to Lin et al., government interventions on SOEs cause them to bear policy burdens such as redundant staffing. At the same time, the government is responsible for the increased costs caused by SOEs, thus SOEs may be compensated with perks such as preferential credit financing resulting in soft budget constraints in SOEs. Thus, it follows that to achieve its political and social goals, the government has to provide additional policy support to enterprises that bear more policy burdens, including providing more and longer term bank loans (Fan et al., 2008; J. Lin et al., 1998). Faccio (2006) conducted empirical research using sample data from 42 countries and found that companies with more policy burdens are more likely to obtain more convenient financing and investment projects from the government. Moreover, the phenomenon is even more pronounced in countries with strong government intervention, weak investor property rights protection, and severe corruption.
Along with the deepening of state-owned enterprise reforms, the autonomy of state-owned enterprise managers continues to increase. However, in terms of administrative decentralization, the actual control of local SOEs remains in the hands of local governments. The government has heavy public functions but limited financial resources. It often internalizes social goals such as economic development, employment, and social stability into the controlled SOEs, translating into policy burdens for SOEs (J. Lin et al., 1998). The detrimental effects of policy burdens have caused SOEs to pay more attention to the political and economic impact of corporate behavior, while deprioritizing economic performance goals (Xia & Fang, 2005). Enterprises have been at a disadvantaged in competition. Therefore, companies need various government support, and the government provides support by allowing SOEs to maintain high capital (Feng et al., 2010). However, the source of capital used by the government for support is not stable. Due to the huge amount of capital in China’s credit market, the majority of China’s banking system is directly or indirectly controlled by the state (Yuan et al., 2010). Thus, the government has focused its attention on credit resources, and banks have become the largest practical supporter of SOEs’ capital sources (Feng et al., 2010). For this reason, credit resources have been heavily biased toward SOEs (W. J. Li et al., 2012). The free credit contract between SOEs and banks was destroyed, which changed the governance mechanism of debt financing constraints, and exacerbated the problem of soft budget constraints of SOEs (X. N. Zhang, 2006).
Soft budget constraints are essentially caused by policy burdens. The main reason is that policy burdens easily cause policy losses. In the case of opaque information, the government is at a disadvantage and cannot identify whether the loss of the company stems from policy influence or the company’s operations. Meanwhile, the government will completely blame the company for its loss out of a sense of responsibility and give companies protection subsidies afterwards. As mentioned above, bank credit resource support is a major form of government protection. Therefore, SOEs that bear policy burdens have easier access to credit resources, and soft budget constraints have ensured the SOEs’ continuous credit financing capabilities. Furthermore, policy burdens intensify the imbalance of information between the government and business managers (Zhao et al., 2019), and soft budget constraints also increase dependency on government relief (Faccio et al., 2006). This makes it easier for managers to avoid corporate losses and be less cautious with investments. Therefore, policy burdens have created an ideal investment environment for companies with the impulse to expand. In this case, managers are not sensitive to the cost of funds and pay less attention to the efficient use of credit when investing. This leads to excessive investment in enterprises. However, blindly expanding its size is often detrimental for a company, and the accumulation of sunk costs requires enterprises to seek even more credit investments. This leads to a vicious cycle (Feng et al., 2010), which lowers the efficiency of the company’s credit resource allocation. Based on this phenomenon, we have formulated the following hypotheses:
The Impact of the Policy Burden of SOEs on the Value of Enterprises
The credit resources brought by the policy burden of SOEs not only reduce investment efficiency but may also cause SOEs deviate from the goal of maximizing operational performance. First, the redundant staffing burden of SOEs brings higher labor costs (J. Y. Lin & Tan, 1999), which has a negative impact on the performance of SOEs (Y. F. Lin & Li, 2004). Second, the current promotion of officials depends on their level of political performance. Thus, government officials pay more attention to the political impact of corporate investment projects and ignore its potential profitability. They require enterprises to invest in inefficient “vanity projects,” which are large investment projects with considerable short-term economic benefits but have unsatisfactory long-term investment profit prospects (X. H. Sun & Li, 2016). This leads to excessive investment and damages the enterprise’s value. In addition to the negative effects, the diversification of the goals of SOEs caused by policy burdens also reduces the sensitivity of executive compensation and performance, and distorts the executive incentive mechanism. Consequently, the moral hazard of managers increases. The possibility of using bank credit for opportunistic behavior increases, resulting in loss of the enterprise’s value (M. Zhang et al., 2013). Therefore, hypothesis H2 is proposed.
Empirical Analysis
Data Source and Sample Selection
China implemented the new accounting standards in 2007. In order to prevent the impact of accounting standards changes on the research conclusions, the samples of this article started from 2007. This section selects A-share, state-owned listed companies in Shanghai and Shenzhen stock exchanges from 2007 to 2018 as samples from the CSMAR database. We processed the data by excluding the following: (a) data specific to the financial industry such as banking and insurance, (b) enterprise data that did not include the number of employees and did not disclose the nature of the ultimate controller, (c) company data that lacked financial data, and (d) data of listed companies to eliminate the influence of extreme values. These exclusions, in addition to adjusting the main continuous variables, resulted in winsozire values in the upper and lower 1%. Moreover, data regarding the nature of property rights and the level of government control of the company were manually sorted from the annual report, and data regarding the institutional environment were obtained from the “Marketization Index Report of the Chinese Provincial Capital (2018)” compiled by X. L. Wang et al. (2019).
Model Construction and Variable Definition
Model building
To testing Hypothesis H1a, an OLS regression Model 1 is constructed to test whether SOEs that bear policy burdens will obtain more bank credit resources, which is a practice originated and is the basic prerequisite for our research.

In Model 1, the explanatory variable ΔLoan is the company’s new long-term loan, representing the bank credit resources obtained by the enterprise. The explained variable is the policy burden, which is expressed by the excess employee rate, and its estimation formula is shown in Model 5 below. Model 1 controls industry and annual effects, and other control variables are defined in Table 1. According to Hypothesis H1a, if the policy burden coefficient in Model 1 is significantly positive, it means that the heavier the policy burden on SOEs, the more bank credit resources are obtained.
Variable Names and Definitions.

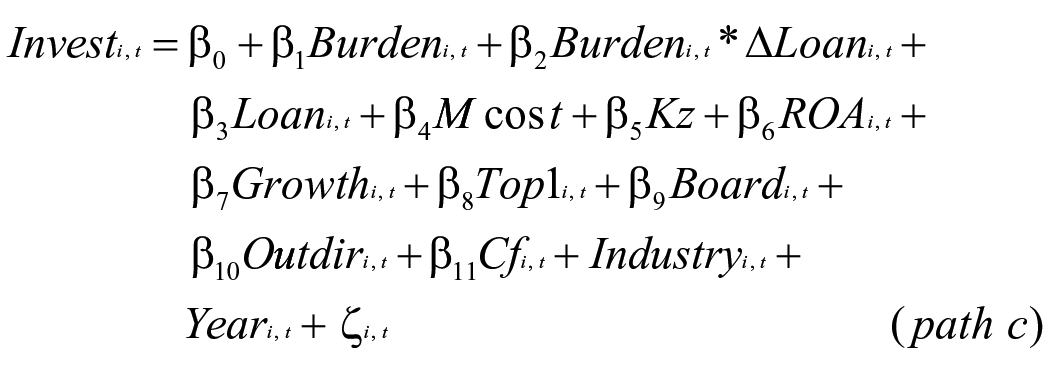
To verify Hypothesis H1b, the research of Richardson (2006) was used to construct the above OLS regression Model 2.

In Model 2, the explanatory variable Invest is an inefficient investment. The value of this variable is obtained by estimating the residual in Model 4. At that time, it indicates that the enterprise is over-investing. When Invest < 0, It suggests that the investment is insufficient. The absolute value of Invest indicates the degree of inefficiency investment. According to Hypothesis H1b, the interaction coefficient Burden × ΔLoan between the policy burden and long-term loan is expected to be positive, indicating that the interaction effect between the company and the bank’s credit resources that bear the policy burden will improve the degree of inefficient investment. Thus is, the more credit resources the SOEs with policy commitment enjoy, the greater the degree of their inefficient investment is. In addition, Model 2 also controls the annual and industry effects, and other control variables are defined in Table 1.
Based on research by H. H. Shen et al. (2012), the following Model 3 was constructed to verify H2:
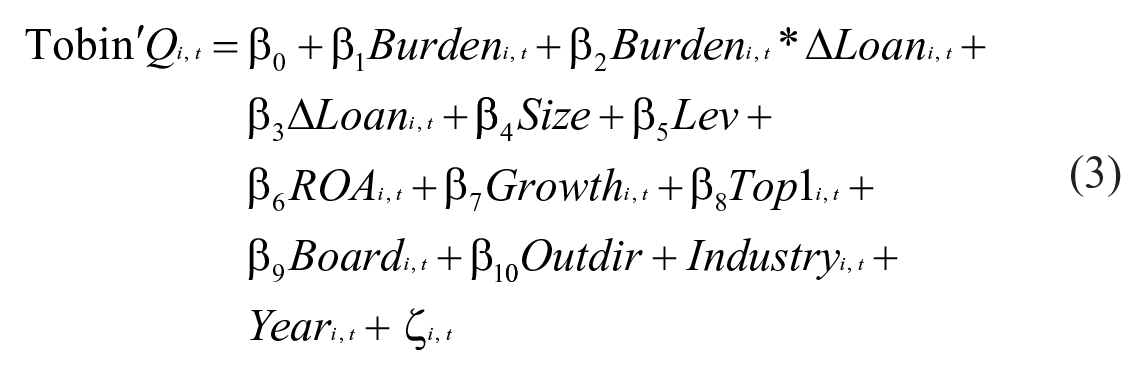
In Model 3, the explanatory variable Tobin’Q represents the value of the enterprise. According to the assumption H2, the interaction coefficient Burden × ΔLoan between the policy burden and the long-term loan in Model 3 is expected to be negative, showing that the credit resources obtained by an SOE experiencing policy burdens will reduce the enterprise value.
Variable description
Resource allocation efficiency
Based on the research methods of Wurgler (2000) and Fang (2007), the efficiency of resource allocation is reflected by investment efficiency and enterprise value. The higher the degree of inefficient investment in the explanatory variable, the lower the investment efficiency. Currently, there are many indicators to measure enterprise and domestic value. Tobin’Q is a widely used measurement indicator by many domestic and foreign scholars.
Considering the low efficiency of investment, we calculate the normal investment level of the enterprise first and then use the absolute value of the residual in Model 4 as the investment efficiency of enterprises (Invest). It shows the larger the absolute value, the lower the investment efficiency and the greater the degree of inefficient investment. The model design is as follows:

Based on the research of G. M. Liao and Shen (2014) and Wei and Liu (2007), the explained variable Invrat represents the new investment of the company:
Invrat = Capital expenditure + M & A Expenditure-Long-Term Asset Sales - Depreciation
This formula is based on the following items in the cash flow statement:
New Investment = Expenditure on constructing fixed assets, intangible assets, and other long-term assets + Expenditure on purchasing or disposing of a subsidiary (branch) company-recovered cash based on the disposal of Fixed Assets, Intangible Assets and other Long-term Assets − Depreciation expense.
Other definitions of variables for Model 1 are in Table 1.
Policy burden (burden)
This text uses the excess employee rate to measure the policy burden. Concerning the practice of G. M. Liao and Shen (2014), the company’s excess employee rate is calculated based on the correlation between the average industry income and the average amount of employees per company in the industry. The estimation formula is as follows:

In this formula, Burden is a measure of the policy burden (excess employee rate), Emp_firm is the average number of employees in the industry where the company is located, and Sales_ind is the average sales income of the industry in which the company is located. The industry classification in this article is based on the “Guidelines for the Industry Classification of Listed Companies” revised by the China Securities Regulatory Commission in 2010. The manufacturing industry is classified by the first two codes, and the other industries are classified by the first code.
Credit resources (ΔLoan)
This article uses newly added long-term loan to measure credit resources. The calculation method is
Compared with long-term loans which are often used for investment, short-term loans are generally used by enterprises for production and operation. Since the variable Invrat has been explained in this article, the efficiency of resource allocation is measured by inefficient investment and corporate value. This article applies to new long-term loans to measure bank credit resources to show that the more long-term loans issued by a bank, the more credit resources a bank has.
Control variables
The control variables in Model 2 include profitability (Roa), which is net profit divided by total assets; corporate growth (grow), which is expressed by the growth rate of main business income; board size (Board), which is equal to the natural logarithm of the number of board members; capital intensiveness (Capital), which equals to net fixed asset value divided by operating income; corporate operating cash flow (Cf), which is measured by the ratio of net operating cash flow to total assets; and the proportion of independent directors (Outdir), which accounts for the number of independent directors divided by the total number of board members. The definitions of the control variables and related moderator variables in Models 1–4 are shown in Table 1.
Empirical Results
Statistical Results
Table 2 reports the statistical results of the main variables in the above model. From the results of samples, the average and median new long-term loan (ΔLoan) of the company are 0.009 and 0.008, respectively. The standard deviation of 0.103 indicates that the company’s long-term loans increased slightly, and the average value of inefficient investment (Invest) is 0.059. The median is 0.035 and the standard deviation is 0.076, suggesting that the inefficient investment of the sample companies is mainly an over-investment phenomenon; the mean and median of the enterprise value (Tobin’Q), which are 2.641 and 1.634, respectively, which shows that the value of the company is gradually increasing. The minimum enterprise value is 0.152 and the maximum value is 17.834, which is quite a large difference. The average policy burden is −0.372, and the median is 0.142, which is indicative of the SOEs in China having redundant staff. The minimum value of policy burden is −8.533, and the maximum value is 2.105. The range of values shows that redundancies in SOEs can be relatively large.
Statistical Results of Main Variables (Observation N = 4,468).

Analysis of Regression Results
Column 1 of Table 3 reports the regression results of Model 1. The explained variable is a long-term loan (ΔLoan). The estimated coefficient of policy burden is significantly positive at the 5% level. This conclusion lays the foundation for subsequent research, which suggests that after controlling other influencing factors. To examine the impact of long-term loans obtained by enterprises bearing policy burdens on inefficient investment, we substitute the residuals calculated by Model 4 (inefficient investment) into Model 2 and perform a regression. Columns 2, 3, and 4 in Table 3 are the regression results of Model 2. The explained variable is an inefficient investment which mainly examines the efficiency of credit resource allocated to SOEs that bear policy burden. In Table 3, Columns 2, 3, and 4 reflect three investigation results: the full sample, under-investment, and over-investment. The impact of long-term loan resources on the inefficient investment of SOEs that bear policy burden is shown in Table 3. Column 5 is the regression result of Model 3. The explained variable is enterprise value (Tobin’Q). It mainly investigates the value of long-term loans obtained by SOEs that bear policy burden but also reflects credit resource allocation efficiency from another aspect.
Regression Results of Policy Burden and Credit Allocation Efficiency.

Note. The t value appears in parentheses.
*, **, and *** indicate statistical significance at the 10%, 5%, and 1% levels, respectively.
In Column 2, the coefficient of interaction (Burden × ΔLoan) between policy burden and the long-term loan is significantly positive at 5% level, which indicates that the long-term loans obtained by SOEs to bear the policy burden increase the inefficient investment, that is, reducing the investment effectiveness. Hypothesis 1 is verified. In Columns 2 and 3, under the conditions of under-investment and over-investment, although the coefficient between policy burden and long-term loan is negative, only under the over-investment sample of Column 4, the coefficient of interaction (Burden × ΔLoan) on policy burden and long-term loan is significantly positive at the level of 1%, while Column 3 is not significant, it indicates that the long-term loans obtained by the SOEs to bear the policy burden are mainly aggravated by excessive investment behavior, and the under-investment impacts turn out to be small. In addition, the coefficient of interaction (Burden × ΔLoan) between policy burden and long-term loan of Column 5 which is significantly negative at 1% indicates that the interaction between the SOEs and bank credit resources that bear the policy burden reduces the enterprise value. Therefore, Hypothesis 2 is verified. From the perspective of investment efficiency and corporate value, the policy burden of SOEs reduces the efficiency of credit resource allocation.
Robustness Test
To ensure the robustness of the results, we test from the following aspects.
Endogenous test
This article draws on the research of Liu et al. to avoid possible endogenous problems caused by missing variables.
Instrumental variables combined with two-stage least squares tests are included: one instrumental variable has been used to test robustness in the first-stage regression is political and economic distance (Destan), thereby affecting policy burden, long-term loans, and the interaction between the two. Another instrumental variable in first-stage study is the industry average burden of redundant employees in SOEs (sta_ind). The political and economic distance is equal to the distance between the longitude and latitude of the capital city where the company is located, Beijing, and then divided by 10,000. The industry average burden of redundant employees in SOEs is calculated by Model 1 and then the industry average is calculated. There are two reasons for choosing instrumental variables. First, for the perspective of geographic economics, political and economic distance is closely related to the level of the regional legal system. It turns out that the regions close to the political and economic centers will be in line with the central government, so those companies will be at the forefront of promoting the reduction of policy burden. Second, the industry average burden of redundant employees in SOEs is related to the redundant burden of each enterprise, but the effective tax rate and investment efficiency of the enterprises are exogenous variables.
In this article, Table 4 uses the political and economic distance and the industry average burden of redundant employees in SOEs as instrumental variables to illustrate the second-stage regression results of Models 1, 2, and 3. Due to space limitations, we did not report the first stage. The selection of biological variables passes the weak instrumental variables and over-identification test. Column 1 in Table 4 indicates that the coefficient of policy burden is significantly positive at 5%, Burden × ΔLoan in Column 2 is significantly positive at 5%, Column 3 shows under the circumstance of insufficient investment, the impact of policy burdens and long-term loans on inefficient investment is not significant; and Column 4 indicates that when there is too much investment, the interaction coefficient of Burden × ΔLoan is at 5%. This result is significantly positive, reflecting that the interaction between policy burdens and long-term loans has exacerbated the degree of over-investment. The above results are consistent with the assumptions of H1a and H1b in this article. Column 5 is the regression result of the Model 3, whose explanatory variable is enterprise value (Tobin’Q). The interaction (Burden × ΔLoan) coefficient, which is significantly negative at 1%, suggests that the interaction effect comes from SOEs’ Policy burdens and long-term loans can reduce corporate value; therefore, assumption H2 is further supported.
Endogenous Test of Policy Burden and Efficiency of Credit Preferential Resource Allocation.

Note. The t value appears in parentheses.
*, **, and *** indicate statistical significance at the 10%, 5%, and 1% levels, respectively.
The Propensity Score Matching (PSM) test
In order to avoid this endogenous problem of mutual causality, this article uses neighbor matching, kernel matching, and radius matching methods to test the policy burden. As the excess employee rate is a continuous variable, the dummy variables need to be grouped and matched for PSM. Therefore, this article groups the excess employee rate previously calculated by Model 5 according to the median. The rate of over employment exceeding the median means that it bears a policy burden and is regarded as the treatment group (Treat). Rates lower than the median means there is no policy burden and is regarded as the control group (Control). The dependent variable in Table 5 of Panel A is the long-term loan (ΔLoan), which is used to test whether the SOEs bears the policy burden (Burden) is conducive to obtaining credit resources. The dependent variable of Panel B is an inefficient investment (Invest), which examines the effect of the interaction (Burden × ΔLoan) between the policy burden and credit resources undertaken by SOEs on inefficient investment. Panel C tests the impact of the interaction (Burden × ΔLoan) of the policy burden and credit resources on the enterprise value (Tobin’Q) of the national enterprise.
PSM Regression Test of Policy Burden and Financial Subsidy Effectiveness.

Note. The t value appear in parentheses. PSM = propensity score matching.
*, **, and *** indicate statistical significance at the 10%, 5%, and 1% levels, respectively.
The results of Panel A, Panel B, and Panel C in Table 5 show that the average processing effects of nearest neighbor matching, kernel matching, and radius matching are significantly different from 0 at the 1% level, suggesting that the PSM test results support the hypotheses H1a, H1b, and H2, which indicates that the conclusion above is robust.
The fixed effect mode
The fixed effect model can handle the problem of missing variables which does not change with time. We try to use both fix effect model and random effect model, but the Hausman test results only support fixed effect model. The test results of fixed effect model are shown in Table 6, which further supports the previous hypothesis.
The Fixed Effect Results of Policy Burden and Efficiency of Credit Preferential Resource Allocation.

Note. The t value appears in parentheses.
*, **, and *** indicate statistical significance at the 10%, 5%, and 1% levels, respectively.
Variable substitution method
Policy burden was measured based on methods established by L. L. Zhang et al. (2015) and F. M. Liao et al. (2019). We constructed Model 6 to measure the policy burden by the absolute value of the residual (ε). When the residual is positive, it is a strategic burden, and when the residual is negative, it is a social burden.
In Model 6,
Thus, the policy burden measured by Model 6 is substituted into Models 1, 2, and 3 for regression. The regression results are identical to those in Table 3. Due to space limitations, this result is not reported, but can be obtained from the author upon request.
Further Analysis
This section presents analysis of cross-sectional differences and impacts paths of policy burdens and credit resource allocation efficiency of SOEs.
Analysis of cross-sectional differences: The degree of marketization, level of government control, and information transparency
This article uses the degree of marketization, the level of government control, and the transparency of information as moderating variables to perform cross-sectional difference analysis. The degree of marketization uses the marketization index of each region compiled by X. L. Wang et al. (2019). The government control level distinguishes between centrally and locally controlled SOEs. Accounting for transparency information comes from the research of Bhattacharya et al. (2003) and Y. Zeng and Lu (2006), using the weighted average of earnings aggressiveness and earnings smoothness to measure information transparency. Earnings aggressiveness refers to a tendency for companies to use discretionary accruals to accelerate the recognition of revenues and delay the recognition of losses. Earnings smoothness refers to the correlation coefficient between changes in accrued items and changes in cash flow in the corresponding year. The greater the earnings aggressiveness, the lower the transparency of accounting information, while the greater the smoothness of the earnings, the lower the transparency of accounting information. This study also uses the weighted average of the two indicators (earnings aggressiveness and earnings smoothness) to characterize the transparency of accounting information.
Table 7 illustrates the regression results of Model 2 in different cross-sectional situations. Under different marketization levels, government control, and information transparency, it reports the investment efficiency of long-term loans by the SOEs that bear the policy burden. The standard degree of marketization is grouped by the median degree of the sample, distinguishing between high and low levels of marketization. Those greater than or equal to the median are treated as high degrees of marketization and those less than the median are indicated as low degrees of marketization. Different levels of government control are divided into central and local SOEs. Information transparency is based on the median of the company’s weighted average annual earnings aggressiveness and earnings smoothness, which are divided into high and low groups. Information transparency greater than or equal to the median makes up the lower group, and those lower than the median makes up the group with higher information transparency. Columns 1 and 2 are used to reflect the impact of policy burdens and long-term loan resources on inefficient investments under the level of marketization. Columns 3 and 4 suggest that under the different control levels of governments, SOEs bear the policy burden and the impact of long-term loan resources on inefficient investment. Columns 5 and 6 show the impact of inefficient investment, under different information transparency conditions, which is caused by SOEs’ policy burdens and long-term loan resources.
Regression Results of Policy Burden and Credit Preference Resource Allocation Efficiency Under Cross-Sectional Differences.

Note. The t value appears in parentheses. SOE = state-owned enterprise.
*, **, and *** indicate statistical significance at the 10%, 5%, and 1% levels, respectively.
We use the inefficient investment calculated in Model 4 to substitute the explained variables in Model 2 to perform regression and examine the efficiency of credit resource allocations obtained by the policy burden of enterprises under different cross-sectional situations.
Column 1 in Table 7 suggests the coefficient of interaction term (Burden × ΔLoan) between policy burdens and long-term loans, which is significantly negative at 10%, indicating that in regions with a high degree of marketization, the credit resources enjoyed by SOEs that bear policy burden have reduced inefficient investment. It is possibly that credit resources in regions with a high degree of marketization have reduced under investment. The interaction (Burden × ΔLoan) coefficient between policy burdens and long-term loans in Column 2 is significantly positive at 1%, indicating that in regions with low marketization, the interaction effect of policy burdens and long-term loans improves inefficient investment. In summary, Columns 1 and 2 in Table 4 show that compared with SOEs in regions with high marketization, the greater the credit resources obtained by SOEs through policy burdens in regions with low marketization, the greater their inefficient investment will be.
Based on the sample of central SOEs in Column 3 of Table 7, the coefficient of the interaction term (Burden × ΔLoan) between policy burdens and long-term loans is positive but not significant. Based on the sample of local SOEs in Column 4, the coefficient of the interaction term (Burden × ΔLoan) between policy burdens and long-term loans is significantly positive at 5% (the coefficient test between the two sample groups is significant), suggesting that compared to central SOEs, the interaction effect of the local SOEs enterprises’ policy burden and credit resources reduces investment efficiency. The results of Columns 3 and 4 in Table 4 show that compared with central SOEs, the heavier the policy burden is on local SOEs is, the more credit resources are receive, and the greater the degree of inefficient investment.
In Column 5 of Table 7, the coefficient of the interaction term (Burden × ΔLoan) between policy burdens and long-term loans is significantly negative at 5%, indicating that in enterprises with higher information transparency, the credit resources enjoyed by SOEs that have reduce investment inefficiencies.
As can be seen, the coefficient of the interaction term (Burden × ΔLoan) between policy burdens and long-term loans in Column 6 is significantly positive at 5% (and the coefficient test between the two sample groups is significant at 5%), suggesting that the information is less transparent. The more credit resources the SOEs that bear the policy burden have, the greater the degree of inefficient investment. Therefore, compared with higher information transparency, the interaction effect of SOEs increases the degree of inefficient investment. These companies suffer from policy burdens and long-term loans with less information transparency. Accordingly, the improvement of information transparency can mitigate the negative impact of policy burdens and credit resources on investments.
Intermediary effect tests
It has been shown that SOEs without policy burdens experience reductions in resource allocation efficiencies when they obtain policy burdens and credit resources. To further examine the impact of policy burdens and credit resources on efficient resource allocation, the work in this article can be tested from two aspects: management agency costs and financing constraints. The reason why the agency cost of management is selected as the intermediary is that the decrease in investment efficiency is often related to the opportunistic behavior of management. Thus, we select the financing constraint as the intermediary is that the strength of the financing constraint directly affects the investment efficiency.
Referring to Baron and Kenny’s test method of intermediate effect, Mediation Tests models Paths a, b, and c are as follows:


Management agency cost (Mcos) and the degree of financing constraints (Kz) are intermediate variables in the model. Given the method of Ang et al. (2000) and S. X. Li (2007), we use the management expense ratio (Mcos to represent the management agency cost). The calculation formula: the ratio of management expenses and operating income. This indicator mainly reflects the degree of resource waste caused by a manager’s on-the-job consumption. The larger the management Mcos is, the higher the agency cost will be. The financing constraint intensity is based on the method of Kaplan and Zingales (1997). A higher Kz index indicates stronger financing constraint, and a lower index indicates a lower financing constraint. For the definition of other variables, see Table 1.
The principles of the mediation effect test are as follows: First, (I) if the coefficient in path a and path b are significant, (II) the median variable coefficient in path c is significant, and (III) the median coefficient β2 in path c is not significant, but the statistical test of SOBEL is significant, then the full mediation effect is established. Second, if the above conditions (I) and (II) are satisfied, β2 is significant in path c, but is significantly smaller than in path a, and the SOBEL test is significant, then part mediators effect are established.
Table 8 uses the agency costs of management and corporate financing constraints as the mediating variables. Among them, Columns 2 and 3 are the regression results of path b. The dependent variables, respectively, reflect management expense ratio of the agency cost (Mcost) and financing constraint strength’s Kz index. The control variables are asset size and financial leverage, and the control variables are consistent with Model 2. Columns 1 and 4 are the regression results of Model path c.
Intermediary Test of the Policy Burden of SOEs and the Allocation Efficiency of Preferential Credit Resources.

Note. The t value appears in parentheses. SOE = state-owned enterprise.
*, **, and *** indicate statistical significance at the 10%, 5%, and 1% levels, respectively.
First, we centralize all variables (the mean value is zero) and then test whether the independent variable has a significant impact on the coefficient of dependent variable in path a. Column 1 in Table 8 shows the correlation coefficient between the policy burden and credit resource multiplication term is 0.307, and it is significantly positive at 5%, indicating that the interactive effect of correlation improves inefficient investment.
Second, we test whether SOEs that suffer policy burdens and credit resource allocation will reduce management agency costs and whether they will reduce financing constraints. The results in Table 8 show that Column 2 reports the results using the management expense ratio (Mcost) as the dependent variable. The coefficient of the interaction (Burden × ΔLoan) is 0.038, which is significantly greater than zero at 1%. The more loans a policy burdened SOE that bears, the higher the agency cost of management. Column 3 suggests the financing constraint (Kz) as the regression result of the dependent variable, and the interaction (Burden × ΔLoan) coefficient is −0.034, which is significantly different from 0 at 5%. All suggest that the more credit resources the SOEs bear for the policy burden, the lower the financing constraints.
Third, we examine the effects of manager agency costs and financing constraints on investment efficiency. Column 4 in Table 8 shows the coefficient of management cost ratio (Mcost) is significantly greater than 0 at 5%. The conclusion is that the higher the SOE agency cost, the greater the degree of inefficient investment. In Column 4, the Kz coefficient is significant and lower than zero at 5%, indicating that the smaller the financing constraints, the greater the inefficient investment.
Finally, we examine the change in the regression coefficient of Burden × ΔLoan. In Table 8, the interaction (Burden × ΔLoan) coefficient is 0.119 in Column 4, which is smaller than the interaction coefficient (0.307) in Column 1. Under the median variable of agency costs and financing constraint, the Z value in the SOBEL test is all significant at 1%. That is, β2 is significant in path c, which is lower than that in path a. Therefore, it can be seen that agency costs and financing constraints play a part in the mediating role between the policy burden of SOEs and the efficiency of credit resource allocation.
Conclusion and Recommendations
Currently, China is in a critical period of comprehensively deepening reforms, and the scarcity of resources is more prominent than in recent years. Studying the efficiency of the allocation of credit resources is of great significance to China’s comprehensively deepening reforms. This article selects A-share, state-owned listed companies in Shanghai and Shenzhen stock exchanges from 2007 to 2018 as a sample. We examine the impact of the policy burden of SOEs on credit resources and their allocation efficiency. The study found that the heavier the policy burden of SOEs, the more credit resources they acquire. However, once SOEs obtaining credit resources, they are more likely to make inefficient investments. These credit resources harm the value of SOEs that bear the policy burden. Moreover, it indicates that the policy burdens of SOEs reduce the efficiency of credit resource allocation. Further analysis shows that the above-mentioned negative effects of policy burdens are more significant in SOEs with low degree of marketization in the region, low level of government control, and low information transparency. Inspection of the intermediary mechanisms suggests that the policy burden of SOEs will reduce investment efficiency by increasing management agency costs and reducing financing constraints. Our research conclusions have enriched the research of policy burdens in state, further broadened the analytical framework for credit resource allocation efficiency, and have implications for how relevant government departments can improve resource allocation efficiency.
Based on our analysis, we get the following policy recommendations:
First, government should reduce the policy burdens of SOEs, especially the problem of excess employees, to decrease the inefficient investment of SOEs and increase the value of the enterprises. Local governments must effectively reduce the policy burden of local SOEs and simplify the administration and decentralization of enterprises. Local SOEs should be given more autonomy to respond quickly to market demands and better coping with market challenges.
Second, the state must take a step to promote market-oriented reforms and enhance the degree of marketization. The government must distinguish between different levels of marketization and introduce different policies that introduce measures to ease employment pressure and reduce the policy burden on SOEs in areas with lower levels of marketization. In terms of government resources, we cannot simply grant banks credit resources based on whether the company bears policy burdens such as redundant staffing or not. Instead we should evaluate the company’s operating performance and the use of credit resources in the early stages to determine whether the government will support corporate credit in the future.
Third, SOEs should actively respond to national policies and implement in-depth mixed ownership reforms. By introducing non-state-owned shareholders to effectively supervise and encourage SOE executives, management agency costs can be reduced and the efficiency of policy resource allocation can be increased.
Footnotes
Acknowledgements
This article is supported by National Social Science Foundation of China (Political Burden of State-owned Enterprises, Transparency of Accounting Information, and Efficiency of Government Preferential Resource Allocation Efficiency, Project Number: 16BGL047). Songqin Ye is the corresponding author of this paper. Authors appreciate the valuable comments from editors and anonymous referees.
Declaration of Conflicting Interests
The author(s) declared the following potential conflicts of interest with respect to the research, authorship, and/or publication of this article: We would like to submit the enclosed manuscript entitled “Policy burden of state-owned enterprises and efficiency of credit resource allocation: Evidence from China,” which we wish to be considered for publication in “SAGE Open.” No conflict of interest exits in the submission of this manuscript, and manuscript is approved by all authors for publication. I would like to declare on behalf of my co-authors that the work described was original research that has not been published previously, and not under consideration for publication elsewhere, in whole or in part. All the authors listed have approved the manuscript that is enclosed.
Funding
The author(s) disclosed receipt of the following financial support for the research, authorship, and/or publication of this article: This article is supported by National Social Science Foundation: “Political Burden of SOEs, Transparency of Accounting Information, and Efficiency of Government Preferential Resource Allocation Efficiency,” Project Number: 16BGL047.