
Abstract
Exposure to risk may be seen as one of the many dimensions of poverty. Household exposure to risk consequent upon different types of shocks often leads to undesirable welfare outcomes. A shock can push an already income-poor household further into poverty or drive a non-poor household below the income poverty line. Risk appears to be one of the major challenges many households face in developing economies especially in the Sub-Saharan Africa. As a result, these issues have become central in the policy agenda not only in these countries but also in the international multilateral institutions. This study examines the exposure to risks in urban and rural areas and its effect on household vulnerability to poverty in Nigeria. The study applied the framework that computes vulnerability as expected poverty on the Nigeria General Household Survey for 2015 and the cross-sectional data and three-stage feasible generalized least squares analysis were employed. Findings show that exposure to risks such as job loss, business failure, harvest failure, livestock death, dwelling demolition, increase and decrease in input and output prices, and other similar risks significantly drive households into poverty but differ across households in rural and urban areas, both in characteristics and regions. These findings suggest that social safety nets should be designed to take care of not only the current poor households but also the non-poor households who are likely to be vulnerable in the future.
Introduction
Exposure to risk may be viewed as one of the numerous components of poverty. Household exposure to risk consequent upon different types of shocks often leads to undesirable welfare outcomes (Hoogeveen et al., 2004). Shocks can push an income-poor family unit more into poverty or force a non-poor family beneath the income poverty line (Koomson et al., 2020). Risk is part of the several obstacles many households encounter in developing countries particularly in the Sub-Saharan Africa. Thus, these issues have turned out to be central in the policy agenda in these nations as well as in the international multilateral institutions.
Dercon (2005) showed that the most common cause of risk in the third world is related to the rainfall and climate pattern, which results in drought and flood, and these are mostly faced by rural agricultural households. Satterthwaite et al. (2007) posited that the level of damage to urban populations and economies caused by severe weather events in some years highlights their vulnerabilities. They argued that urban areas often suffer from risk of flooding when rainfall occurs. This, according to them, is because buildings, roads, infrastructure, and other paved areas impede rainfall from penetrating into the soil and consequently produce more runoff. In most cases, heavy and prolonged rainfall can easily overcome drainage systems and destroy homes leaving thousands of households homeless and vulnerable. This is not restricted to developing countries alone. The devastation of New Orleans by Hurricane Katrina in 2005 is one example of how vulnerable households could be when they are exposed to certain types of covariate shocks in high-, middle-, and low-income countries.
Evidence has pointed to the geological and topography disasters and their threat to rural areas. Xu et al. (2017) has shown that sudden occurrence of geological and topographical disasters are capable of depleting the wealth of farming household that may have been accumulated over decades. Although exposure to risk and vulnerability may not depend on the effect of climate change alone but because the poor have not many resources and receives less assistance from family, community, financial system, and even social safety nets to avert, mitigate certain eventualities, they may be prone to many risks. This can make them get trapped in poverty over time (Huq et al., 2007; UN-HABITAT—United Nations Human Settlements Program, 2011; World Bank Group, 2016).
Nigeria is part of the third world, and households in the country face different types of exposure to shocks and risks. Mba (2016) identified most common types of shocks faced by the households as illness or death of income earner, theft, business failure, dwelling demolition, fire or flood destroying farmlands, long period of unemployment, and rise in price of inputs and food stuffs. Others include property loss and kidnapping of household member. One interesting thing about the country’s case is that these shocks are also common in the urban areas such that it is hard to distinguish the distribution of risk exposure in both rural and urban areas and how it affects households’ vulnerability. According to Olorunfemi (2011), between 1983 and 2009, flooding affected over 3 million people in selected urban areas in Nigeria. He argues that climate change is probably the major cause in many of this. But even if it was not, it is an indication of the extent of vulnerability of urban populations to floods whose frequent occurrence, intensity, and climate change effect are likely to multiply in some places.
Since the 1980s, Nigeria’s macroeconomic and social indicators have not been very impressive. The United Nations Development Programme’s (UNDP) Human Development Index (HDI) of 0.462 positions the nation 142 out of 169 nations in 2010. With assessed Gross National Income (GNI) per capita of US$2,156, life expectancy at birth was estimated at 48.4 years, and Multidimensional Poverty Index (MPI) was 0.368 (UNDP, 2010). Since 2010, only little progress has been made in terms of HDI which increased to 0.467 in 2011 and further to 0.471 in 2012. The percentage of the population vulnerable to multiple deprivations is estimated at 17.8%, with about 54.1% of the population beneath poverty line in 2004 of which 36.6% of the adult population are living in extreme poverty (UNDP, 2013). In 2010, the Headcount Index was estimated at 69% showing an increase in the number of the poor compared with the 2004 estimate, while the 2014 and 2015 HDI value of 0.514 placed the country 152 out of 188 countries. The recent increase in the number of displaced persons across the country due to rising insurgency in the North East geopolitical zones, the resurgence of militancy in the Niger Delta region, and pockets of border disputes in some other parts of the country may have significantly increased households’ vulnerability to poverty. Adepoju and Yusuf (2012) argue that poverty remains an overwhelming challenge as about 67% or two thirds of the rural population were poor by 2006 Core Welfare Indicators Survey report. It could be the case that the rate of households’ risk and vulnerability in Nigeria is so high that several poverty alleviation efforts such as the National Economic Empowerment Development Strategies (NEEDS), Sustainable Development Goal (SDG), 7-Point Agenda, Vision 20:2020, and upward reviews of salaries and pensions embarked upon by the governments at all levels did not make reasonable impacts as risk mitigation mechanisms. If these poverty alleviation measures were properly targeted, their failure to reduce poverty incidence is a clear indication that the issue of risk and vulnerability should be adequately studied to come up with sound policy recommendations. According to Alayande and Alayande (2004), it is not evident whether the nation needs adequate ability to alleviate the social dangers looked by families or whether the nation has not given adequate consideration to the issues of risk and vulnerability that are imperative for comprehension of the elements that regularly lead households to never-ending poverty.
Previous research efforts in the area of poverty and income distribution in Nigeria, among others include Alayande and Alayande (2004); Oni and Yusuf (2008); Oyekale and Oyekale (2010); and Adepoju and Yusuf (2012). However, these studies failed to address how household exposure to covariate (correlated among individuals) and idiosyncratic (affect individuals in an unrelated manner) shocks in urban and rural areas affect their vulnerability to poverty. The study adds to the existing literature by exploring how various types of risk factors such as price increase in food items/input, price decrease in output/kidnapping/robbery/hijacking, harvest failure due to poor rain/flooding/pest/fire, dwelling demolished, theft crops/livestock, job loss, property loss, livestock death, death adult working/remittance sender, business failure, loss of important contact, and illness of income earner (which were not captured in earlier surveys) affect household vulnerability to poverty in urban and rural areas.
Literature Review
Households often experience changes in their income and consumption as a consequence of shocks resulting from risk. Bird et al. (2002) emphasize that vulnerability to risk is indistinguishable from the concept of vulnerability to shock and viewed vulnerability as a source of poverty and risk appear to be a forerunner to vulnerability. They pointed to the linear depiction of exposure to risk and vulnerability, that is, risk exposure to shock, to erosion of assets that increased vulnerability to shocks, and then shift into persistence of poverty.
Dercon (2004) is one of the researchers who first studied effects of risk and implications on household consumption. Dercon examined the determinants of consumption growth (1989–1997) using long panel data, spanning 1989 to 1997 from villages in rural Ethiopia with a micro-growth model. The major focus of Dercon’s paper was to determine whether shocks influence growth and whether rainfall-related shocks have a significant effect on consumption growth. Results show that rainfall-related shocks and consequently the starvation crisis have persistent effects on welfare misfortunes because of the absence of protection and social safety nets, and these are well past the welfare cost of short-term consumption variances.
Since Dercon’s study, a number of researchers have carried out related studies in Sub-Saharan Africa as well as in other developing countries. For example, Günther and Harttgen (2006, 2009) examined issues of effect of idiosyncratic and covariate shocks on households’ vulnerability in Madagascar by broadening the framework put forward by Chaudhuri et al. (2002). This they did by introducing multilevel analysis which permits a separation between the unexplained change of the household level and unexplained fluctuations of the community level, and furthermore correct for wasteful estimators due to introduction of variables from different levels into the consumption regression. Their findings showed that covariate and idiosyncratic shocks have huge effect on rural households’ vulnerability, whereas idiosyncratic shocks significantly determine urban households’ vulnerability to poverty.
Fischer and Buchenrieder (2010) inquired into the theoretical connections between poverty, vulnerability, and risk exposure in Northern Vietnam, with risk management strategies and vulnerability to poverty laying the analytical framework. Results suggested that restricted endowment, opportunity to capital assets and service institutions, as well as human and economic risks are the main factors influencing rural livelihoods. Restricted access to sufficient risk management strategies increases household’s vulnerability, submerging them more into poverty. Their findings appear different from the notion that well-being of household is dependent on its average income and expenditure but that risk and vulnerability play an influential part in poverty.
In Ecuador, Ligon (2011) presented method for computing risk, vulnerability, and inequality using expenditure data from repeated cross-sectional household from 1995 to 2006. Results showed that individual household’s risks increased translating into higher inequality and the level of rural risks is much greater than the urban, and tend to be the outcome of spatial shocks, while urban risks are much more idiosyncratic in nature. This implies that it is not clear in identifying either the rural or urban environment as being more vulnerable.
Azam and Imai (2012) studied the source of household vulnerability in rural Bangladesh using two-level random intercept model to estimate anticipated mean and consumption variance. Their results showed that both idiosyncratic and covariate risk have large effect on households’ consumption vulnerability to poverty. Their findings further showed that idiosyncratic shocks have a relatively large effect on the richer households, and covariate shocks have a comparatively higher effect on the vulnerability of poorer and less educated households. The conclusion of their study is that rural vulnerability in Bangladesh is mainly poverty influenced instead of risk induced. Their findings thus corroborate that of Günther and Harttgen (2009) in Madagascar.
A limited number of studies have looked at vulnerability in urban and rural areas in Nigeria. These studies include Oni and Yusuf (2008), Oyekale and Oyekale (2010), Adepoju (2012), and Mba et al. (2018), among others. For example, Oni and Yusuf (2008) examined the determinants of anticipated poverty among rural households using data from merged household survey and the national consumer survey data of 1996. They found that both idiosyncratic and covariate factors impact the expected log per capita consumption of rural household, and the overall anticipated poverty for the country at 0.535 is 1.02 times the perceived poverty in 1996. Their study shows that higher anticipated poverty is correlated with living in the North East, no formal education, farming, older head of household, large household size, and male-headed household. They found that consumption fluctuation is lofty for households whose heads have secondary education, while no formal education households have low mean anticipated consumption.
Oyekale and Oyekale (2010) utilized the three-stage feasible generalized least squares (FGLS) to examine anticipated poverty with the 2004 Nigeria Living Standards Survey data. Their study showed that excessive agricultural input price and absence of capital were encountered by the biggest extent of the households. Their results also showed that many families were largely defenseless in rural areas of states like Jigawa, Kebbi, Zamfara, Yobe, Kogi, Taraba, and Sokoto. This was also among male-headed households; and families with expansive number of dependents. Adepoju and Yusuf (2012) investigated vulnerability and poverty in rural south west region with regional panel data and a multistage sampling approach. Some recent studies have actually considered poverty, gender inequality, and access to finance (Nwosu & Orji, 2017) and household consumption and inequality (Nwosu et al., 2018). However, none of these studies could unravel the issues involved in risk and vulnerability to poverty. Their approaches appear to be leaving gaps that require attention of expanding the focus to other quantitative dimensions of poverty, not only income poverty and vulnerability head count but also issues of seasonality and other social risks in their concern, and their effect on household consumption.
Method
Different approaches can be used to study the concept of vulnerability. These are vulnerability as expected poverty (VEP) proposed by Chaudhuri et al. (2002), vulnerability as low expected utility (VEU) proposed by Ligon and Schechter (2003), and vulnerability as uninsured exposure to risk (VER) proposed by Tesliuc and Lindert (2002). VEP focused on vulnerability as probability of household falling into poverty in future in terms of welfare and consumption. VEU measure and compare the difference between utility obtained from some level of certain consumption which the household would not be considered vulnerable at the expected utility and VER with method based on ex post assessment of the level to which a negative shock leads to welfare loss. The methods share a common feature because all of them build model that predicts a measure of welfare. Albeit, they have some weaknesses such as the use of estimations in VEP across a single cross-section necessitates strong assumption that the cross-sectional variability represents temporal variability (Hoddinott & Quisumbing, 2003). The disadvantage of the VEU is that it is inappropriate to account for an individual’s risk preference, given that individuals are ill-informed about their preferences especially those related to unknown events (Kanbur, 1987). For VER, in the absence of panel data, it is not possible to measure the effect of shocks such as flood and drought as ex ante and ex post consumption, and income data are in most cases not included in cross-sectional household-level datasets (Deressa et al., 2009). The VEP and VEU share two attributes to be specific: They make allusion to benchmark for the welfare pointer and articulate a likelihood of falling below this benchmark. Their approaches estimate vulnerability at individual dimension, summing over all people or households to give a proportion of total vulnerability. VER as indicated by Hoddinott and Quisumbing do not quantify vulnerability because they do not construct probability. Rather, VER evaluate whether shocks create welfare losses (Oni & Yusuf, 2008).
The non-availability of panel data in some developing countries has limited research efforts in the area of household vulnerability analysis. Interestingly, recent developments in micro-econometric modeling have made it relatively possible to analyze vulnerability using cross-sectional data. The VEP index by Chaudhuri et al. (2002) and three-step FGLS methodology by Günther and Harttgen (2006) for measuring and estimating household’s vulnerability to covariate and idiosyncratic risk were adopted for this study.
Model Specifications
Cross-sectional analysis
The basic hypothesis behind this methodology (Günther & Harttgen, 2006) is that (a) the error term in a cross-sectional consumption regression or the unexplained component of households’ consumption model captures the effect of covariate and idiosyncratic shocks, and (b) this variance in the cross-sectional also explains intertemporal variance in consumption. This assumption implies that the variation in consumption can be explained by household- and community-level characteristics. Hence, the impact of shocks on consumption variation is correlated with the observed variables.
To describe this approach empirically, let the household’s i consumption in time t be specified by a set of variables Xi. Thus, the functional relationship for this household consumption can be presented as

where lnConsexp
i
is the natural logarithm of household per capita consumption and for simplicity, the vector

On heteroscedasticity, Chaudhuri (2000) argues that the variance of the error term in Equation (1) reflects the effect of shocks on consumption. Hence, applying ordinary least squares (OLS) in Equations (1) and (2) would therefore lead to unbiased but inefficient coefficient estimates for
To overcome the problem of heteroscedasticity, Equation (1) will be reduced to a model where the residuals µ
i
have a homogeneous variance. Chaudhuri (2000) suggests that the coefficients
In the third step, each household’s expected mean and variance of consumption are estimated with the consistent and asymptotically efficient estimators


Following Chaudhuri et al. (2002), household vulnerability

where Xh is the observable household characteristics (household size, location, household head, occupation, marital status, age, etc.), lnConexp
h
is the log of per capita household consumption, lnZ represents log of minimum consumption/income beyond which a household would be considered poor, and
If
If
Not vulnerable group.
The vulnerability estimates are reported with the household per capita expenditure in Table 3 for different household characteristics.
Multilevel analysis
Chaudhuri (2000) methodology is extended here by introducing multilevel analysis by Goldstein (1987). Multilevel analysis corrects for inefficient estimators, which might occur whenever the proposed methodology by Chaudhuri (2000) is applied to hierarchical data structures (from household and community level).
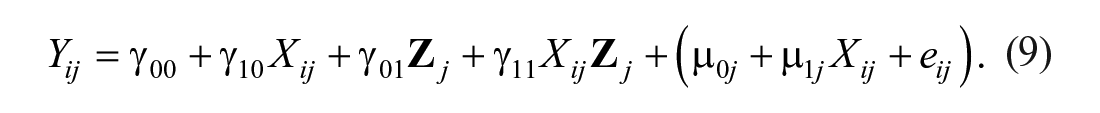
Suppose

The error term eij reflects the unexplained part in households’ consumption. The variables in Equation (6) are denoted by two subscripts: One refers to the household i and the other to the community j, and the coefficients are denoted by a subscript referring to the community j. This assumed that


where µ0j and µ1j represent Level-2 residuals, that is, the unexplained variance in consumption between communities. Equations (7) and (8) hence reflect the impact of community characteristics Z on household consumption, which varies across communities but which is identical for households within the same community j. Substituting Equations (7) and (8) into Equation (6) provides the complete model:
The vector

Incorporating multilevel modeling, first, we regress the log of per capita consumption of household i in community j on a set of X household and a Z community covariate using the basic two-level model. Equation (10) therefore estimates two error terms, µ0j and
In another step, the household variance level


In the third step, the mean (Equation 13), variance of household’s consumption caused by idiosyncratic (Equation 14), and covariate (Equation 15) were predicted:

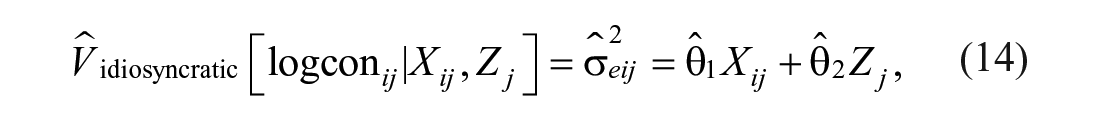

From the evaluated mean and variance of consumption, any measure of vulnerability can be applied to assess the effect of idiosyncratic and covariate shocks on households’ vulnerability.
The Empirical Models
We specify the empirical regression models below to determine and analyze how risk, vulnerability, and the characteristics of the household are correlated. However, because risks are almost purely exogenous, we assume that endogeneity is not a serious issue in the following specifications but only accounts for heteroscedasticity by incorporating survey designs in the estimations.
Model 1
To understand how vulnerability to poverty is triggered in the household by certain characteristics of the household, we specify the following equation:

Model 2
We specify the empirical model that enables us to investigate the probability that the household will fall into poverty by different kinds of exposure to risk:

Following Mba et al. (2018), “gender_head = 1 if female and 0 otherwise; and marr = marital status. In the literature, different kinds of marital status have shown to have some effects on the vulnerability of some households. hhsize = size of the household. In Nigeria, the average household is considered relatively large, ranging from 4 and 5. This happens mostly among the poor people.
Rural: 1 if rural, 0 if urban. With reference to vulnerability to poverty, this dummy variable helps us to understand the difference between rural and urban areas.
age_dummy=age dummy. This dummy variable enables us to estimate the specific effects that age has on vulnerability to poverty.
regional_dummy=regional dummy. This dummy variable primarily shows the characteristics of the six geopolitical zones of Nigeria in terms of vulnerability.
Risk is a vector of all the various kinds of risk exposure captured in the data.
The Data
The data used for the analysis are the General Household Survey (GHS) Panel from NBS 2015–2016 with major focus on agricultural and household consumption. The GHS Panel has been covering the same households numbering about 5,000 which are representatives of the geographical zones at both urban and rural areas from the 36 states of the Federation including the federal capital territory, collecting information on welfare agricultural activities and household consumption. The focus of the Panel is to increase the amount of data coming from the agricultural sector and link it to other facets of household behavior and characteristics. By collecting this information from the same households, it will be possible to monitor and evaluate the success of policies on them. The data are also useful in conducting studies that examine impact of exposure to risks and different kinds of shocks on household vulnerability to poverty. The dataset contains several information that is relevant to this study such as information on household expenditure categories, socioeconomic and demographic characteristics, exposure to different kinds of risks/shocks, as well as the coping mechanisms, credit access, non-agricultural enterprise, and community-level characteristics.
Results and Discussion on Findings
Descriptive Statistics
Table 1 shows the average vulnerability between urban and rural areas as well as the proportion of each exposure to risk. The average vulnerability for the urban areas is 19.6%, and 49.8% for rural areas. This shows that households in the rural areas are more vulnerable on average. From the table, the dissimilarities in most cases in the share of risk vary between urban and rural areas. Table 2 reports tests of significance of share of risk between urban and rural areas. The negative and significant difference shows that the risk exposure is more severe in the rural areas, while a positive and significance difference shows it is more severe in the urban areas. The analysis from the table showed that harvest failure, dwelling demolition, and livestock death are significantly higher in the rural areas than urban areas. On the contrary, illness of income earner, job loss, migration of income earner, robbery, kidnapping and hijacking, as well as other unclassified risks are significantly higher among urban households.
Distribution of Average Risk Exposure Between Urban and Rural (Population Weight Used).

Tests of Significance of Difference in Risk Exposure Between Urban and Rural Areas.
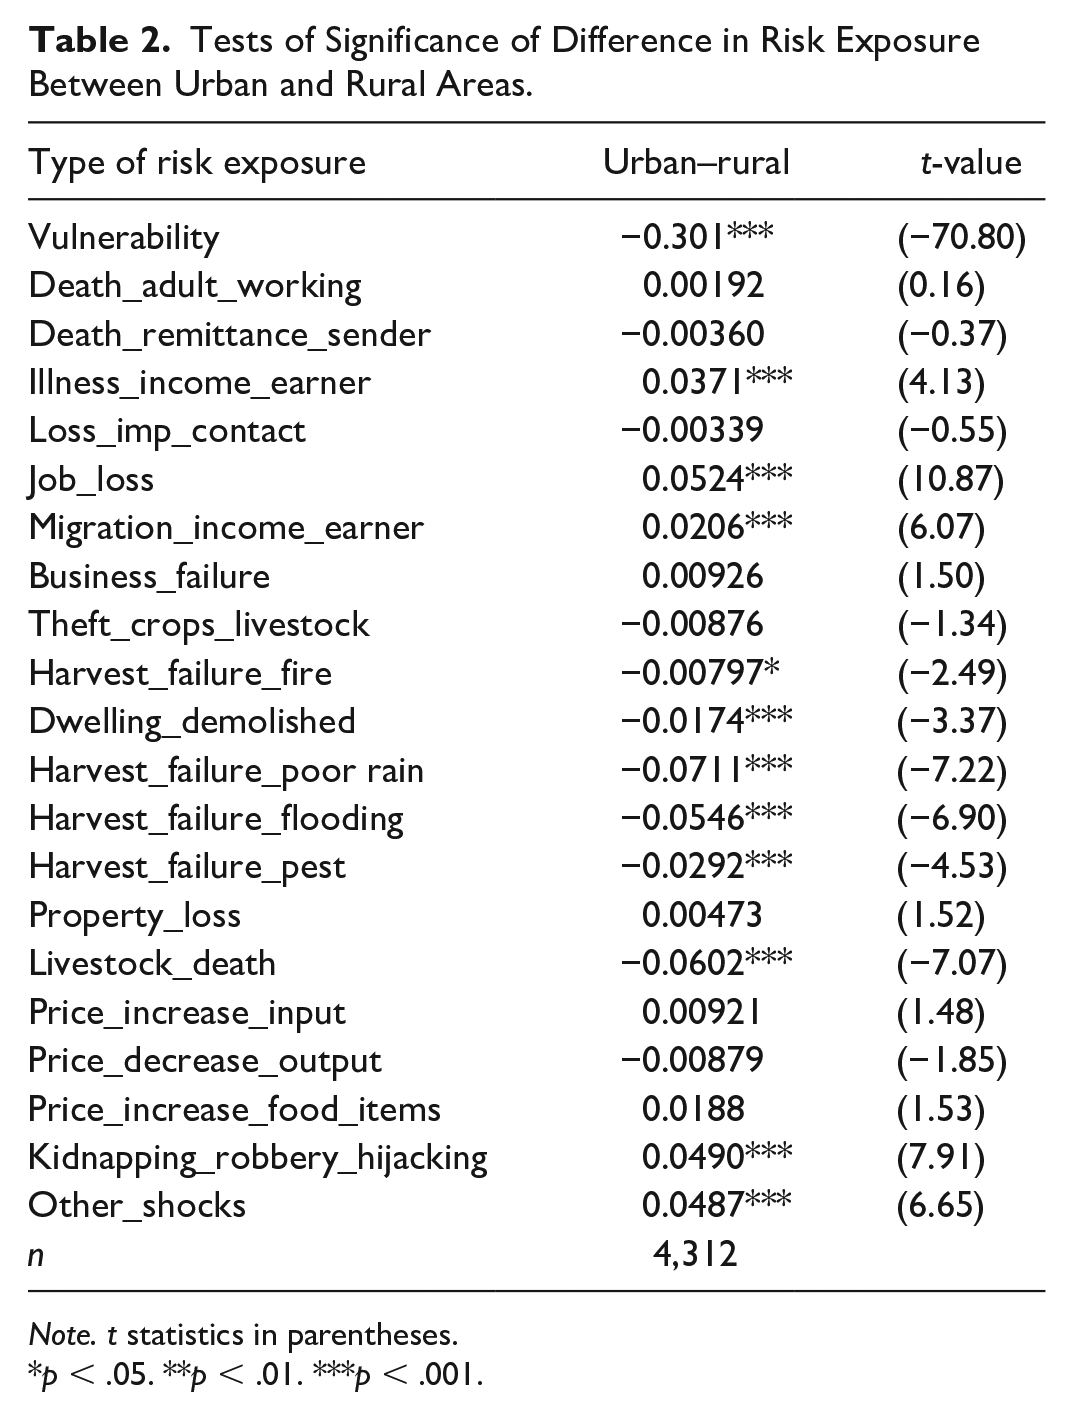
Note. t statistics in parentheses.
p < .05. **p < .01. ***p < .001.
The decomposition value of the average household per capita expenditure and their characteristics are presented in Table 3. From the table, low vulnerability has a positive relationship with low household size. This is substantiated by the fact that vulnerability to poverty relatively increases when the size of the household is above 6 and mostly evident in the rural areas. In terms of the household heads, the result showed that households with male heads have lower vulnerability to poverty than female heads. It further revealed that geopolitically, households in the south have lower or more moderate vulnerability to poverty than the Northern households with higher vulnerability. This can be attributed to the fact that the dwellers in the Northern zones are more prone to polygamy than their counterparts in the Southern zone. It is also obvious that many females in the Northern region do not actively engage in economic productive activities that further increase their vulnerability to poverty. Overall, most of the characteristics of the households investigated revealed that the levels of vulnerability are highly correlated with poverty and more severe in the rural areas than the urban.
Per Capita Expenditure and Vulnerability in Urban and Rural Areas by Household Characteristics.

Regression Results
The regression result of vulnerability on household characteristics is depicted in Table 4. The table shows that households with heads that are females (with large household size and living in rural areas) have significant positive impact on household vulnerability. When the head of the household is female, vulnerability increases by about 1.6%. The male heads are usually income earners and their demise, in most cases leading to females becoming household heads in this part of the world makes the household vulnerable to poverty. Household size has positive and significant effect on household vulnerability. Specifically, one additional household member increases vulnerability by about 3%. This suggests that household size is related to low per capita consumption. In such households, the effects of shocks are likely to be more severe than households with fewer members. The results show that living in rural area increases vulnerability by about 25%. Rural areas are associated with low economic opportunities, and households living in the area are more vulnerable to poverty when shocks happen. The coefficient of age is negative and significant, while the coefficient of square of age is positive and significant, suggesting that the age of household head has non-linear effect on vulnerability. The pattern suggests that household vulnerability decreases as age increases and beyond certain age when the income earning capacity of the head decreases, household vulnerability to poverty increases. The marital status categories show the effects relative to polygamous households, which is the base category. Significant differences exist among various types of marriages and household vulnerability such that single-person households such as never married, divorced, or separated are less vulnerable than polygamous households that have more mouths to feed. The results in Table 4 further showed that relative to North Central zone, vulnerability is lower in other geopolitical zones. The rate of decrease is marginal in all other Northern zones but large in the Southern geopolitical zones. This again may be attributed to larger household size in the Northern zones, the pattern of participation in economic activities of household member especially female and other differences in socioeconomic characteristics that tend to favor the Southern zones.
Effect of Household- and Community-Level Characteristics on Vulnerability.

Note. p values in parentheses. RMSE = root-mean-square error.
(.) denotes the probability values.
p < .10. **p < .05. ***p < .01.
Table 5 shows the results of impact of exposure to various types of risk on household vulnerability. We included as many risk exposures as found in the dataset because the correlation between various types of risk is very low and insignificant based on our preliminary tests. Except the death of remittance sender, business failure, and property loss, all other risks have statistically significant positive impact on household vulnerability to poverty (though some at the 10% significance level) after controlling for some household characteristics. At the 5% level of significance, the result shows that death of working adult household member, illness of income earner, loss of important contact, migration of income earner, job loss, theft of crops and livestock, dwelling demolition, kidnapping, and other idiosyncratic shocks have positive and significant impact on vulnerability. Also the covariate shocks that have significant positive effect on vulnerability are harvest failures due to poor rain, flooding, pest, livestock death, and price changes, which are types of covariate risk exposure that significantly increase household vulnerability to poverty. These risk exposures usually result in severe household income decline and food insecurity that lead to high probability of falling into poverty.
Effect of Various Types of Risk on Household Vulnerability.

Note. p values in parentheses. Population weight was used in the estimation. RMSE = root-mean-square error.
(.) denotes the probability values.
p < .10. **p < .05. ***p < .01.
Conclusion and Policy Recommendations
This study examined the effects of exposure to risks on households’ vulnerability to poverty in urban and rural areas and the implications for poverty in Nigeria. Although the application of cross-sectional data to vulnerability analysis relies on very strong assumptions, the findings are still relevant to policy making in developing countries where panel data are lacking or nonexistent. In this study, shock is considered as the actual occurrence of risk and vulnerability as the probability of falling into poverty due to non-anticipated or uninsured risk.
The study reports the average vulnerability in urban and rural areas as well as the extent of exposure to risk. The findings show that rural areas are more vulnerable to poverty and the risks they are exposed to, and are more covariate in nature while urban risks are disproportionately idiosyncratic. Risks associated with harvest failures and input and output prices are likely to reduce returns from farm activities and agricultural output, so that the net effect on farmers’ welfare would depend on the interactions between price and output. In this case, vulnerability based on food consumption is itself a contributor to poverty and the household’s pattern of response to risk exposure is expected to lower its per capita consumption.
The household characteristics investigated revealed that the level of vulnerability is correlated with socioeconomic, demographic, and geographic factors. Geographically, households in the Northern geopolitical zones are more vulnerable to poverty compared with those in the Southern part of the country. This may be attributed to the prevalence of polygamous marriage, large household size, and the fact that women in some of these areas are not allowed to take part publicly in economic activities. This restricts their ability to earn income, thereby making them vulnerable to poverty in the face of uncertainty.
Consequently, these findings have useful policy insights and therefore call for effective action from the policy makers that would help households to mitigate the adverse effects of shocks on the probability of falling into poverty. First, the study revealed how specific types of risk exposure contribute to household vulnerability to poverty. Thus, risks that are idiosyncratic in nature call for specific interventions that will help households found in such categories to manage the effects of such risks. One policy recommendation is to make provisions for conditional cash transfers and other social safety nets for households that are exposed to risks such as business failure, theft of crops and livestock, illness of income earner, migration of income earner, dwelling demolition, harvest failure due to flood or fire, and livestock death. This approach will be very effective in the short period during which the households are expected to recover from shocks and go back to their normal activities. Second, households should be encouraged to diversify activities during off farm seasons especially for agricultural households. Also, households that do not own enough farm land can diversify activities by engaging into buying and selling along agricultural value chains or hire out labor. This would help such households to manage risks.
Third, for shocks or risks that are covariate in nature such as increase in the price of inputs, harvest failure due to pest, increase in the price of food items, and decrease in the price of outputs, government should introduce different intervention schemes to save farmers and households. These include buying surplus farm produce to help keep prices of produce stable, subsidizing price of inputs such as fertilizers, insecticides, pesticides, and animal feeds to make them affordable to farmers, and encouraging farmers to form cooperatives so that they can share risk and find it easier to access micro-credits. Therefore, ongoing subsidization of price of fertilizers by Federal Government of Nigeria and various interventions by government in the agricultural sector are good policies that should be sustained. Other policy measures include making micro-credit schemes accessible to farmers and households, and agricultural subsidies in general.
The findings also call on government at all levels to provide adequate security for protection of outputs, livestock, and properties from theft, bandits, and arsonists. Over the past few years, farmers have suffered huge losses from these man-made activities in different parts of Nigeria especially in the North East and North Central part of the country. Furthermore, government can use irrigation facilities, pest control, and education of farmers through agricultural field workers to prevent widespread crop failures. Another way farmers can guarantee themselves of stable prices and income is to go into semi-processing of produce so that they would have export value. This can be achieved by pursuing export processing zones (EPZs) program with seriousness so that it will become functional.
Finally, households have a lot of roles to play by controlling fertility and consequently household size. The fact that a body of literature has documented that poor households tend to have larger household size is not sacrosanct. If the head of the household or the breadwinner has low-income earning potential, he or she should control the number of children that should be born or adopted to the family. Birth control measures should be taken seriously by households because of recent episodes of rapid population growth in Nigeria.
Footnotes
Declaration of Conflicting Interests
The author(s) declared no potential conflicts of interest with respect to the research, authorship, and/or publication of this article.
Funding
The author(s) received no financial support for the research, authorship, and/or publication of this article.