
Abstract
Monitoring of dual service failures (e.g., trends in service failures and consecutive service failures) in business is emphasized for service quality management. Previous studies analyzing negative online reviews to conduct dual service failure monitoring from a managerial perspective are scarce. Numerous negative online reviews are useful sources for dual service failure monitoring because they can be easily collected at a low cost. This article proposes a data-driven approach to monitor service failure trends and consecutive service failures from negative online reviews. In the proposed approach, first a classifier is developed to categorize newly collected negative reviews into service failures by Latent Dirichlet allocation. Subsequently, a threshold value is provided to identify a new type of service failure, which was not achieved previously using a control chart. Finally, the probability of consecutive service failures is obtained by association rule mining. A case study of Uber is conducted to validate the proposed approach. The results exhibit that the proposed approach can perform dual service failure monitoring. This study can increase marketing intelligence for dynamic management of service failure and allow rapid responses to service failures.
Introduction
Monitoring of dual service failures (e.g., trends in service failures, consecutive service failures) in business is important because it allows companies to identify time trends in service failures (Maxham & Netemeyer, 2002) and to recognize continuous problems that degrade the credibility of a service (Halstead et al., 1996). Service failures occur when level of service falls below customers’ expectation (Hess et al., 2003; Zeithaml et al., 1993). Service failure trends indicate the changes in the frequency of service failures in a time series (Maxham & Netemeyer, 2002). Consecutive service failures refer to successive customer dissatisfaction of a service provision (Sivakumar et al., 2014). Service failures change over time as customers’ assessments of service quality change due to changes in the service system (Bolton & Drew, 1991; Bolton & Lemon, 1999). Service failures can also happen sequentially in multiple stages because a service has the property of process (Halstead et al., 1996; Sivakumar et al., 2014). Therefore, by exploring service failures in time series, companies can discover new frequently occurring service failures and assess the service system. Service companies enable continual management of service failures rather than temporary remedial action (Bolton, 1998; Maxham & Netemeyer, 2002). An ability to identify consecutive service failures can be a starting point to resolve consecutive service failures proactively rather than a single failure and to assess whether or not the existing solution for a single failure affects another failures.
Negative customer feedback can be a useful source for dual service failure monitoring. Firms tend to monitor negative online reviews to understand the negative experiences of customers (Korfiatis et al., 2019; Melo et al., 2017). Negative customer feedback that is written by customers can pinpoint problems because customers have direct experience with problems of service (Storey & Larbig, 2018). The feedback can be used to identify and rectify problems with service processes and delivery (Tax et al., 1998) and to guide development of methods to solve the problem quickly before further damage is done (Halstead et al., 1993; Marshall, 1995). This feedback is particularly useful to guide management of service quality and customer satisfaction because service failure experiences have bad short-term and long-term influences on perceived service quality and customer satisfaction (Gijsenberg et al., 2015; W. G. Kim et al., 2015).
However, thus far, studies analyzing negative online reviews for dual service failure monitoring from a managerial perspective have been scarce, despite its importance (Maxham & Netemeyer, 2002; Sivakumar et al., 2014). Previous research could not track service failures and identify new types because they focused on the type and frequency of service failures in a period. They could not determine consecutive service failures, which have a significant influence on reliability.
Therefore, this study attempts to answer the following main research questions yet unaddressed in the service literature (Fouroudi et al., 2020).
This article proposes a data-driven approach to monitor service failure trends and consecutive service failures from negative online reviews. In the proposed approach, first a classifier is developed to categorize newly collected negative reviews into service failures. The labels of the service failures and the linguistic patterns for the classifier development are determined by conducting Latent Dirichlet allocation (LDA). Subsequently, in the proposed approach, a threshold value is provided to identify a new type of service failure, which was not achieved in the past using a control chart. The developed classifier helps to identify service failure trends by periodically classifying negative online reviews into service failures. Finally, the probability of investigating consecutive service failures from classified reviews is determined by association rule mining (ARM).
The rest of article is organized as follows. “Literature review” section reviews the literature review of dual service failure monitoring. “Method” section explains the data-driven approach to identify service failure trends and consecutive service failures from negative online reviews. “Case Study” section illustrates a case study of Uber. The next section presents research implications. Then limitations and directions for future research are described. The final section suggests conclusions.
Literature Review
This section presents the previous studies and their limitations in identifying service failure trends and consecutive service failures based on structured and unstructured feedback.
Analysis of Structured Feedback for Dual Service Failure Monitoring
Many studies have analyzed negative feedback in structured format (e.g., surveys about predetermined attributes of service failure) to identify the type and frequency of service failures in various service industries such as restaurant (Hoffman et al., 1995), hotel (Lewis & McCann, 2004), retail banking (Lewis & Spyrakopoulos, 2001), online retailing (Holloway & Beatty, 2003), and online auction (Kuo et al., 2011). These studies first identified common service failures by using critical-incident techniques or by surveying the literature, then conducted surveys and analyzed structured feedback to identify the frequency of common service failures.
However, collecting customer responses in a structured format for dual service failure monitoring is expensive and time-consuming. The results from a structured feedback analysis can also rapidly become outdated (Culotta & Cutler, 2016). The analysis cannot easily identify a new type of service failure because the work to revise a survey to add new failure dimensions consumes time and resources (Ordenes et al., 2014). Collecting high-quality data from structured feedback is difficult because of the complexity or the length of the surveys and the willingness of the participants (Bi, Liu, Fan, & Zhang, 2019). Therefore, consideration of other data resources, such as negative online reviews, is needed for dual service failure monitoring.
In these circumstances, the advance of text mining techniques enables analysis of negative customer experience that has been presented in unstructured format; these techniques provide resources to complement structured feedback analysis (Joung et al., 2019). Customers participate actively when they provide unstructured feedback, so it represents customer motivation better than structured feedback does (Belkahla & Triki, 2011). The customers’ active role provides companies with valuable and complete sources that encompass any problematic situation that occurs while customers exploit a service. This research fills a gap in the service literature by proposing an approach that analyze negative customer experience of unstructured format to identify time series of common service failures and consecutive service failures.
Analysis of Unstructured Feedback for Dual Service Failure Monitoring
Service failure management has been sufficiently emphasized from the standpoint of service providers (Fouroudi et al., 2020; Hess et al., 2003; Maxham & Netemeyer, 2002; Tax et al., 1998). In the past, few studies were conducted from a managerial perspective to identify service failure trends and consecutive service failures from negative online reviews having an unstructured format. Many previous investigations focused on the type and frequency of service failures without considering their trends and continuity. Co-occurrence analysis was used to identify why customers felt unsatisfied with each transportation service, by identifying words that are most likely to co-occur with taxi, metro, and bus (K. Kim et al., 2017). Clustering analysis was used to identify problems that customers frequently encountered in online retailing and low-cost airlines (Goetzinger et al., 2006; Yee Liau & Pei Tan, 2014). After conducting the clustering analysis, query search is used to seek interesting patterns of negative reviews in each cluster to identify specific failures experienced by customers in the pizza industry (He et al., 2013). Text-link analysis was also used to find pairs of words that are frequently used together in the hotel industry (Berezina et al., 2016). Some studies have used LDA and latent semantic analysis (LSA) in hotel reviews to identify common service failures in the hotel domain by discovering the most likely topic words of a cluster (Dickinger et al., 2017; Guo et al., 2017; Xu et al., 2017; Xu & Li, 2016). James et al. (2017) used LDA from patient reviews to identify common service failures in the health care domain. Bilici and Saygın (2017) used LDA from patient reviews, then applied a Bayesian network to identify common service failures and relationships among them.
Analysis of customer reviews is required to understand the characteristics of a service (Song et al., 2016). Although types of service failures can change over time and occur consecutively, previous studies on the monitoring of service failure trends and consecutive service failures from the perspective of a manager are scarce (Bolton & Drew, 1991; Bolton & Lemon, 1999; Halstead et al., 1996; Sivakumar et al., 2014). Thus, previous research methods can neither track service failure trends in the future to manage service quality nor identify the relationship between service failures. Furthermore, although a Bayesian network (Bilici & Saygın, 2017) allowed identification of consecutive service failures by learning the conditional probability between service failures, it assumes that the relationships among them is known. The method is not suitable when the relationship between service failures is not easy to identify.
Therefore, this study contributes to the service literature by providing a data-driven approach for dual service failure monitoring from the perspective of a manager. The proposed method can track service failure trends by continuously classifying negative reviews into service failures and identifying newly occurring problems. It can also determine consecutive service failures when the relationship between them is unknown. Analysis of service failures from a large volume of negative reviews does not discount the existing knowledge of the firms. Integrating the knowledge from the analysis of these reviews with the prior knowledge of the employees provides an opportunity to gain insight into service failures (Lam et al., 2017).
Method
The overview of the proposed approach for dual service failure monitoring is presented in Figure 1. Negative online reviews are the inputs, and the outputs are service failure trends and consecutive service failures. The proposed approach comprises three important stages to perform dual service failure monitoring from newly collected negative reviews (Figure 1, right side). First, a classifier is developed to categorize newly collected negative reviews into multi-failures of service at the sentence level based on historical reviews by LDA. Second, a threshold is derived to identify a new type of service failure, which the developed classifier does not recognize using a control chart. Finally, the probability of consecutive service failures is derived by ARM.

Overview of the proposed approach.
After developing the classifier and deriving the threshold, dual service failure monitoring is achieved as follows (Figure 1, left side). The newly collected reviews are categorized into service failures by the classifier. Subsequently, a chart of classified reviews ratios RC is drawn. If RC exceeds the threshold, the analysis to monitor dual service failures is performed. However, if RC is much less than the threshold as a result of occurrence of new types of service failures, then the developed classifier is updated.
Data Preparation
Negative online reviews of the target service (e.g., ratings 1and 2) are collected. If the ratings are not provided on the review websites, SentiStrength (Thelwall, 2017) and Vader (Gilbert & Hutto, 2014), to analyze the sentiments of social media text, can be used to determine the negative or positive sentiments of the reviews. The purpose of this research is to identify service failures from the customer’s perspective, so the material for this approach should be customer reviews that include negative experience of the target service. Web scraping is used to gather reviews and their bibliographic information such as date, rating, user location, and user name in web pages automatically. To refine collected reviews and bibliographic information, the Google detection language application programming interface (API) can be used to recognize the type of languages automatically because some reviews in English category are written in another language, and Geonames API can be applied to identify country or city from user input automatically.
After collecting negative online reviews, text preprocessing of lower-casing, lemmatizing, and removing punctuation and meaningless stop words (e.g., “he,” ‘the “that”) is conducted (Boyd-Graber et al., 2014). Noun phrases are also included because they can generate a meaning that may differ from the meaning of each word. The dependency information is extracted to structure each of them. Dependency is the grammatical relation in which words are connected to each other by directed links (Feldman & Sanger, 2007). Dependency relation is used to develop the classifier.
Classifier Development
A classifier is required to categorize newly collected negative reviews into frequently occurring service failures automatically, which is expected to classify each review into multiple labels. Here, a classifier based on linguistic rules with a higher level of interpretability and accuracy is developed to perform classification (Korde & Mahender, 2012). Constructing linguistic rules for classification is time-consuming because of manual operation. Therefore, this research uses LDA to identify categories for classification and to help define a set of linguistic rules.
LDA is a powerful probabilistic topic model that automatically summarizes a large volume of textual data by identifying hidden topics or themes in it (Blei et al., 2003). LDA helps to discover topics in massive document collections, and its visualization facilitates understanding of how topics differ from each other, by identifying words that are most highly associated with each topic (Sievert & Shirley, 2014). In this research, the result of LDA provides clustering for the understanding of failures type and domain-specific resources such as word features, customer terminology, and linguistic patterns (i.e., syntax) for development of logical rules. LDA facilitates obtaining domain-specific knowledge for building classifiers based on linguistic rules. Clustering methods except for topic modeling such as LDA are not suitable to utilize development of linguistic rules because they cannot provide keywords that are closely related to each topic.
Performance measures such as precision, sensitivity (i.e., recall), accuracy, specificity, G-mean, F-measure, and Hamming-loss is used to evaluate the developed classifier’s predictions of multiple failures of service in negative reviews (Feldman & Sanger, 2007; Sokolova & Lapalme, 2009) (Table 5). Hamming-loss evaluates the fraction of wrong labels among the total number of labels and indicates the total error of the multi-label classifier.
Generation of labels of service failures
To generate labels of service failures, the input review-word matrix for LDA is first built from historical negative reviews. Subsequently, LDA is performed by taking a review-word matrix as an input, and provides posterior probabilities of words for each topic. By using these posterior probabilities, the results of LDA can be visualized by ranking words in each topic according to their relevance to the topic. Relevance helps to flexibly rank words in order of their usefulness for interpreting topics. The relevance of words to a topic can be manipulated by adjusting the value of the criterion, λ, which is the weight assigned to the probability of words under a topic. Based on a previous study, λ = 1/3 is selected to effectively rank the topic words in each topic (Sievert & Shirley, 2014). The left screen of LDA visualization (Figure 2) represents a global view of the topic model; each topic is expressed as a circle on a two dimensional plane by using multidimensional scaling that projects distances between topics. The right screen of the visualization indicates a bar chart of the top 30 most-useful words to interpret a selected topic on the left screen. A pair of overlaid bars presents both the frequency of a given topic word in the corpus and the topic-specific frequency of the topic word.

LDA visualization in dev set.
The optimal LDA model among various topic models is determined by using a goodness-of-fit measure of topic coherence (Röder et al., 2015) for each choice. After LDA models that have the top three coherence values, by calculating topic coherences from the 10 most common topic models, then the optimal model is decided by assessing the similarity of the top 30 words that describe a topic in terms of service process (Joung et al., 2019). Labels of service failures are finally generated by analyzing sentences including most-likely words in each topic in detail; each topic is expected to include one or two specific failures.
Development of linguistic rules
To develop linguistic rules to classify each review into generated labels, linguistic patterns for service failure classification are first identified by investigating topic words and sentences including them related to each label form LDA results. Identifying these linguistic patterns helps to identify word features and syntax for constructing rules for classification. Linguistic rules are built to capture linguistic patterns by using Boolean operator (e.g., and, or, not) and linguistic features of topic words such as lemmatization and dependency. Linguistic rules are also expanded by identifying synonyms by using WordNet, which is the largest online database of English words. Dependency-based rules can classify by considering more detailed grammatical information of the reviews than do rules that apply lemmatization features (Bird et al., 2009). These rules can automatically classify each review into several types of service failure by identifying linguistic patterns that are closely associated with the type (Table 1).
Example of Service Failure Classification in Negative Review.

Decision of Threshold Value
A threshold is required to represent a point of time for the update by providing a lower boundary to identify when the classifier cannot categorize the newly collected reviews into new types of service failures. This threshold value is derived by applying the lower control limit of a p control chart, which helps to find deviations from existing patterns. Because the developed linguistic rules cannot categorize reviews into service failures with perfect accuracy, the calculation of the lower control limit when inspection errors occur in the p control chart is used (Case, 1980). The threshold is calculated as

where
The developed classifier cannot categorize a new label of service failure, so when one occurs the classified review ratio will drop below the threshold over time. Therefore, the downward trend in the ratio provides service managers with a point of time for update, and they can update the existing linguistic rules by investigating unclassified reviews. If the classified review ratio is the same as the threshold, it is unclear whether a new type of service failure has occurred. In this case, active managers can attempt to determine new types of service failures and update the classifier.
Dual Monitoring Analysis
Service failure trends
This step identifies downward or upward trends of each service failure in classified reviews by investigating service failures that are the primary cause of the variation in total failures. To explore these trends, time-series graphs of total number of failures and of each service failure are plotted by using time and label information in the classified reviews. Time-series graphs of each service failure are presented by calculating the ratio of each failure review among total reviews. An upward trend of a failure indicates that the current service system related to the failure causes customer dissatisfaction, and therefore emphasizes a necessity to effectively eliminate the cause of this failure. A downward trend in a failure indicates that the current system reduces this failure effectively.
Consecutive service failures
This step identifies consecutive service failures in a specific time interval by using ARM (Agrawal et al., 1993) to identify the relationship of service failures in classified reviews. ARM originated from studies to identify frequent patterns or causal structures among sets of items in customer transaction records. The results of ARM are represented as if-then rules; its main benefits are ease of interpretation and of application. ARM performs this identification in two ways: by calculating a support measure that shows how frequently a service failure set appears; and by calculating a confidence measure that indicates how often a service failure Y occurs after a service failure X. A probability of consecutive service failures is provided by determining a minimal confidence value. Monitoring of consecutive service failures helps to identify a series of severe problems and can remedy consecutive failures by identifying their cause-and-effect relationships.
Case Study
Negative online reviews of Uber in the United States is selected to explain how the proposed approach could be applied in practice. Uber is a global taxi technology company that links people who need transportation, with people who can provide it. A case study of Uber was selected for three reasons. First, Uber is a well-known company and is evaluated as one of the highest-value startups. Second, negative reviews in the Uber service have been recorded on various sites since August 2012, and the number of reviews is increasing yearly due to the rapid increase in the number of users. The channels of these review sites help to acquire new negative reviews over time. Third, Uber must improve its effectiveness and efficiency, because Uber competes with a similar business (i.e., Lyft) in the United States and faces new competitors worldwide.
In our chosen service, the Uber passengers contact Uber service online. Uber usage by passengers consists of seven key stages: (a) visiting the home page or the application of Uber service, (b) signing up as a passenger, (c) requesting a ride, (d) the meeting driver and starting the ride, (e) riding and arriving at destination, (f) checking fare and paying, and (g) rating the driver. Using the proposed approach, the monitoring of service failure trends and consecutive service failures at various key stages of this process is evaluated.
Data Preparation
Html pages of 2,292 negative reviews of Uber are collected from review sites such as Yelp, trustpilot, sitejabber, product review, and consumer affairs. Then, date, rating, contents of a review, user location, and user name in the html documents are automatically extracted by using the Beautiful Soup library in Python. Reviews that were not written in English, or were written by users who lived in non-American regions, or that occurred on more than one review site were excluded by using the Google detection language API and Geonames API. The analysis included cases in which the users living in the United States used Uber in other countries; however, such cases were rare. These cases were considered because customers compared Uber experiences in the United States and other countries. Drivers’ reviews, business evaluation reviews, and Uber eat that did not represent service experiences of Uber passengers were also excluded; drivers’ reviews, business evaluation reviews, and Uber eat reviews were identified by using their frequently occurring terms such as “average,” “earn,” “salary,” “government,” “country,” “‘corporate,” “technology,” “Uber eat,” and “food.” The final analytical sample for the proposed approach was 1,809 negative reviews from 2014 to 2017. Although a keyword search was conducted, many noise reviews on Uber Eats from 2018 could not be filtered out because of their large volume. Therefore, negative reviews from 2014 to 2017 were selected for the analysis. These methods can be used to collect Uber reviews at daily, weekly, and monthly intervals.
After collecting negative reviews, lemmatized tokens and dependency information were extracted to structure each of the reviews by using WordNet lemmatizer (Miller, 1995) and Stanford dependency parser (Chen & Manning, 2014). Noun phrases (e.g., “credit card,” “customer service,” “surge pricing”) that co-occurred 10 times or more.
Classifier Development
The reviews were divided into a development set and test set (Table 2). Development set was used to identify common service failures and to construct linguistic rules to classify them; this set consisted of negative reviews that were collected from 2014 to 2016. The test set was composed of negative reviews obtained from 2017; this set was used to evaluate the developed classifier.
Summary of the Sample Statistics.

Generating labels of service failures
A 984 reviews and 868 words matrix was prepared for LDA. LDA was performed on the input matrix. Three-topic, four-topic, and five-topic models that had the top three coherence values were identified. Subsequently, the similarity of the top 30 words in a topic was investigated by identifying that each topic word semantically corresponds to words that represent problems in each stage of Uber usage. Four topics were determined for the optimal model. Reviews were investigated by exploring the top 30 words in each topic, then specific failures were identified by referring to the sentences from which the topic words had been extracted.
From LDA results, five service failures were identified in four topics (Table 3). In Topic 1, two delivery problems were found: “unwanted cancellation of ride request” and “long wait for ride” (Figure 2). These problems indicate failures in which the ride request of customers is canceled or delayed in the delivery of taxis. In Topic 2, “poor customer service contact” was identified. The failure means that customers had difficulty contacting the service center and receiving answers from it. In Topic 3, “unclear pricing polices” that customers were charged more than they expected was discovered. In Topic 4, “unskilled drivers” that customers feel that the drivers are unprofessional due to rude attitude, reckless driving, and ignorance of the road was identified.
A List of Failures Identified by LDA.
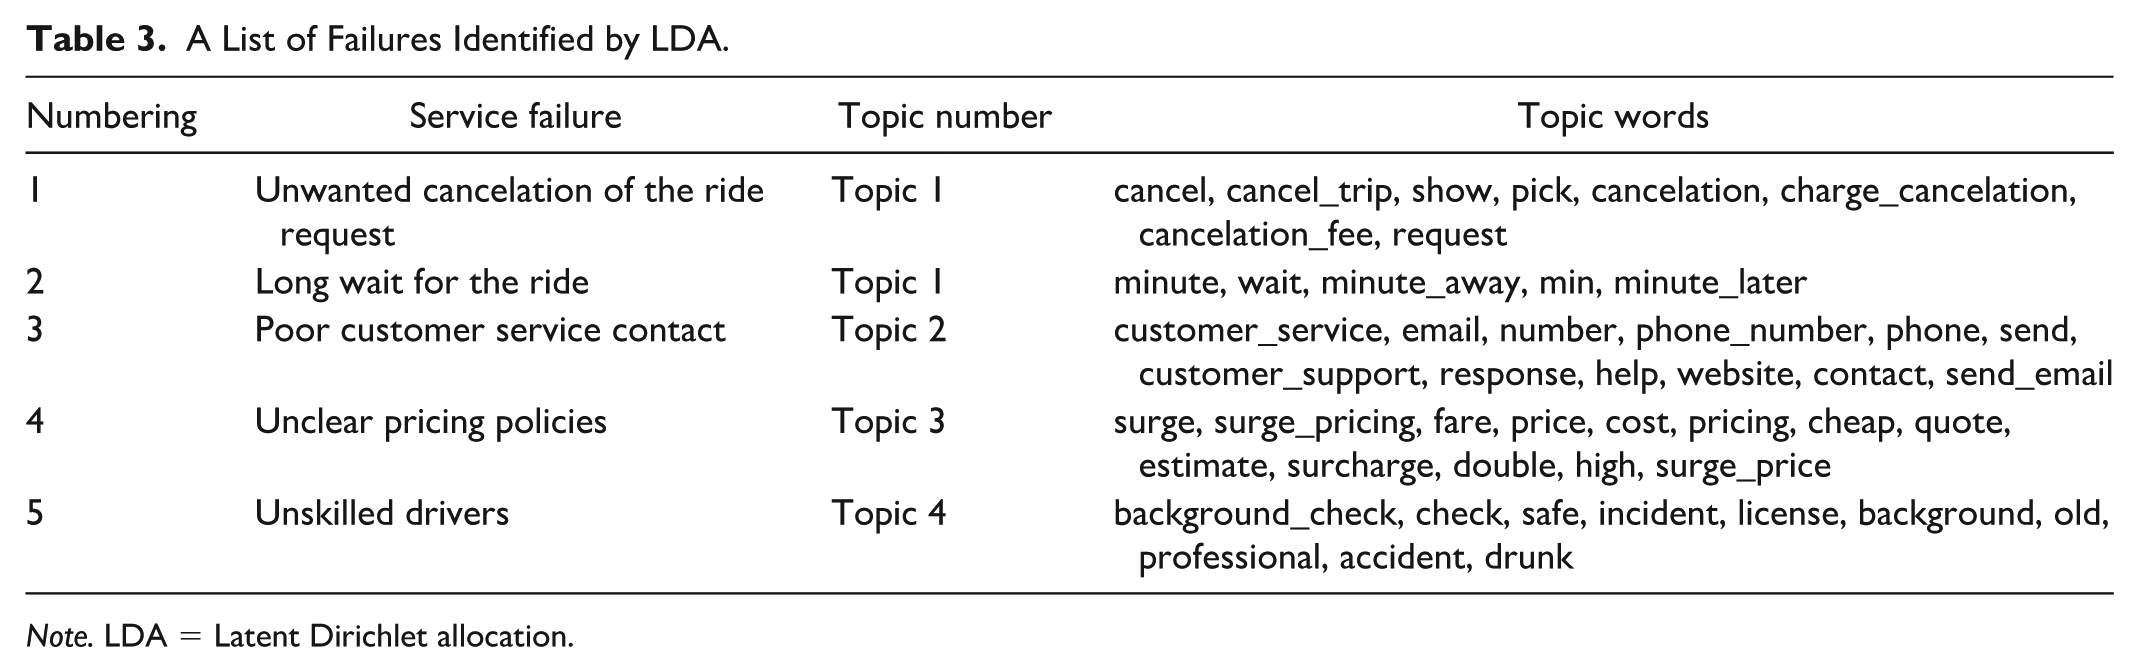
Note. LDA = Latent Dirichlet allocation.
Developing linguistic rules
After manually annotating reviews with generated five labels, 59 linguistic patterns for the five service failure classifications were identified in the development set by LDA analysis. Linguistic rules were then built for these classifications. The topic words in these rules were also expanded using WordNet, allowing identification of low-frequency synonyms. For example, linguistic rules for “Unclear pricing policies” which were most frequent in the reviews were constructed by using lemmatized features and dependency features of topic words. One linguistic rule that applies lemmatized features was built by using lemmatized tokens of topic words “surcharge” and “price,” with Boolean operator “AND.” The rule was expanded by considering synonyms of “surcharge” such as “overcharge,” “overcharging,” or “overprice,” and synonyms of “price” such as “fare,” “toll,” “fee,” “dollar,” “cost,” “rate,” “money,” “quote,” “payment,” or “dollar.” One linguistic rule that uses dependency features was developed by using “amod” dependency of topic words of “high” and “price,” which presents adjectival phrase that modifies the meaning of the noun. The rule was also expanded by considering synonyms of “high” such as “differently,” “outrageous,” “insane,” “incredible,” “upper,” “revised,” “additional,” “exorbitant,” or “unwanted.” In this way, linguistic rules were developed for the classification.
Applying Threshold Value
Negative reviews in the development set were classified into five service-failure labels by using the classifier. The classified failure review ratio was 0.91 (896/984), and the threshold value was 0.88 at a confidence level of 99% (Equation 1). A chart of classified reviews ratio was drawn to test whether the threshold value could identify a point of time for update, assuming that negative online reviews of Uber were collected at monthly intervals. The time-series graph was used a rolling 6-month average to smooth the seasonal characteristics of service failures. The failure ratio of classified reviews fell below the threshold value of 0.88 beginning in January 2017 (i.e., the average of November 2016 to April 2017) (Figure 3, left side). This downward ratio indicated the occurrence of new type of failure that cannot be classified into the five service failures that were identified in development set from 2014 to 2016, so the classifier was required to update by investigating unclassified reviews.

Time series graphs of classified review ratio.
From the corresponding period of November 2016 to April 2017, 48 unclassified reviews were examined; 23 reviews were unclassified due to classifier errors such as lemmatization or dependency, or to user misspellings of the five classified service failures. In most of the rest of unclassified reviews, “account hacking” security problems was identified. The classifier was updated by finding linguistic patterns to classify “account hacking.” After the update, the new classified failure review ratio did not fall below the threshold value (Figure 3, right side).
Dual Monitoring Analysis
Service failure trends
To detect trends in service failures, 6-month rolling averages in time-series graphs of total number of failures and of the six service failures were plotted (Figures 4 and 5). Service failures that primarily affect variation of the total failure were investigated. The graph of total number of failure reviews increased over time due to the increase in the number of Uber passengers. This graph presents rapidly-increasing periods such as from March 2015 to November 2015 and from December 2016 to June 2017, and a decreasing period from June 2017 to September 2017 (Figure 4). The graph of each service failure trend exhibits an upward trend in “unclear pricing policies” from March 2015 to November 2015 and upward trends in “unwanted cancelation of the ride request,” “unclear pricing policies,” and “account hacking” from December 2016 to June 2017. An upward trend of “unclear pricing policies” indicates that Uber pricing policies failed to meet customers’ expectations in the corresponding periods. An upward trend of “unwanted cancellation of the ride request” indicates that the algorithm that matches passengers and drivers did not satisfy customers’ expectations in the corresponding period. In fact, Uber updated this matching algorithm in June 2016, so our results indicate that the change was ineffective. An upward trend of “account hacking” emphasizes the necessity of follow-up measures for security after the corresponding period, because the hacking actually occurred in October 2016. Moreover, the effect of the modifications of the service system and recovery policy can be explored by understanding the cause of upward trends in service failures by continuing to investigate their trends.
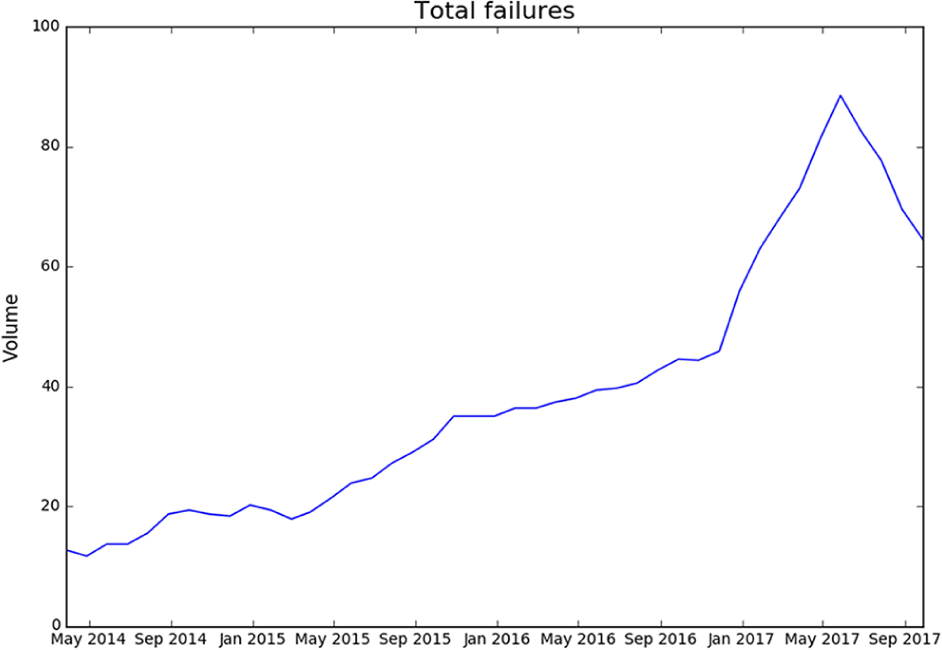
Time series graph of total number of failures.

Time series graphs of six service failures.
A downward trend of “account hacking” and “poor customer service contact” from June 2017 to September 2017 was identified. The downward trend of “account hacking” shows that the security system moderately reduced this failure, but the trend should be further monitored because the number of such complaints is a small proportion of classified reviews. The downward trend of “poor customer service contact” indicates that the management of customer service center satisfied customers’ expectations. Uber actually planned to establish several customer support centers in the United State and to update, starting in March 2016, the Uber app that gets customer feedback; the intention was to speed up the slow customer support that had been provided by email. These solutions can be effective because complaints about “poor customer service contact” decreased.
Consecutive service failures
Consecutive service failures were investigated by ARM from 2015 to 2017, and the results were similar. Consecutive service failures that showed the most reviews in 2017 are presented in Table 4. The total number of generated association rules with five service failures was 181. Interesting association rules’ results that had more than a minimal confidence value of 0.5 were interpreted. The most complained-about “unclear pricing policies” and other service failures mainly occurred together. At a support level of 0.2, a consecutive failure rule ({Unwanted cancelation of ride request}→{Unclear pricing policies}) was identified and it represents consecutive service failures in which the cancelation fee was charged to customers when drivers canceled the ride request; and a consecutive failure rule ({Unskilled drivers}→{Unclear pricing policies}), which shows consecutive service failures in which the customers were overcharged when unskilled drivers took a long time to reach the destination. At a support level of 0.1, a consecutive failure rule ({Poor customer service contact}→{Unclear pricing policies}) was found. It indicates that the purpose of the contact was unclear pricing policy when customers had no contact with the customer service center; and a consecutive failure rule ({Long wait for ride}→{Unwanted cancelation of ride request}), which presents consecutive service failures in which the ride was canceled after a customer waited a long time. These consecutive failures were a series of service failures ({Long wait for ride}→{Unwanted cancelation of ride request}→{Unclear pricing policies}). Service failure ({Unclear pricing policies}) which occurred after service failure ({Unwanted cancelation of ride request}), or after service failure ({Long wait for ride}), or after service failure ({Poor customer service contact}), or after service failure ({Unskilled drivers}) provides cause-and-effect relationship; the relationship leads to idea of service improvements that can solve more than one service failure simultaneously.
The Result of Association Rule Mining in 2017.

Validation
The proposed approach comprises the development of a classifier, providing a threshold, and determining the probability of consecutive service failures. They were evaluated for validation. First, precision, sensitivity, accuracy, specificity, G-mean, F-measure, and Hamming-loss of the classifier’s results on the test set were calculated to assess the developed classifier for five service failures (Table 5). Hamming-loss was 0.08, which represents the total fraction of misclassified in multi-labels is very small (Metz et al., 2015). The overall F-measure of the classifier was 87%, which indicates that the classifier achieved high precision and sensitivity when classifying negative reviews into five service failures. The result is high enough to demonstrate the feasibility of automated classification of textual reviews (Thelwall et al., 2010). Second, the threshold helped to identify “account hacking” as a new service failure by analyzing negative online reviews of Uber over time, as described in “Applying Threshold Value” section. The incident that hacked personal information of 57 million Uber passengers and drivers actually happened in October 2016 (Wong, 2017). Finally, the probability of consecutive service failures allowed to identify a series of service failures ({Long wait for ride}→{Unwanted cancelation of ride request}→{Unclear pricing policies}), as described in “Consecutive service failures” subsection in the “Case Study” section.
Classifier Evaluation for Service Failure Classification.
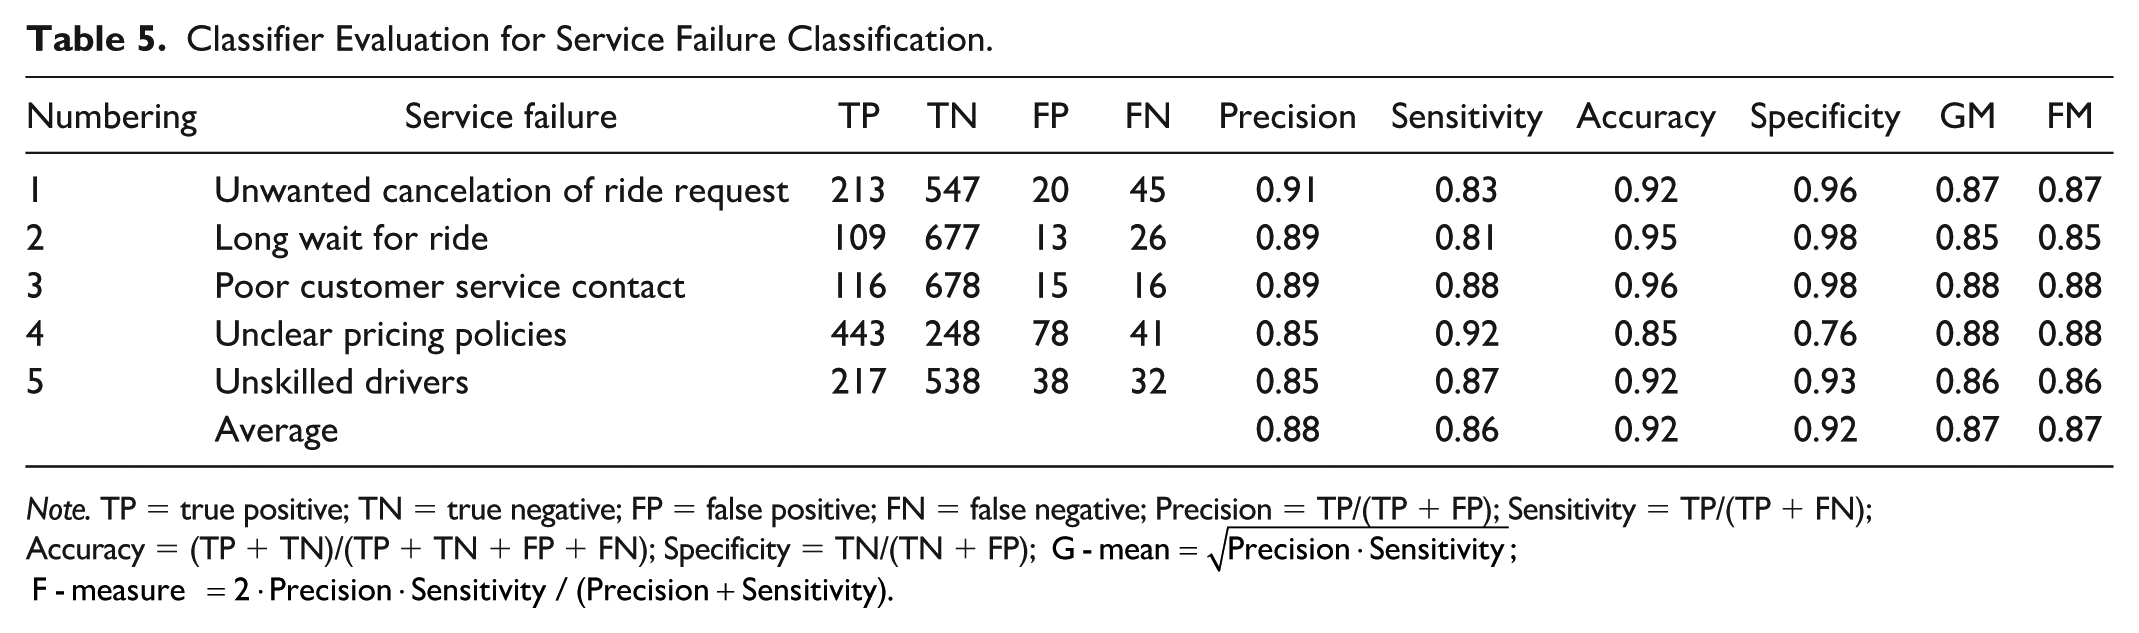
Note. TP = true positive; TN = true negative; FP = false positive; FN = false negative; Precision = TP/(TP + FP); Sensitivity = TP/(TP + FN); Accuracy = (TP + TN)/(TP + TN + FP + FN); Specificity = TN/(TN + FP);
Research Implications
Using the proposed approach, service managers can monitor service failure trends and consecutive service failures. Monitoring of service failure trends can help a service manager to identify frequently occurring problems of the service from customer’s perspective and to assess the previous solution by investigating the root cause of the problem. Monitoring of consecutive service failures enables identification of connected problems that degrade the quality of service from the customer’s perspective. The monitoring can help service managers to identify cause-and-effect relationships between service failures. Therefore, monitoring of dual service failures enables service firms to gain direct and indirect control over the distribution of the occurrence of service problems from the customer’s perspective (Sivakumar et al., 2014). Firms can actively respond to identified failures by allocating resources to develop methods to avert failures and to evaluate these methods over time. Proactive management of service failures can increase the satisfaction of dissatisfied customers and minimize the spread of damaging word-of-mouth opinion.
The proposed approach was applied in a case study of Uber and identified several service failures; awareness of these errors can help Uber managers to improve the service. Specifically, five common service failures, one newly increasing service failure, and their time trends were identified; five types of consecutive service failure were also discovered. Previous customer research on Uber has investigated the reliability of drivers (Mittendorf, 2017; Park et al., 2016; Wan et al., 2016) and has used social media mining to identify brand loyalty (Handayani, 2016) and overall satisfaction (Saragih & Girsang, 2017). However, the proposed approach helps to identify specific problems such as “Unwanted cancelation of ride request,” “Long wait for ride,” and “Unskilled drivers” that are related to the reliability of drivers from customer’s perspective.
The proposed approach also enables service managers and frontline employees to understand the service failure experiences of customers. It provides empirical evidence of a service’s factors that dissatisfy customers; it achieves this goal by identifying the sources of customers’ direct experience that are classified into each service failure. The direct experience may provide service managers with ideas that solve these specific failures and can provide frontline employees with educational opportunities. For example, service managers can educate frontline employees by using real cases of customer failures. The education can prevent failures or improve the speed, convenience, and accessibility of a service to customers.
The proposed approach also provides service managers with automated tools to analyze the contents of negative online reviews of customers. These tools are particularly useful to manage negative online reviews because negative reviews generally have a greater influence on sales than positive ones (Cao et al., 2011). The approach helps managers respond to negative online reviews quickly and can easily influence potential customers by achieving dual service failure monitoring from negative reviews.
Limitations and Future Research
This research has limitations, which provide directions for further research. First, the proposed approach automatically classified 91% of entire negative reviews into common service failures, then focused on their analysis. The approach has the weakness that it cannot automatically identify service failures that occur in unclassified reviews. Therefore, new techniques should be developed to analyze these failures. Second, sufficient negative reviews and the knowledge of complaints corresponding to the service are required to implement the proposed approach. With a few negative reviews, it is difficult to utilize the proposed approach. Domain experts are needed to generate service failure labels when developing the classifier. Third, the proposed approach can monitor service failures over time, but negative reviews must be collected over daily, weekly, monthly intervals, and the developed classifier must be updated if a new service failure appears. Further research should provide customer information that supports real-time decision-making by developing an integrated intelligent system that captures and analyzes customer data (Ostrom et al., 2015).
The proposed approach focuses on analysis of negative reviews; this process is effective for service companies that expect to identify problem patterns in many negative reviews. However, future study should also consider the seriousness of failures in all reviews, including positive and neutral ones. Development of a model that has such a high skill level to process complex natural language is challenging work for text-mining researchers. The new model would be required to distinguish the activation level encoded in emotion words (e.g., good vs. excellent) and to identify sentence sentiment of positive or neutral reviews accurately that review expresses differing sentiments across sentences (Ordenes et al., 2017). The model must also be able to identify ironic or sarcastic expressions (McGraw et al., 2015). This work may require use of deep-learning techniques that use lexicons and consider syntactic structure and dependency structure.
Further research can improve the sampling level for dual service failure monitoring by linking user information on social media to company-owned information about this particular customer; the link requires matching of structurally different data formats by using common information such as email addresses and user names (Lam et al., 2017). This matching of company internal demographic information (e.g., gender, region, age) allows firms to monitor service failures in segmented groups of customers. Moreover, future study can improve the quality of sampling by removing fake reviews or using reviews of verified purchases (Bi, Liu, Fan, & Cambria, 2019).
Conclusion
This article presented a data-driven approach for dual service failure monitoring from online negative reviews. The proposed approach identified service failure trends by developing a classifier to categorize newly collected reviews as service failures and providing a threshold to identify new types of service failures. It also identified a series of service failures by providing the probability of consecutive service failures. This study contributes to the service literature by providing a data-driven approach that includes steps from data collection to practical analysis to aid in management of service failures over time.
Footnotes
Declaration of Conflicting Interests
The author(s) declared no potential conflicts of interest with respect to the research, authorship, and/or publication of this article.
Funding
The author(s) disclosed receipt of the following financial support for the research, authorship, and/or publication of this article: This work was supported by the National Research Foundation of Korea (NRF) grants funded by the government of Korea (MSIP) (No. 2019R1I1A1A01063298) and by the Ministry of Science, ICT, and Future Planning (No. 2020R1C1C1014312).