
Abstract
This study attempts to evaluate the monetary policy of the Reserve Bank of India (RBI) based on an investigation of the policy statements. The analysis based on text mining of the central bank’s monetary policy statements seeks to unravel the information considered by the central bank and the processes followed in making its inflation forecasts. The findings indicate that although the RBI examined high-frequency economic indicators, its inflation forecasts have generally been off the mark. Specifically, the monetary policy committee failed to foresee the sharp disinflation that followed the demonetization announced on November 8, 2016. This failure resulted in a high real interest rate regime that dealt a blow to the economy staggering under the effects of demonetization. Our research findings show that the monetary policy governance practices need to be refined and better aligned to economic realities, particularly under the RBI’s new monetary policy framework.
Keywords
Introduction
Policy statements by central banks provide a source of unstructured yet rich and largely untapped information that plays out in subsequent effects on the economy. In what the authors believe is the first such attempt in India, this article evaluates and interprets information culled out from monetary policy statements that record the pronouncements made by the monetary policy committee (MPC) of the RBI in their meetings held once every two months. The article focuses on how the RBI has been perceiving the inflation trajectory in India and to what extent it has been correct.
To facilitate better communication with the market, the RBI started conducting monetary policy review meetings every alternate month from the beginning of the financial year (FY) 2014–2015. Prior to 2014–2015, the monetary policy review meetings were held quarterly. But the most important change since FY 2014–2015 has been the acceptance of inflation targeting (IT) as RBI’s goal. Earlier, since 1998, the RBI used to work with a multiple indicator approach (MIA) in framing its monetary policy. In the MIA approach, along with inflation, other macroeconomic variables such as economic growth, employment, exchange rate, foreign trade, and capital flows were targeted by the RBI. But MIA came under severe criticism post-2008–2009 when India faced downward pressure on its economic growth despite an upward spiraling inflation rate. The criticism was primarily based on the uncertainty related to the target of RBI’s monetary policy, whether the RBI targeted inflation or the exchange rate. This lack of clarity in policy approach used to confuse the market and ultimately hurt the investment and growth in the country (Kansal, 2016). After considering the reports of earlier committees on monetary policy, an “Expert Committee to revise and Strengthen the Monetary Policy Framework” under the chairmanship of Dr. Urjit Patel in its 2014 report recommended adoption of IT as the target of the RBI monetary policy (Reserve Bank of India [RBI], 2014).
Another notable change in the monetary policy of India in the FY 2014–2015 was the acceptance of the Consumer Price Index (CPI) in place of the Wholesale Price Index (WPI) as the nominal anchor of inflation in India.
In October 2016, the Government of India (GoI), in consultation with the RBI, set up the MPC. Since then, the MPC has been responsible for formulating monetary policy in India. Before setting up of the MPC, the central bank governor, aided by a technical advisory committee, was responsible for the monetary policy decisions.
There are six members in the MPC, three from the central bank and the remaining three nominated by the central government. Every member has got one vote in the committee with the RBI governor having one extra vote in case of a tie. The MPC is assisted in its task of assessing inflation trends and other macroeconomic forecasting by the central bank’s monetary policy department (MPD). The role of MPD is advisory. Each external member also brings his or her own analysis on inflation forecasts along with the analysis of the evolving macroeconomic situation in the country and around the world. At the end of each monetary policy meeting, the RBI issues its monetary policy statement, which summarizes the understanding, assessment, and conclusion of the MPC regarding the current and future economic outlook of the Indian and global economies. This is a detailed document that incorporates the understanding and forecast by each committee member.
With the change in its policy target to IT, now the question arises that, given India’s low-income level where households spend a substantial part of their income on food and fuel, can the RBI accurately forecast its inflation path so as to contain it within a predefined range. This is because food and fuel inflation are volatile, given the fact that India is heavily dependent on monsoon and crude import for its food and fuel needs, respectively (Banerjee et al., 2020; Bhattacharya & Sen Gupta, 2018; Pattanaik et al., 2020). Moreover, a large part of the Indian economy is in the informal sector that makes monetary transmission difficult (Anand et al., 2016; Benes et al., 2017; Kulshreshtha, 2011). At the same time, the government decides the interest rates on small saving schemes, such as Public Provident Fund, National Savings Certificate, Sukanya Scheme (for the girl child), Kisan Vikas Patra, Post office savings, and so on. These rates do not follow the RBI policy guidelines and are generally rigid in nature. As commercial banks compete with these small saving schemes for deposit, they cannot decrease interest rate below a certain level. As a consequence, this hampers monetary transmission in India (Acharya, 2017; Lahiri & Patel, 2016).
While trying to evaluate the performance of the RBI’s inflation forecasting under IT regime, it will be worthwhile to understand how the other emerging markets have performed since they adopted IT. Broadly, there are two views about the outcome of IT in emerging markets. On one hand, authors like Cobham and Song (2021), Hove et al. (2017), Samarina and De Haan (2014) Brito and Bystedt (2010), and Mishkin (2004) argue that IT has failed to work effectively in emerging markets because of their weak institutional capabilities, for example, independence of central banks, fiscal dominance, and financial developments. On the contrary, authors like Stojanovikj and Petrevski (2020), Lin and Ye (2009), and Batini and Laxton (2007) noted that IT has helped in lowering average inflation in emerging markets that have shown the willingness of price control despite having fragile institutional capabilities.
Keeping these findings and the Indian macroeconomic reality discussed earlier in mind, this article endeavors to analyze and understand the performance of the RBI’s inflation forecasting under the IT regime. The analysis will give a perspective equally applicable to other emerging economies for understanding the dynamics of inflation under the IT regime. Similarly, the analysis can help Indian policy makers in tuning their policy interventions more effectively.
Generally macroeconomic analysis includes factors such as the gross domestic product growth trend, fiscal deficit, inflation rate, balance of payments, unemployment level etc. All of these are quantitative measures which depend on quantitative models for their evaluation and forecasting. However, policy makers and regulators communicate their perspective about the economic outlook and policy decisions in the form of text. These texts are a rich source of information. The monetary policy statements issued by the central bank at the end of every monetary policy meeting convey perceptions about the economy and its outlook (Bennani et al., 2020; Chappell et al., 1997; Kahveci & Odabaş, 2016; Park et al., 2019). The market in its turn uses these statements to understand the central bank’s economic outlook and to assess the future interest rate trajectory that may be followed (Conrad & Lamla, 2010; González & Tadle, 2020; Mazis & Tsekrekos, 2017).
In this study, a corpus of monetary policy statements of the RBI are used to investigate and contextualize the factors considered and deliberated by the MPC while making these predictions. This further serves as a basis for evaluating the performance of the central bank in terms of inflation forecasting. As these statements are in the form of running text, a methodology has to be developed to analyze them. An established method for evaluating policy statements that were used by Stekler and Symington (2016) to quantify the scales derived from sentiment analysis of policy statements will be used in the article. The quantified index values would reflect the MPC’s inflation outlook for the economy. The quantitative index will be complemented with a qualitative evaluation of the textual statements to find out the information that the MPC examined in making their assessment.
This article will address the following research questions:
The empirical contribution of this study lies in showing that the evaluation of the RBI’s policy statements can provide unique insights about the process followed by the RBI in making monetary policy decisions. Juxtaposed with numeric inflation targets and achievements, this can provide a deeper understanding of the monetary policy formulation under existing macroeconomic conditions and the information considered while making inflation forecasts.
The article while examining the IT in India has shown that the performance of the MPC is a mixed bag of successes and failures. There are a comparable number of hits and misses in inflation forecasting. The findings have important implications not only for India but also for those emerging market economies with similar market structure. This article has shown that for emerging economies such as India, inflation forecasts are often not accurate, as any forecast may be unsettled by supply-side shocks and weak monetary transmission. Similarly, in the case of India, inflation forecasting error coupled with IT may adversely affect economic growth and, consequently, poverty alleviation. For example, the article has shown that the MPC members did not see demonetization as a major disruption as far as inflation was concerned and were thus taken aback when the inflation rate fell substantially in the subsequent period. This failure prevented proactive action, for example, reducing repo rate 1 to boost the sagging investment in the economy.
This article is further structured into sections covering a review of the literature describing earlier attempts to evaluate monetary policy statements to make macroeconomic forecasts, followed by the “Data and Method” section wherein the method of quantitative and qualitative analysis has been described and developed. The “Results” section discusses the results of the analysis. In the end, this article concludes with some highlight discussions and conclusions.
Literature Review
This section will discuss literature related to the evaluation and forecasting of monetary policy statements by various researchers and will conclude with reasons for believing that content analysis of monetary policy statements of the Reserve Bank of India will provide unique insights regarding inflation forecasting in India.
“Summary of commentary on current economic conditions by Federal Reserve District” also known as Beige Book is published individually by all the twelve Federal Reserve Banks in the United States eight times a year. Each central bank collects information on current economic conditions in respective districts through reports from bank and branch directors and interviews with key business contacts, economists, and market experts. These reports are historically available in the United States and contain very rich qualitative data. This has been analyzed by Balke and Petersen (2002), Armesto et al. (2009), Balke et al. (2017), Saltzman and Yung (2018), and Tsukioka and Yamasaki (2018).
Using discourse analysis, Balke and Petersen (2002) found that Beige book was a rich source of unique information related to the United States’s economic outlook which was not captured elsewhere.
Similarly, Armesto et al. (2009) used textual analysis to convert qualitative data of Beige Book into sentiments, namely, optimism and pessimism. Their analysis also concluded that qualitative information in the Books had predictive power. But, one drawback of the article was that they could not place context along with the sentiments.
Balke et al. (2017) again concluded that the Beige Book contained distinctive information about contemporary economic conditions that were not present in other quantitative indicators. But they also found out that this data advantage was only for three weeks from the release date, that is, after a period of time, this unique information about the economic activity was accounted for in other quantitative indicators.
Saltzman and Yung (2018) on the contrary using machine learning techniques had extracted uncertainty measures from the Beige Books between 1970 and 2018. They predicted that business and economic-related uncertainty is associated with future weakness in output and higher unemployment.
Tsukioka and Yamasaki (2018) again using text mining techniques had predicted that Beige Book positively related to changes in the Federal fund rates target. They also found that the tone of the Beige Book negatively related to the returns in the bond market on Federal Open Market Committee (FOMC) announcement days. They concluded that Beige Book could predict the upcoming monetary policy, and this anticipation influenced the returns on FOMC announcement days.
Similar to Beige Book, minutes of the discussion among all 19 members of the FOMC also contain valuable qualitative information. This information is from varied sources, such as staff’s quantitative forecasts as well as the periodic forecasts of the FOMC. These have been studied by many researchers like Chappell et al. (1997), Boukus and Rosenberg (2006), Apel and Grimaldi (2014), Sheng (2015), Stekler and Symington (2016), and Hansen et al. (2017). All of them have found some predictive power in qualitative information of FOMC minutes. For example, Sheng (2015) concluded that dynamic discussion among FOMC members provided additional insights regarding how economic information was interpreted. Similarly, Stekler and Symington (2016) used qualitative content analysis (QCA) and text analytic to evaluate the FOMC minutes. It found that FOMC members during the period leading to the financial crisis of 2008 had recognized the associated risks but failed to predict the ensuing financial crisis.
Similarly, Rosa and Verga (2007), Bulíř et al. (2013), Apel and Grimaldi (2012), and Gertler and Horvath (2018) have studied monetary policy statements of the European Central Bank (ECB). Kawamura et al. (2019) and Du (2018) evaluated the contents of the Bank of Japan’s (BoJ) statements. Masawi et al. (2018) have done content analysis on monetary policy statements of the Bank of Canada and Reserve Bank of Australia.
But, there is no research paper, which has analyzed the content of the RBI policy statements. The justification of using monetary policy statements as data comes from the fact that these statements contain many nuanced insights and have broader perspectives in its assessment of risk and uncertainty that an economy faces. This combination of nuance, timeliness, broad purview, and attention to risk makes these monetary policy statements a valuable source of insights. These are rich sources of data that may allow the researchers to peep into the assessment of Indian and global economic development by the MPC. This research paper will attempt to extract useful insights from the monetary policy statements of the RBI.
Data and Method
The RBI Monetary Policy Statements as Data
The Reserve Bank of India’s monetary policy statements record the understanding, assessment and conclusion of the MPC regarding the current and future economic outlook of Indian and global economies. The discussion in the statement contains two sections, one dealing with the assessment of the current economic situation and the other with the economic outlook. In economic assessment, Indian and global economic assessment, including trade, gross domestic product, industrial production, inflation, financial markets, and business sectoral assessment, are generally discussed. The section on economic outlook enumerates quantitative and qualitative economic forecasts along with the associated risk and uncertainty.
In this article, economic assessment and outlook related to inflation are extracted from the monetary policy statements of the period under study. Since the FY 2014–2015, the RBI started using CPI instead of WPI as nominal anchor of inflation. In this research paper, analysis of data has been done for the period starting from April 2014 to April 2019, that is, bi-monthly policy statements period.
In this article, three unique methodologies to evaluate the sentiment and predictive information contained in the monetary policy statements have been used. In the “Scaling Inflation Forecast” section, an index has been developed to capture the RBI’s sentiment regarding the future inflation trajectory. Second, in the “Text Analytics to Identify Inflation Subgroups” section, quantitative text analysis was used to identify the subgroups of inflation that dominated the RBI monetary policy discussions. Third, qualitative text analysis has been carried out in the “Qualitative Textual Analysis” section to evaluate the risk and uncertainties that the policy statements identified.
Scaling Inflation Forecast
Scaling inflation sentiments from the statements
An index was constructed for each of the 31 statements by the RBI Governor from April 2014 to April 2019 to measure the RBI’s sentiment regarding future inflationary paths. The sentiment was derived from the inflation part of the outlook section of the statement. In the monetary policy statements, the paragraphs discussing inflation outlook generally begin like, “going forward, the inflation outlook is expected to be . . . ,” and then it sums up the policy committee members’ opinion about inflation outlook in the intermediate future. These paragraphs can be taken as data, which encapsulated the qualitative prediction of the future inflation outlook for the Indian economy.
In the 1930s, during the Great Depression in the United States, Goldfarb et al. (2005) first used an outlook scale to analyze the error in economic forecasts. This method was later adopted by Lundquist and Stekler (2012) and Stekler and Symington (2016) to analyze economists’ forecasts, leading to the great depression and to evaluate qualitative forecasts of the FOMC minutes, respectively. In this study, the same outlook scale has been adopted. The scale values range from +1 to −1, with gradations of 0.25. For instance, statements that perceived a strong deflationary trend were given a score of +1, whereas statements that perceived a strong inflationary trend were awarded a score of −1. Table 1 contains the criteria for scaling the statements’ inflationary sentiment. The outlook has been divided into three broad categories, namely, optimistic, neutral, and pessimistic.
Criteria for Scaling the Outlook of the Policy Statements Qualitative Forecasts.

Source. Constructed by the researchers.
The outlook scale criteria are based on the list of indicative phrases/words from the policy statements that encapsulate the inflation outlook sentiment of the MPC in their respective meetings. For instance, a score of +1 is given for those statements where words like “sharp decrease” or “sharp deceleration” are used in the context of the inflation outlook, while a score of +1/2 is associated with words like “modest,” “benign,” or “temper inflation.” Table 1 also contains the list of lexical words used to score all the monetary policy statements.
The same inflation outlook paragraph in the policy statement also includes a quantitative inflation forecast (popularly known as the Fan Chart). These quantitative forecasts come after qualitative outlook analysis. By colligating the quantitative forecasts with their qualitative sentiment index as described in Table 1, we have constructed a calibrating scale that links qualitative sentiment with quantitative forecasts. The calibrating scale can be seen in Table 2.
Calibration Scale Linking Outlook Sentiment Scores With Quantitative Inflation Projection.

Source. Constructed by the researchers.
Scaling actual inflation
Actual inflation must also be indexed in the same manner as the sentiment index so that they can be compared. Inflation data used for the concerned month is the CPI from the Ministry of Statistics and Programme Implementation of India. The CPI inflation data for the related months are shown in Table 3. The calibrating scale is shown in Table 2.
Real-Time Consumer Price Index (CPI) Inflation Y-O-Y (in %).

Source. Ministry of Statistics and Program Implementation of India (MOSPI).
Text Analytics to Identify Inflation Subgroups
Text analytics provides a systematic methodology to describe and interpret the messages in the body of a corpus of text. In this research, both qualitative and quantitative methods of content analysis have been used to glean insights from the textual content, that is, the proceeds of RBI’s monetary policy statements that are issued every alternate month.
For quantitative analysis, we use software-based natural language processing and machine learning techniques to investigate the patterns and features in the unstructured textual data for knowledge discovery (Feldman & Dagan, 1995).
Even a casual perusal of the inflation-related content in the RBI monetary policy statements cannot miss the fact that the discussions of the MPC in its meetings are largely dominated by the issues related to three categories of inflation, namely, food, fuel, and core inflation. To quantify the MPC members’ concern with these three categories of inflation, the researchers have used the text mining package called “t” developed by Meyer et al. (2008) available in the popular open-source statistical software R; “tm” has been used to perform data cleaning and text analysis. The index was then constructed from specific inflation-related words/phrases extracted from the monetary policy statements in the 5-year period between April 2014 and April 2019.
Given the mandate of the RBI as an IT central bank, the frequency of food, fuel, and core inflation-related words in each of the statements was recorded. The list of words related to each of the three inflation groups is shown in Table 4. The actual inflationary trends were then juxtaposed with the trends in inflation groups to extract meaningful insight.
Inflation-Related Words Frequently Used in the 5-Year Monetary Policy Statements.

Source. Constructed by the researchers.
Note. MSP = minimum support price.
Qualitative Textual Analysis
Qualitative text analysis often called QCA is one of the most useful methods for analyzing text content (Guest et al., 2011; Kuckartz, 2014; Schreier, 2012). In this article, both quantitative index and qualitative text analysis have been used to analyze monetary policy meeting deliberations and decisions. The application of conventional text analysis enabled the researchers to go for an in-depth analysis of these statements to draw further understanding of the policy statements.
While going through the text of the statements, the researchers were motivated to seek answers to the following questions: (a) What did the committee members know about the economy? (b) When did they become aware of changing dynamics of inflation? and (c) Why and when did they decide to revise their outlook?
Results
Mapping Inflation Sentiment With Actual Inflation
Table 5 and Figure 1 show an index of inflation sentiment that has been developed from qualitative analysis of monetary policy statements of the RBI and the actual inflation numbers. As can be seen from Figure 1, in 15 of the 31 months under consideration, the direction of inflation predicted by the RBI was opposite to that of the actual inflation. In only five months in this period, the predicted and actual inflation have been at par.
Inflation Sentiment Versus Actual Inflation.


Inflation sentiment versus actual inflation.
The correlation between inflation sentiment, as extracted and quantified from the Monetary Policy Statements, and the actual inflation index in Table 5 is statistically insignificant at 0.2765 (
Furthermore, a Sign test was conducted to test whether the forecasted inflation could predict actual inflation with reasonable statistical significance. The test was conducted on the sign of differences between actual and predicted inflation indexes. The result in Table 6 shows that the binomial test result is insignificant and indicates that two time series data—sentiment index and actual inflation index—are mutually independent. In other words, the forecasted inflation has not been able to predict the actual inflation in the period of our analysis.
Sign Test Result.
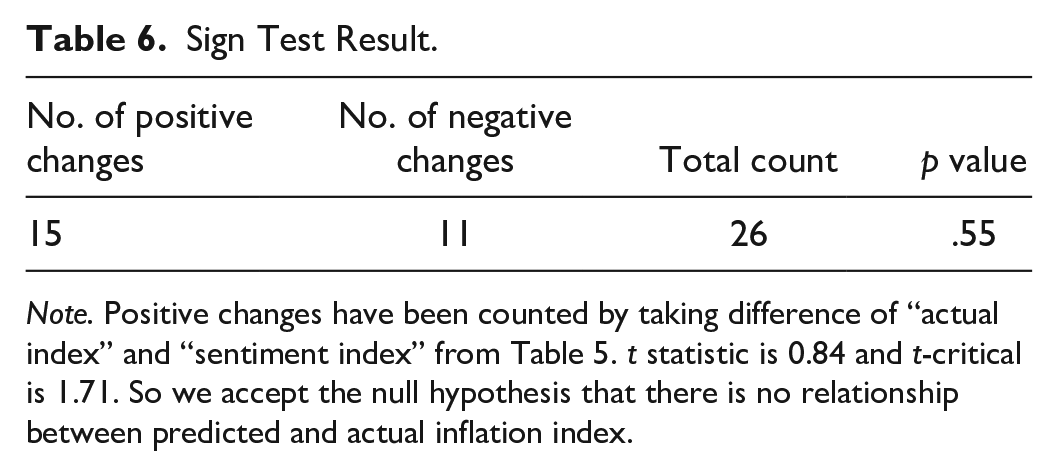
Note. Positive changes have been counted by taking difference of “actual index” and “sentiment index” from Table 5. t statistic is 0.84 and t-critical is 1.71. So we accept the null hypothesis that there is no relationship between predicted and actual inflation index.
The period between June 2016 to February 2018 was particularly interesting, as the statements during that period generally seem to predict an increase in inflation, whereas the inflation rate in these 10 months had actually fallen. One of the reasons for this might have been that the monetary policy makers failed to comprehend the underlying inflation dynamics in the wake of multiple fiscal policy shocks. It must be noted that this was also the period when the differences relating to the policy interest rate between the RBI and the central government became public. During this period, the government took major fiscal policy decisions like the implementation of the Seventh Pay Commission report (June 29, 2016), demonetization of high denomination currency notes (November 8, 2016), and implementation of the Goods and Services Tax (July 1, 2017).
What the Policy Makers Knew and When
What did the RBI know about the unfolding future inflationary trend in India? From Table 5, it can be seen that there were several policy meetings in which inflation outlook sentiment saw radical changes. The first such change was seen in December 2014 when the monetary policy sentiment turned negative, whereas the inflation for the month actually came down. Similarly, during the period between August and December 2016, the MPC sentiment again turned inflationary, although inflation in those months came down sharply. In fact, it must be noted that of 16 meetings of the MPC (first meeting being in October 2016), it had voiced inflationary sentiment in 12. The inflation rate actually rose in only 7 months out of these 12 periods. In other words, forecasting by the MPC was markedly biased toward an increase in inflation.
Another interesting period was between August and December 2018. During this period, the MPC failed to predict the sharp deceleration in inflation. In its August 2018 meeting, the MPC predicted inflation at 4.8% during the second half of the FY 2018–2019, although it decelerated to a low of 1.97% in January 2019. One important implication of this failure was the very high real interest rate (4.03% in January 2019) for the economy at a time when the economic growth was already slowing down.
While the MPC did not predict the sharp deceleration in inflation during the third quarter of FY 2018–2019, it had correctly observed the underlying deceleratory trend for food inflation in its August 2018 policy meeting. But even then, it could not predict the deflation in food prices observed during the quarter. In fact, it had raised concerns regarding an inflationary impact of the central government’s decision to fix the minimum support price (MSP) for food grains at 150% of the cost price (MPC statement dated October 5, 2018).
Major Inputs to the Inflation Forecasts
Although the index in Table 5 unveils the changes in the inflation outlook of MPC members over time, it does not indicate the specific criteria or parameters on which this judgment was based. Obviously, the latest economic and inflation scenario was presented and discussed at length in each meeting. The subsequent sections determine the relative dominance of the three inflation groups in each of the policy statements and project this to the presumable impact on changes in policy outlook. Text mining has been used for this purpose.
The results obtained using R statistical software are presented in Figure 2. Inflation index has been divided into three subgroups, namely, food, fuel, and core inflation. Food and fuel inflation are supply-driven and majorly dependent upon monsoon and international crude oil prices, respectively. Core inflation, on the contrary, is considered demand-driven, and it also indicates the pricing power of the manufacturing sector and service providers. In the figure, the frequency of words related to each inflation category is depicted. Food inflation has consistently dominated the two other categories of inflation. But its dominance has decreased over time. Fuel inflation which is related to the international crude oil price as well as international geopolitical developments has been the second most discussed inflation category. As the crude price stumbled in 2016, its importance in the MPC discussions also reduced. Again, when the international crude price started increasing in 2017, fuel inflation-related discussions registered a quantified increase.

Category wise words in the Governor’s statement.
Discussions on core inflation have generally lagged behind food and fuel except during the period from August 2016 to February 2017 when the RBI was majorly concerned about the impact of the Seventh pay commission on inflation. Core inflation had been persistently above 5% during the period under study. Still, it was not a major concern (as seen by mentions in the policy statement) for the RBI because there was less volatility when compared with other categories. Judging from the relative discussion time and emphasis given to different inflation categories, it is clear that the RBI remained majorly focused on food and fuel inflation under the presumption that the major volatility in headline inflation (CPI) would come from the supply side rather than the demand side of the economy.
Risks and Uncertainties to Inflation Outlook: Qualitative Text Analysis
The index developed in this article is an attempt to quantitatively estimate the MPC’s outlook. In monetary policy statements, there are sections, which deal with risk and uncertainties that the committee identifies with the inflation outlook. These provide a parallel qualitative representation of fan charts used to convey risks to the inflation outlook path. These risks and uncertainties have been analyzed using QCA. In the first phase, major risks and uncertainties related to the projected inflation trajectory between April 2014 to April 2019 have been identified. The result is summarized in Table 7. In the next phase, the themes pertaining to the identified risks and uncertainties have been coded. The result is shown in Table 8.
Risks Related to the Inflation Forecasts.

Note. GST = goods and services tax.
Risk and Uncertainties Related to Each Inflation Subgroup and Subgroup’s Prevalence in the Policy Making of the RBI.
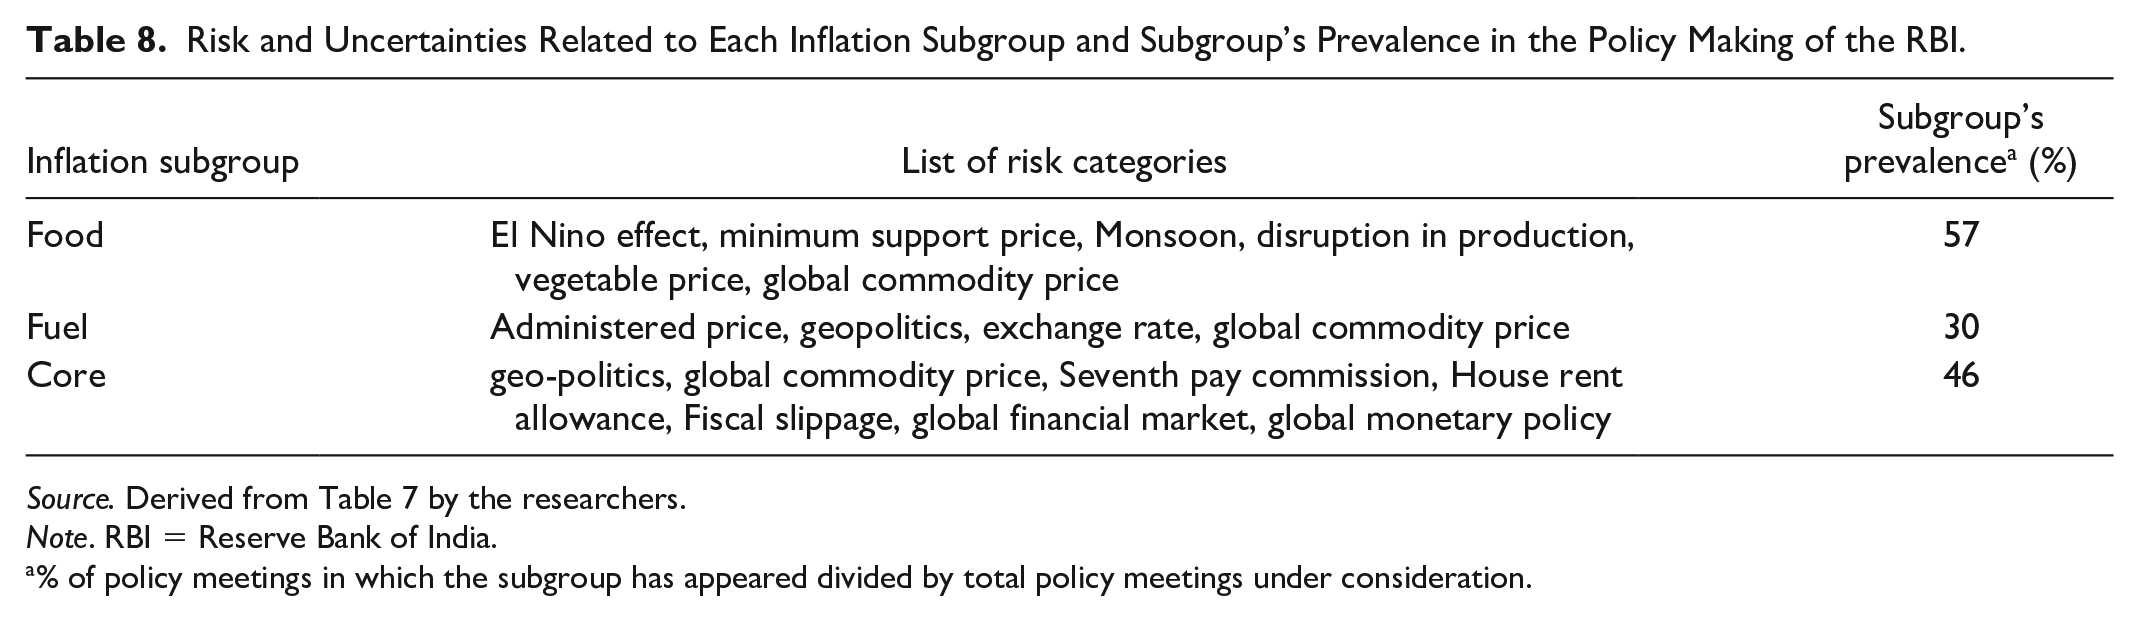
Source. Derived from Table 7 by the researchers.
Note. RBI = Reserve Bank of India.
% of policy meetings in which the subgroup has appeared divided by total policy meetings under consideration.
From the qualitative analysis, it can be seen that throughout FY 2014–2015 and 2015–2016, the MPC was concerned with the monsoon rainfall deficit and its impact on the food-grain production. The concern of the MPC regarding the rainfall deficit was justified, as 45.86% of the CPI is constituted of food items. The RBI remained hawkish about the monetary policy and kept the repo rate unchanged at 8% throughout FY 2014–2015.
In the FY 2014–2015, the central bank was cautious about the Federal Reserve System’s (The U.S. central banking system) possible normalization of monetary policy and its spillover impact on the Indian Economy (Policy Statements dated August 2 and 4, 2015). Despite inflation coming down from 8.6% in January 2014 to 5.6% in December 2015, the household’s inflation expectation was still in double digits (Policy statement on December 1, 2015).
Looking at the Governor’s statements for the FY 2016–2017, it can be deduced that the RBI was taken aback by the unfolding inflation trajectory (Policy statements in April, June, August, and December 2016 and February 2017). The volatility in food inflation was the main reason for this unexpected upward trend in inflation. It is interesting to look at the assessment of the RBI with respect to the impact of demonetization (announced on November 8, 2016) on inflation. MPC (the inaugural meeting was held on October 3–4, 2016) in its December 2016 meeting concluded that demonetization would have a marginal impact on inflation. In reality, however, the inflation rate decreased from 4.20% in October 2016 to 3.17% in January 2017, a reduction of 103 bps.
During the FY 2016–2017, the committee anticipated the impact of the central government’s implementation of the Seventh pay commission as a major risk and uncertainty for the inflation trajectory, particularly in housing subindices (10.00% of CPI). But with the benefit of hindsight, we can say that any significant impact of the Seventh pay commission on headline inflation was not observed, as CPI kept plummeting steadily and continuously since the Seventh pay commission’s implementation in June 2016 till the end of FY 2016–2017. This could be due to the fact that the pay commission recommendation was implemented phase-wise first for the central government employees followed by the state government employees.
Throughout FY 2017–2018, the MPC was concerned with the risk of fiscal slippage owing to goods and services tax implementation, farm loan waivers, the Seventh pay commission implementation, and revision in MSP for kharif crops. In this period, the state governments also started implementing the Seventh pay commission recommendations, and the RBI considered it as uncertainty to the inflation trajectory. The increase in perceived risk was also displayed in the inflation outlook index shown in Figure 1.
Scanning through the statements of FY 2018–2019 shows that the RBI overestimated the inflationary path and risks associated with it. For example, in its April 5, 2018, statement the MPC had forecasted that the inflation in the second half of FY 2018–2019 would be 4.4%, whereas the actual inflation rate settled down in the range of 1.97 to 3.38%. The MPC saw changes in the central government’s public procurement policy in which the government had decided to fix the MSP of crops at least 150% of the cost of inflation as a risk. It also saw oil price disruption due to the United States–Iran stand-off as a major external risk to inflation.
The impact of this misreading of the inflation trajectory during the period can be seen in the consequent increase in repo rate from 6% at the start of the year to 6.5% in August 2018. The inflation reading of January 2019 was only 1.97%, whereas the repo rate for the month was 6.5%, that is, the real interest rate of as high as 4.53%. This led to bitter friction between the central government and the RBI culminating in the resignation of the then Governor, Dr. Urjit Patel. The sharp decline in inflation was mainly due to the deflationary trend in food and fuel inflation, whereas the core inflation excluding food and fuel was sticky at around 5.5% to 6%.
With the benefit of hindsight, it is always easy to see the risks that an economy faces but for the policy makers who have to make predictions about the future, it is obviously difficult to evaluate the risks that the economy would be facing in the future. Moreover, in many instances, the MPC was correct in its evaluation of the risks and uncertainties related to inflation projection. But, the success in the quantification of these risks and uncertainties comes across as a mixed bag. The MPC had been able to predict the right direction of the inflationary path in only 16 of 31 months under study as displayed in Figure 1.
Table 8 summarizes Table 7 with respect to the inflation groups. It can be seen from the table that the RBI generally had identified monsoon rainfall and government MSP policy as the major risk and uncertainties to the inflation outlook. More importantly, risks related to food inflation were mentioned in 57% of the policy meetings. As food and fuel are supply-induced shocks, and they had been mentioned repeatedly in the policy meets as risk factors, it can be surmised that the monetary policy makers were primarily concerned with supply-side shocks. When it comes to core inflation, which was mentioned in 46% of the meetings, the associated risk factors that were identified were geopolitics, global monetary policy, government Seventh pay commission implementation, and fiscal slippage.
The qualitative text analysis reinforces the conclusions from the quantitative analysis in the earlier section. It shows that the RBI was much more concerned about supply-side shock than the demand-side shocks. This also implies that the RBI seemed to suggest that the CPI is affected much more by food and fuel shocks than the repo rate.
Discussion and Conclusion
This article demonstrates that analysis of qualitative data could unveil critical information that is often lost in verbiage and therefore overlooked. A corpus of 31 Monetary Policy Statements issued by the Indian central bank, the RBI, over a period of five years has been used to investigate the process followed by the governing body for inflation forecasting in India. In addition, the study helps to gain a more concrete understanding of the macroeconomic variables considered for the purpose of formulating monetary policy. The analysis of policy statements reveals that the policy makers scrutinized voluminous economic, financial, and sectoral data as well as economic indicators to gauge and forecast the macroeconomic outlook. The committee in its meetings extensively discussed agriculture-induced inflation with emphasis on the monsoon and the provision of MSP for food grains.
With the benefit of hindsight it can be said that while the MPC followed a robust forecasting process, it failed to foresee the sharp deflationary trend in food inflation in FY 2018–19. While in the period October 2018 to February 2019 food inflation was negative, the MPC had predicted inflationary risk in food inflation owing to the government’s revision of MSP for kharif crops. Significantly, the policy makers failed to recognize the secular deceleration in food-CPI inflation (constituting 46% of CPI) since the demonetization.
There are several possible explanations for this failure. As demonetization is a rare, unprecedented event, the MPC members were ill-equipped to understand its impact on inflation. This can be seen clearly from the MPC meeting of December 2016 which had forecasted a merely transitory effect of demonetization on inflation. On the contrary, demonetization had a long-term impact on several important aspects of the economy, for example, rural wages were depressed till 2019 (Viswanathan et al., 2021). Furthermore, the MPC framework was new, with its inaugural meeting held in October 2016, just a month before demonetization. Added to these is the fact that food deflation is practically unprecedented in India, making it all the more challenging for the MPC members to grasp the extent of food deflation stickiness (Raj et al., 2020). The geopolitical environment during 2018–2019 was unpredictable owing particularly to the United States–China trade war and the United States–Iran stand-off. Finally, the committee may have erred in grasping the magnitude as well as the duration of the deceleration in inflation during 2018–2019. The article leaves it to the wisdom of other researchers to ascertain which of these interpretations have merit.
This study also provides insight regarding the forecasting process followed by the MPC. In this article, it has been shown that it is possible to gauge policy sentiment by transforming the policy statements into quantitative indices. The research concludes that the MPC members did not see demonetization as a major disruption as far as inflation was concerned and were taken by surprise when it plummeted drastically in the subsequent months. They did not even take proactive measures by reducing repo rate sufficiently, as they believed that the dip in inflation was temporary. This might have hurt the economy as the real interest rate at that time was very high. Textual analysis enabled the researchers to identify the variables that were accorded greater importance in policy deliberations and would have influenced the inflation outlook of the members.
Finally, the researchers have made some suggestions for further research using the framework of the methodology used in this study. If one is interested in finding out the forecasting error or biasness of one particular committee member, he or she can use this framework to convert qualitative data into quantitative and then can use relevant nonparametric statistical methods to test the appropriate hypotheses. It would also be interesting to explore whether the policy statements had a predictive relationship with any other financial variable, such as the bond or equity market.
Footnotes
Declaration of Conflicting Interests
The author(s) declared no potential conflicts of interest with respect to the research, authorship, and/or publication of this article.
Funding
The author(s) received no financial support for the research, authorship, and/or publication of this article.