
Abstract
The success of the flipped learning approach is directly related to the preparation process through the online learning environment. It is clear that the desired level of academic achievement cannot be reached if the students come to class without completing their assignments. In this study, we investigated the effect of the use of gamification in the online environment of flipped learning to determine whether it will increase interaction data, participation, and achievement. We used a mixed-methods sequential explanatory design, which implies collecting and analyzing quantitative and then qualitative data. In the online learning environment of the experimental group, we used the gamification. However, participants in the control group could not access the game components. According to the findings, the experimental group had higher scores in terms of interaction data, participation, and achievement compared with the control group. Students with low participation can be encouraged to do online activities with gamification techniques.
Introduction
The digital generation has grown up with easy access to information and technology, which has changed their expectations of the learning environment. In line with the constructivist approach, students are demanding a more active role in the learning process. Students also have demands regarding the use of technology. Therefore, when building the instructional design, educators should prioritize activities that students can participate in more actively to achieve permanent learning. Optimizing or personalizing the course design in accordance with the needs of each student as much as possible can lead to permanent learning.
Personalized and blended learning approaches, which are offered as alternatives to a “one size fits all” approach, shift education away from being monotone. Hence, it is possible to design authentic learning environments that focus on teaching programs on an individual’s needs and skills. Flipped learning is a type of blended learning that offers students the opportunity to access content from anywhere and anytime via the online environment. The classroom environment includes learning activities where students can actively participate.
Flipped Learning
Traditional methods consist of two stages: transfer and making permanent of knowledge (Dixon, 2018). The transfer of knowledge is commonly accomplished by teachers in classroom, whereas making permanent step is usually completed by students through homework. The flipped learning reverses this classical format.
Students are required to study online learning materials prior to participating in face-to-face activities. In this way, the time that would be allocated to lecturing in the traditional methods is used for activities to reinforcing their initial learning. Students are expected to perform remembering, understanding, and applying activities, which are the first three steps of Bloom’s Taxonomy, before coming to class. As for the face-to-face process, Baepler et al. (2014) stated that learners could interact with the teacher and their peers through activities such as group discussions, case studies, and project presentations in the classroom; in doing so, they would have the opportunity to realize the steps of analyzing, evaluating, and creating in Bloom’s Taxonomy.
Gamification
Gamification is the use of digital game components in nongame environments (Deterding et al., 2011; Educause, 2011; Jo et al., 2018; Simões et al., 2013). Zichermann and Cunningham (2011) defined gamification as a process of using game mechanisms to improve problem-solving skills and increase engagement. The increasing use of gamification in e-learning environments can be explained through the fact that digital games help develop problem-solving, literacy, and active and reflective thinking skills (Gee, 2003). Studies have revealed that the use of game components in online learning environments increases productivity, effectiveness, motivation, and participation by providing students with a flexible environment that requires cooperative, problem-based learning; encourages active participation; and is student centered (Boyle et al., 2011; Dicheva et al., 2015; Jo et al., 2018; Tsay et al., 2018).
Gamification has become a favorite technique with increasing student motivation by adding the fun of games such as the leaderboard to the learning process (Jo et al., 2018). In addition, various design principles (e.g., goal, freedom to fail, competition, cooperation) and game mechanics (e.g., avatars, badges, unlocking content) motivate users to participate in learning activities (Landers & Callan, 2011; Losup & Epema, 2014). Components such as badges, points, levels, and virtual products contribute to extrinsic motivation, whereas components such as social graphs, team building, and unlocking content can function as intrinsic motivations for students who adopt these components with personal meaning (Banfield & Wilkerson, 2014).
Conversely, the presence of game components in learning environments may have a negative effect on students who do not like games (Whitton, 2007). The competitive factor that determines victory or defeat in games can adversely affect learning, and the high level of entertainment of the game may interfere with the attention and inquiry processes required by first learning (Jo et al., 2018). After a while, students may get used to the game components or find game components such as points, badges, and leaderboards simple, far from fun or competition, which may make it difficult for gamification to have a positive effect.
Literature Review
Flipped learning is a modern approach that offers the appropriate infrastructure for acquiring 21st-century learning skills. Studies have shown that flipped learning has positive effects on variables such as classroom communication and students’ satisfaction, motivation, attitude, attention, learning experience, cognitive load management, and academic achievement (Bishop & Verleger, 2013; Fulton, 2012; Goodwin & Miller, 2013; Hung, 2018; Leung et al., 2014; Mason et al., 2013; O’Flaherty & Phillips, 2015; Wilson, 2013).
In addition to these positive impacts, studies have shown that the approach encourages students to learn independently (Goodwin & Miller, 2013; Leung et al., 2014; Moffett, 2015; O’Flaherty & Phillips, 2015). Flipped learning provides students with different working styles and learning speed access to information through the e-learning environment. In addition, this approach helps teachers identify inaccurate or incomplete information during the in-class activities and gives students the opportunity to focus on high-level thinking skills such as problem solving and critical and creative thinking (Bergmann & Sams, 2012; Leung et al., 2014; O’Flaherty & Phillips, 2015).
Students take an active role in the process and strengthen their skills related to teamwork with collaborative group work (Hung, 2018; Leung et al., 2014; Zhamanov & Sakhiyeva, 2015). There is also evidence that sharing course contents prior to the in-class period changes the potential perception of the course difficulty (He et al., 2016).
The most frequently mentioned disadvantages of the flipped learning approach are the time and level of expertise required to prepare the online environment. The video recording and editing processes, creating presentations and text files, writing different types of questions, and designing and developing the environment in which all this content will be placed require prepreparation, financial resources, and expertise (Moffett, 2015; O’Flaherty & Phillips, 2015; Snowden, 2012; Wagner et al., 2013; Zhamanov & Sakhiyeva, 2015). However, although teachers who flipped their classes encounter different difficulties in the first stage, this situation can be turned into an advantage when they continue to use the existing materials in the following times.
Another disadvantage of flipped learning is that it creates the need for technology, such as computers, mobile devices, and high-speed internet connection, to access course content (Zhamanov & Sakhiyeva, 2015). Furthermore, it is not always possible to flip the courses at schools or universities due to the nonflexible nature of educational policies (Zhamanov & Sakhiyeva, 2015).
Beyond these disadvantages, students must have high motivation and autonomous learning skills. In the mid-1980s, Edward Deci and Richard Ryan introduced the self-determination theory, which focuses on self-motivation and provides an important theoretical basis for gamification (Deci & Ryan, 2002/2004) because gamified environments should aim to provide a sense of autonomy, competence, and/or a social commitment by motivating users internally (Tsay et al., 2018).
Although there are a large number of studies examining the possible effects of the game components used, few of these studies have been conducted in flipped learning environments. The summaries of the studies that took place between 2010 and 2019 where gamification was used in flipped learning and the possible effects that were examined are presented below.
In 2018, Huang, Hew, and Lo examined the effect of gamification on student participation in a flipped lesson. The experimental design was completed with 96 undergraduate students. The students in the experimental group showed higher quality products than the control group and scored higher than the control group in the posttest.
Jo et al. (2018) examined the effects of the use of game components in the online learning environment on the single group experimental design and the effects of gamification on precourse participation and achievement. As of half of the implementation process, it has made the game components accessible to students such as points, levels, leaderboards, and badges. As a result, the degree of preparation in the weeks of the game components increased from 65.6% to 78.9% compared with the first weeks using YouTube alone and showed a statistically significant increase. Academic achievement, however, increased from 78.9% to 84.5% after the application of the game elements and increased statistically significantly compared with the process before the application.
In 2018, Zainuddin examined the students’ learning performances and perceived motivations in a flipped learning environment designed on the basis of self-determination theory. A total of 56 students aged 15 and 16 participated in the study using a mixed pattern. In the study where point, badge, and leaderboard were used as a game component, the effect of game component usage on success and motivation was examined, and it was stated that the students in the gamified group had the higher motivation and showed a higher success.
Huang and Hew (2018) completed their experimental study with 40 university students. Researchers who defined badges in different categories as game components to the students in the experimental group investigated the effect of gamification on the number of completion of learning tasks and the quality of learning materials expected from the students. The results showed that the experimental group students completed more activities than the control group students and the experimental group produced higher quality work than the control group students.
In the study conducted by Aşıksoy in 2017, game components such as points, badges, and leaderboards were made available to the students in the experimental group. Thus, the effect of gamification on motivation and academic achievement was examined. Experimental results showed that the students in the experimental group had significantly higher academic success and motivation than the students in the control group. In addition, it was determined that the students’ views about the playful classroom environment were positive.
Present Research
The literature includes few studies on the use of game components in a flipped learning. However, most of these studies are about the gamified of the in-class environment rather than the online environment. When the online gamified studies were analyzed, it was seen that some of them (Hung, 2018; Zhamanov & Sakhiyeva, 2015) used a game-based online environment instead of gamification. Although other experimental studies (Huang et al., 2019; Huang & Hew, 2018; Jo et al., 2018; Zainuddin, 2018) examined the students’ interest and participation in the online environment through gamification, they did not examine interaction data such as time on site or pageviews. However students’ interaction data and online participation directly related to their prelearnings (Denny, 2013; Hao, 2016; Hew et al., 2016; Kuo & Chuang, 2016). The higher pageviews signify that more number of times the page belonging to a particular course is visited. This shows the popularity of that particular course. Also, the higher the time spent on a page belonging to a particular course, it can be inferred that the users are very serious and making in-depth study for the particular course (Vivekananthamoorthy et al., 2009). Thus, it is necessary to ask the question of how we can motivate students to participate in online activities and to increase their online environment interaction.
To address these research gaps, we investigated gamification as an innovative approach to determine whether it will increase interaction data, participation, and achievement.
Thus, the research questions in this study are as follows:
Method
In this research, we used a mixed-methods sequential explanatory design. Figure 1 summarizes the pretest–posttest control group design.

The process of pretest–posttest control group design.
As seen in Figure 1, we also gathered the participants’ opinions to detail the quantitative data at the end of the 9-week research period.
Procedure
Online learning process
We designed two environments in which the experimental and control groups could individually access the online environment of flipped learning. For both environments, we purchased domain names and Linux-based hosting services and installed WP, a content management system. We chose WP instead of learning management systems such as Moodle because WP frequently performs security updates, has an appropriate page structure for indexing by Google and other search engines, and has a user-friendly, modern management panel and interface. WP also has a plugin and theme market that can meet any need.
We chose a theme to include the learning management system features from the theme market, so the platform could provide the course, lesson, registration, and profile pages for users in different roles (i.e., students, teachers, administrators). We ensured that the online environment had as simple and user-friendly an interface as possible. We made some small-scale changes in the process based on the students’ feedback on usability.
We used video editing software to render the instructor’s lecture videos at high resolution with a maximum length of 5 to 6 min. During this arrangement, we obtained various animations from different web tools to ensure visual richness in the videos. The intros designed were placed at the beginning and end of the videos. By adding short answer questions to different sections of the video contents (Figure 2), we aimed to increase the viewing rates of videos.
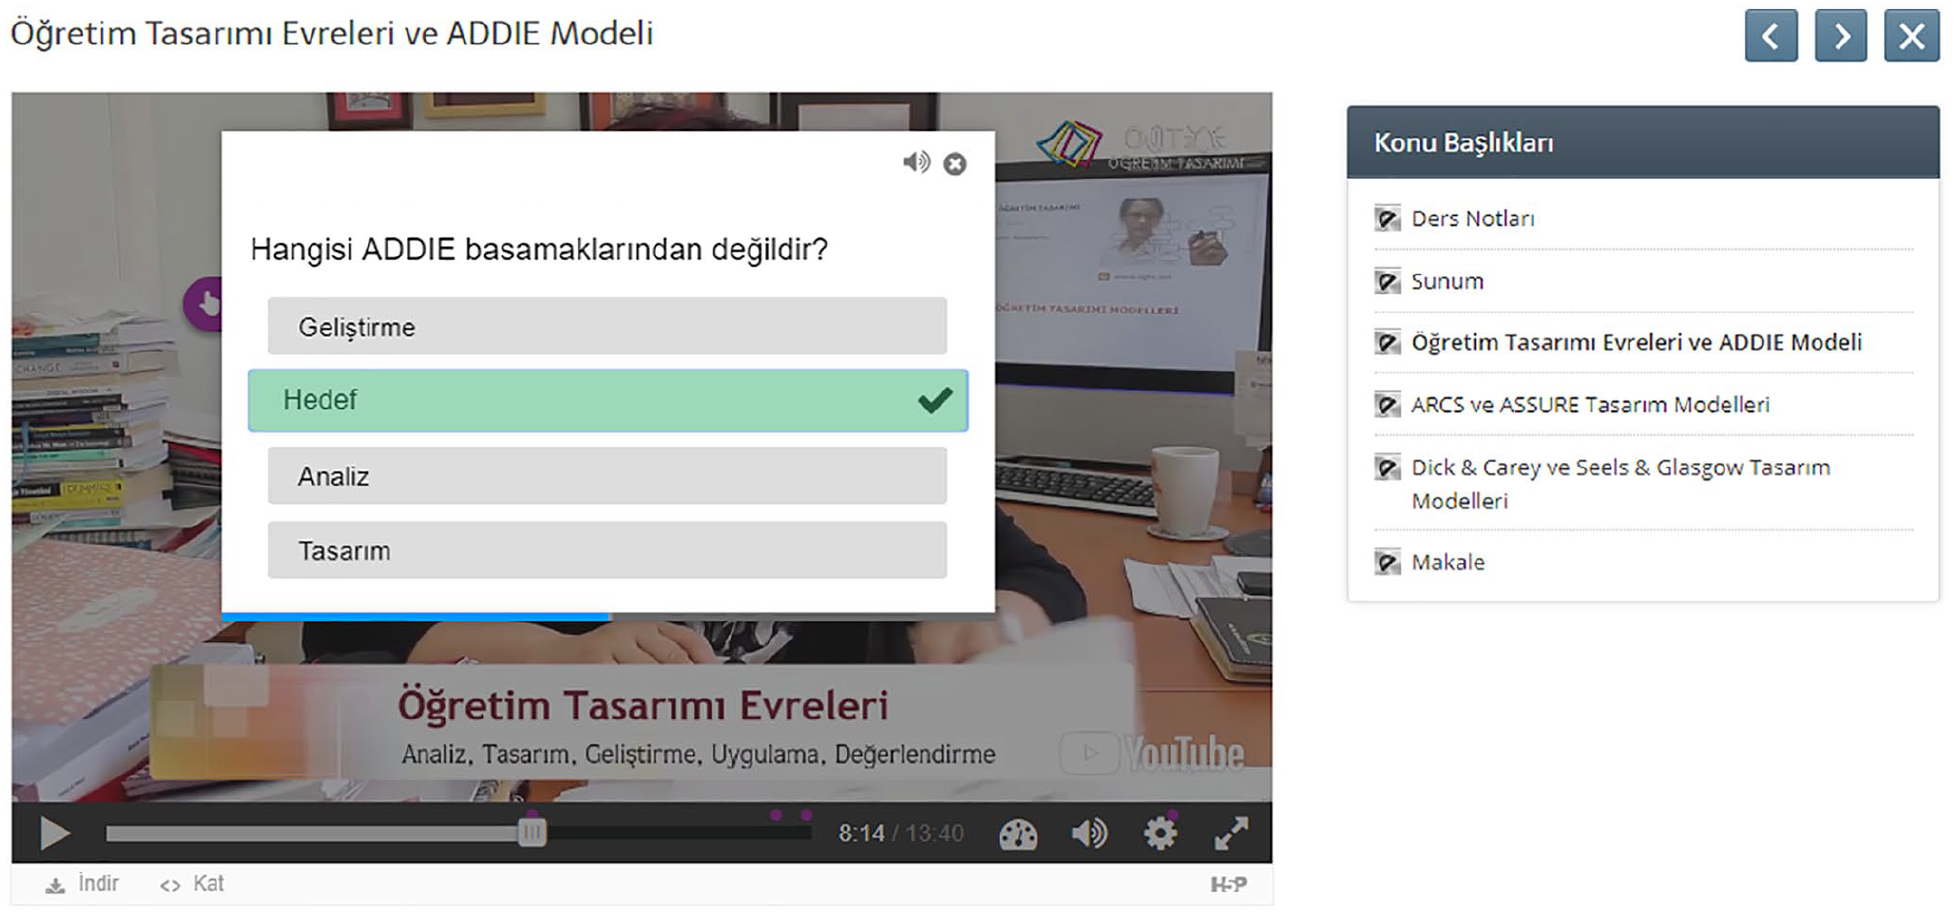
Interactive video content.
The instructor’s course video, presentation file, and podcast were presented weekly. We also activated a question-and-answer (Q&A) plugin that could be accessed only by students. The scope of questions and answers was limited to the subject of that week, but the number of questions was unlimited.
We announced that the number of questions and answers asked did not have a direct effect on the final grade, but the experimental group students gained points in the context of gamification.
Although online environment design for experimental and control groups is separate, the only difference between the two environments is the design of profile pages. The profile page of the control group (Figure 3) included only the user information and the profile photo, whereas the profile page of the experimental group (Figure 4) included the game components in addition to these components.
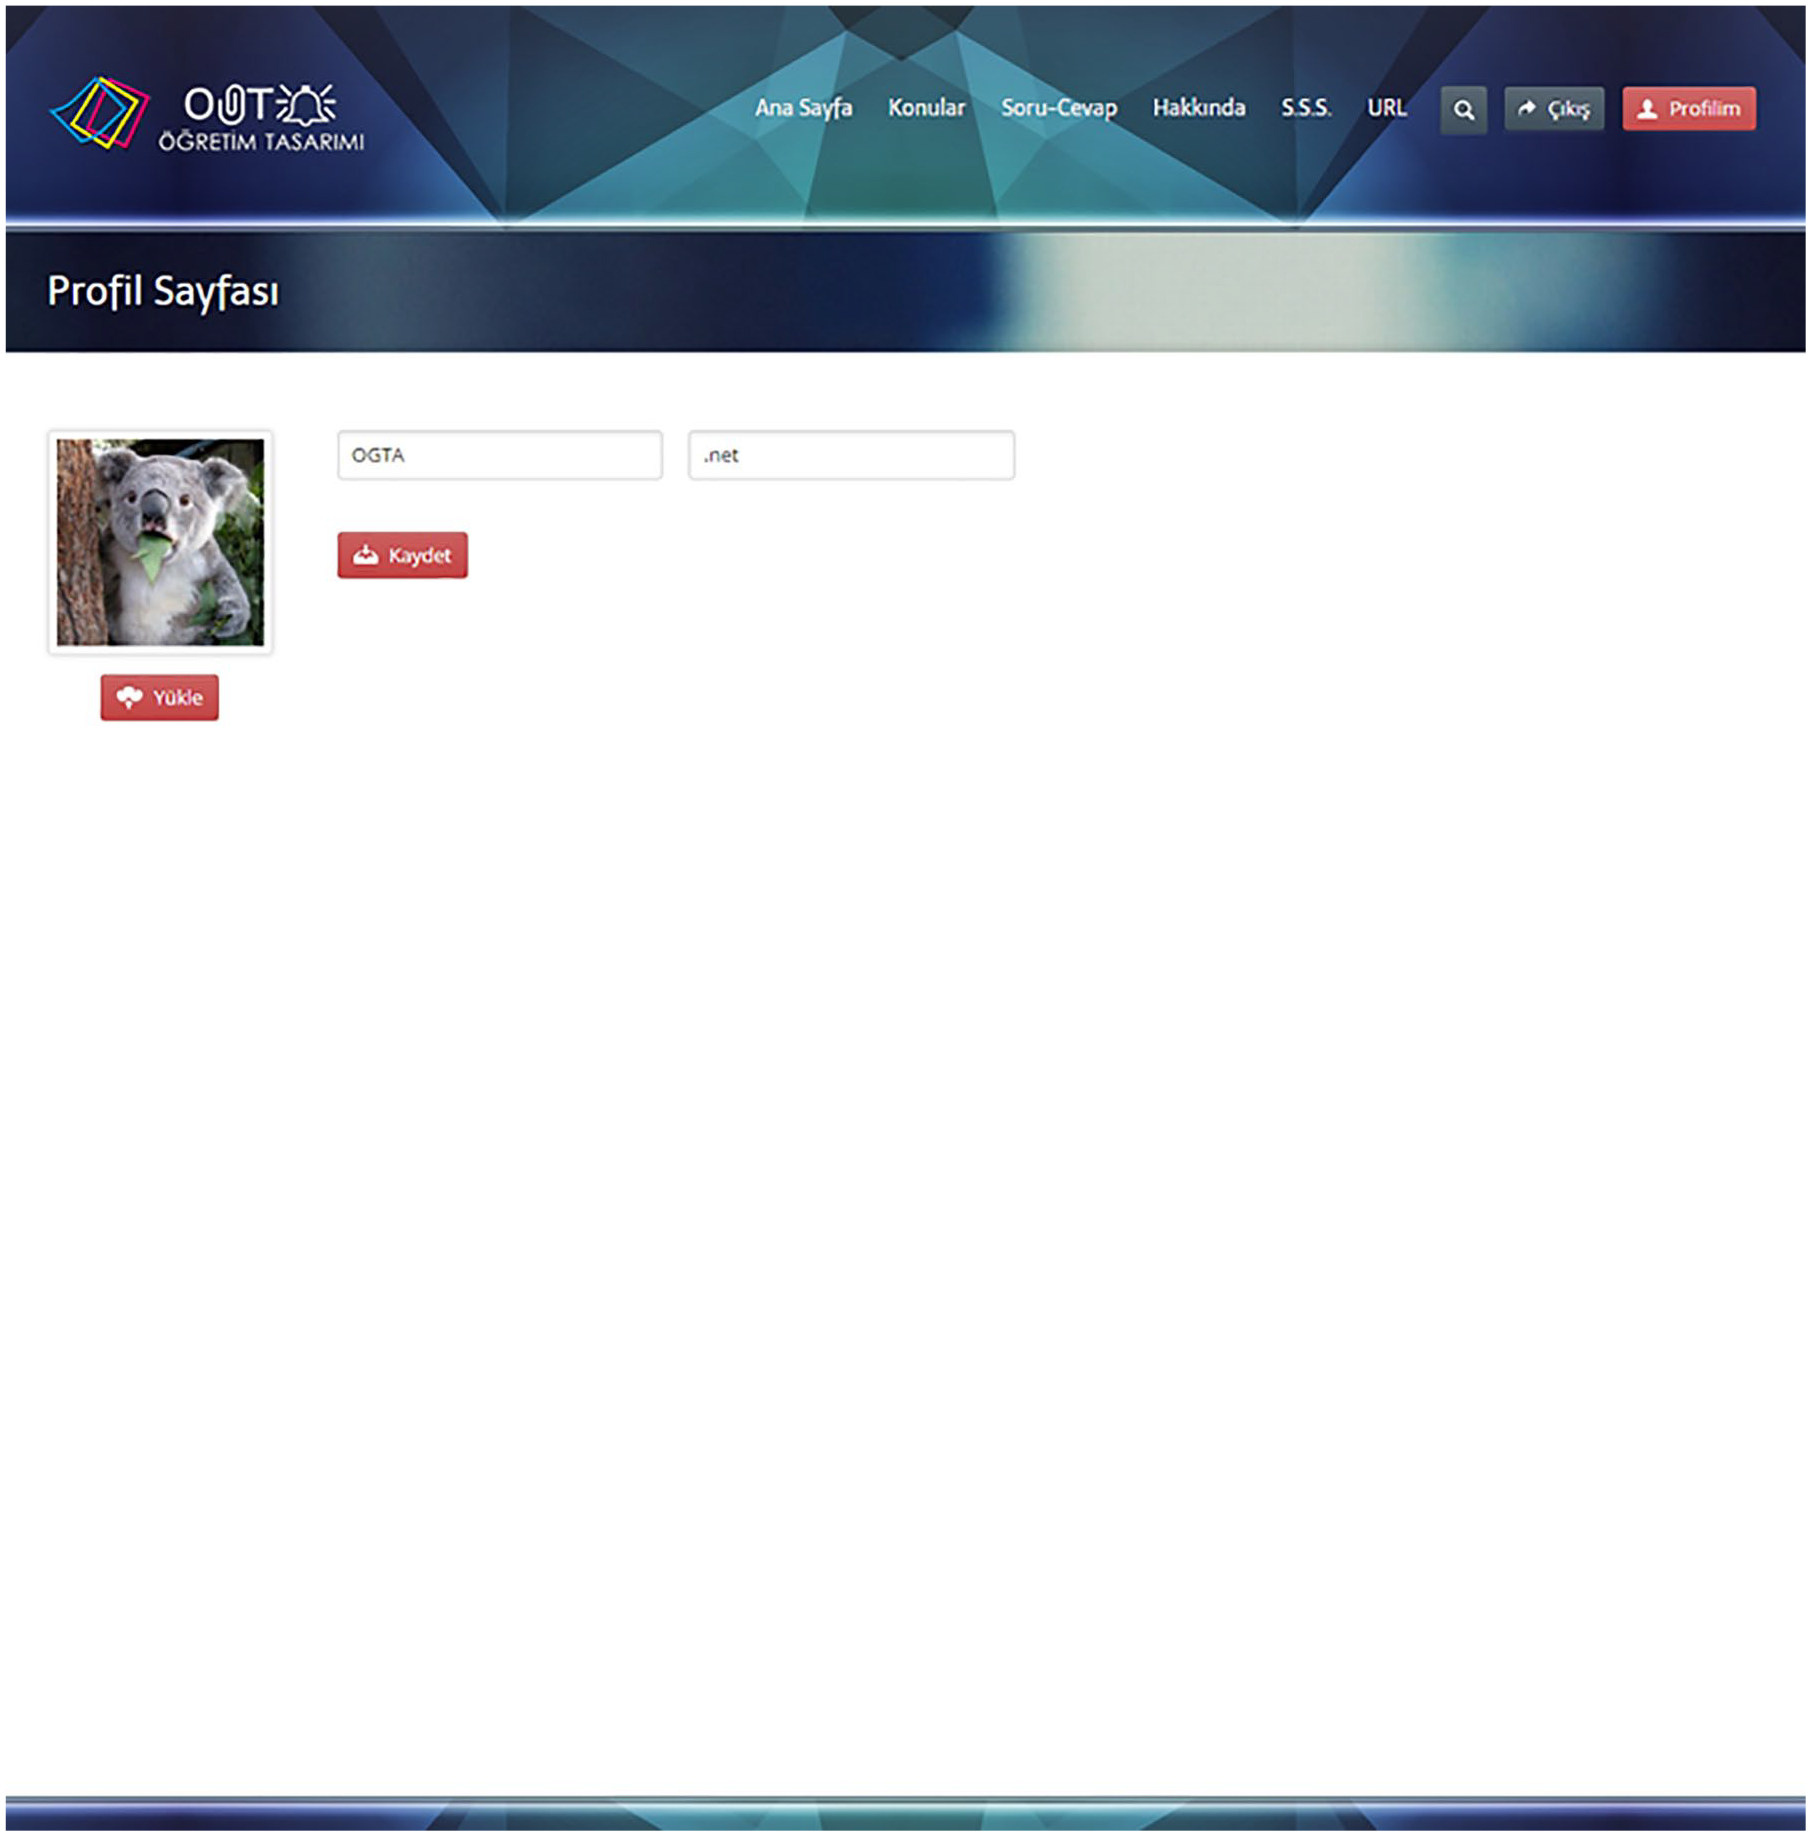
Control group profile pageview.
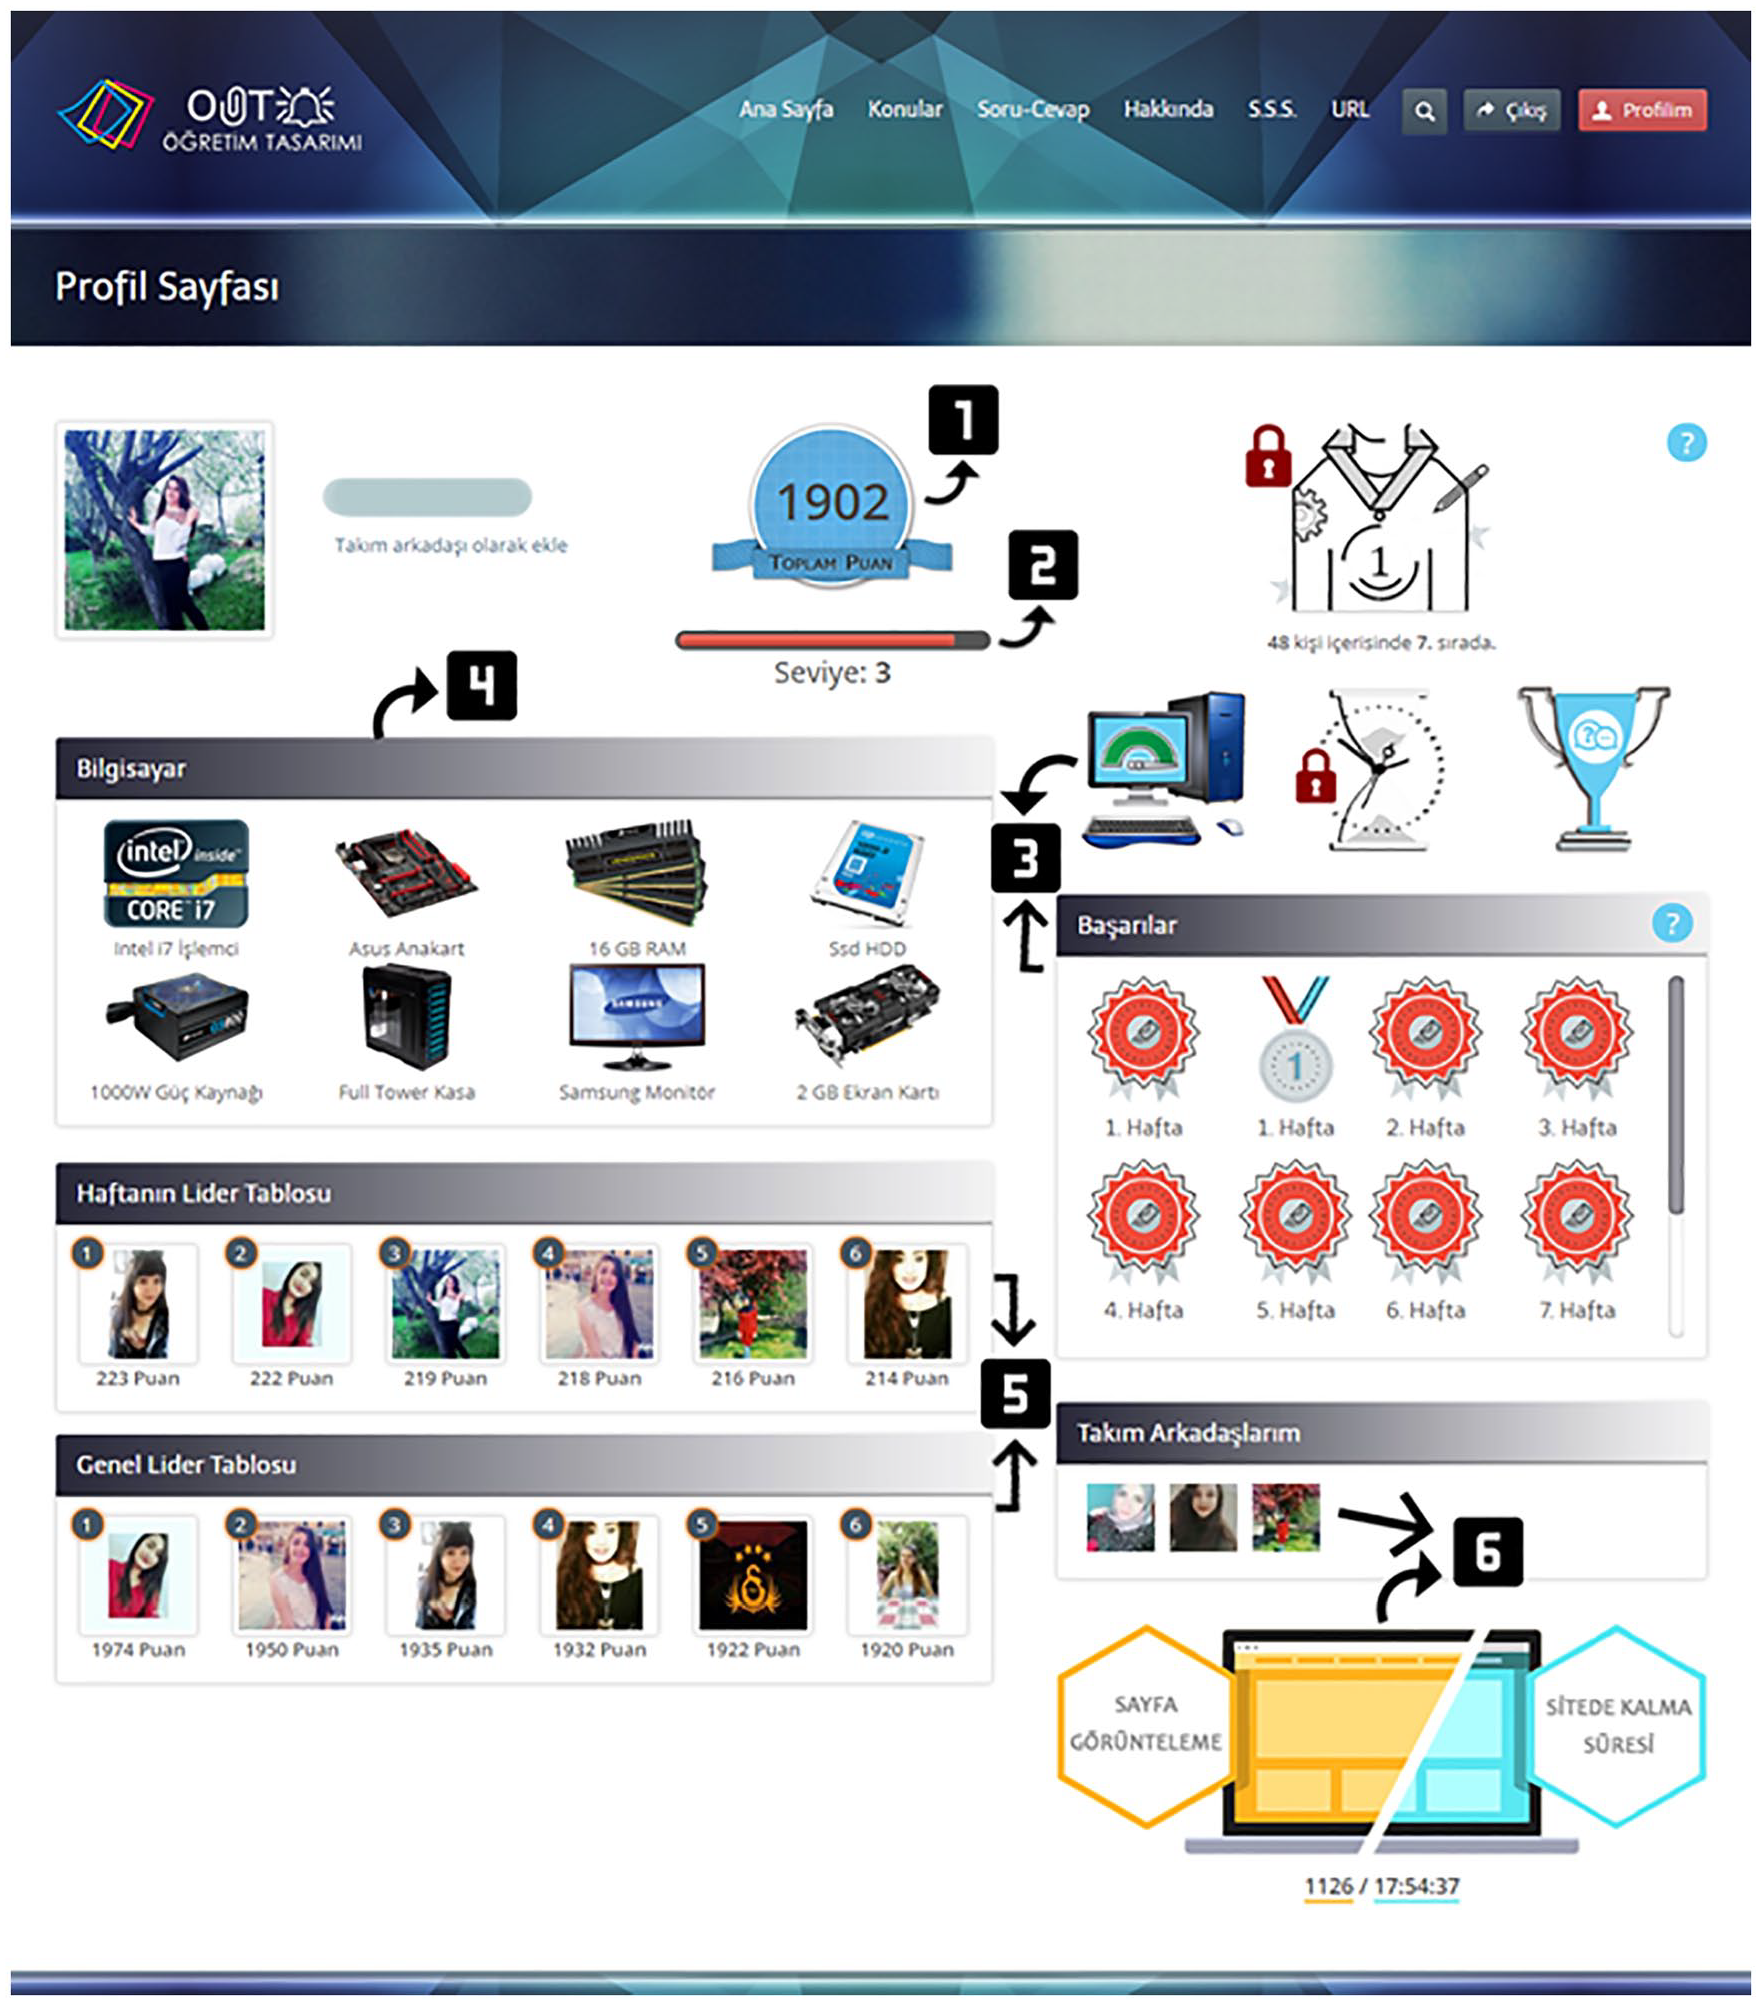
Experimental group profile page view.
This study is not intended to use all game components that can be used in online learning environments. Muangsrinoon and Boonbrahm (2019) conducted a systematic review to determine which game components are often used in gamification research. The frequently used game items according to the results are points, level, leaderboards, badges, avatars, and social graphics. Most gamification studies consist of a combination of game elements: scores, badges, levels, leaderboards, and progress bars. Among these combinations, the combination of scores, badges, and leaderboards (sometimes referred to as PBL) is the most used (Nicholson, 2015). The reasons why scores, badges, and leaderboards are frequently used in gamification studies are that they are similar to the traditional classroom assessment model and are also easy to implement. This combination can be applied to almost any context (Dichev & Dicheva, 2017). We examined the effect of the basic game components needed to enable gamification of the environment. The following game components were used in the experimental group of this study:
Points (1),
Level (2),
Badges and achievements (3),
Collections (4),
Weekly and general leaderboards (5), and
Teammates and statistical graphs (6).
Participants in the experimental group were able to earn points by answering questions embedded in videos, writing blogs, and participating in question–answer activities. These points have passed to the next level with intervals of 250, 500, 1,000, 2,000, 4,000. With these points, participants were able to purchase computer equipment as part of the collection.
The participants, who were leaders in the general leaderboard or weekly leaderboard, who reached 2,000 pageviews, who stayed 10 hr on site, and who reached 10 questions and 10 answers on the Q&A page gained different badges and achievements. They were also able to give the collection to their teammates.
Figure 4 shows the profile page of a student in the experimental group. The students in the experimental group were able to access the visual components of the game, whereas members of the control group were not.
We used formative assessment and evaluated students’ participation in activities in both online and classroom environments. In-class activities (participating in the jigsaw event, winning in the Kahoot competition, and the scores from the Socrative) and the questions embedded in the videos composed the final grade of the students.
Game components did not directly contribute to the final grade. For example, if the participant won a badge or entered the leaderboard, this achievement did not result in a change in the final grade. Similarly, the participants in the experimental and control groups were not given extra grades for weekly blogging and Q&A activities.
This situation has been applied to minimize the impact of different concerns such as high final grade. Except for this difference in the profile pages of the experimental and control groups, all other pages in the online environment were kept the same in both content and design. Likewise, the in-class process was designed with the same activities in both groups. By doing so, we aimed to reveal only the effect of gamification on dependent variables (i.e., pageviews, time on site, number of blog entries, number of participants in the question–answer activity, achievement).
In-class learning process
During the 9-week course, the in-class activities started with jigsaw, which was the first activity for getting students together. This activity encouraged cooperative learning and allowed students who were not prepared for the course to learn the missing information from their peers. With the jigsaw activity, the weekly topic was revised as peer learning among the students. The second activity in the classroom was competitive Kahoot. The fact that the members of the group who completed the Kahoot activity first would gain points increased their participation in the first activity, jigsaw. In the third and last activity, all students took short exams on Socrative individually. Thus, the learning process that started at home culminated in a short quiz in the class. Both experimental and control groups participated in these activities in the same way.
Instruments
The achievement test developed by the researchers was used as a pretest–posttest at the beginning and the end of the application. In addition, we conducted semi-structured interviews at the end of the process to gather students’ views.
Achievement test
While developing the achievement test for the instructional design course, we considered the scope and achievements of the weekly subjects. In the first stage, we interviewed three instructors specialized in the field of instructional design and one linguistic expert to gather their insight on the achievement test consisting of 36 questions. Then, we made corrections to the comprehensibility and consistency of the scientific information. In the academic year 2015–2016, we conducted a pilot study with 79 students taking this course.
As a result of the item analysis, we excluded six items with item difficulty index below 20%, resulting in an achievement test consisting of 30 questions. These data were analyzed using the SPSS statistical program, resulting in Cronbach’s alpha reliability coefficient of .82.
Semi-structured interview form
We obtained qualitative data through semi-structured interviews, which are preferred in qualitative research. According to Merriam (2013), the questions are flexible in the semi-structured interview technique. There are no predefined question details, but participants respond to the same questions, which increases the comparability of the answers.
Using the semi-structured form, we asked students in the experimental and control groups the following questions:
Have you ever written a blog during the semester? 1.1. If your answer is “yes,” can you please tell us why? 1.2. If your answer is “no,” can you please write down why?
Have you ever shared anything on the Q&A page during the semester? 2.1. If your answer is “yes,” can you please tell us why? 2.2. If your answer is “no,” can you please write down why?
Interaction data plugin
However, the site interaction data were automatically recorded in the database via Slimstat plugin (Figure 5) installed in the WP system. We were able to access the data belonging to any user via the administration panel.

Site interaction data plugin screenshot.
We used manual analysis on the database to determine the number of questions and answers for each participant.
Participants were informed that they could write a blog on the weekly subject. At the end of the application process, we manually counted the number of valid weblog entries of the participants.
Participants
In the spring semester of the 2016–2017 academic year, 81 students who were enrolled in an instructional design course at a state university participated in the study. Students take the instructional design course during their fourth semester to learn about the steps, principles, and models of instructional design. Participants were randomly assigned to the experimental and control groups. However, three participants from the experimental group and four participants from the control group were excluded from the process because they did not attend the course.
Of the 74 students who continued the process, 37 were in the experimental group and 37 were in the control group. In addition, 41 participants (55.4%) were female, whereas 33 (44.6%) were male.
Data Analysis
Analysis of quantitative data
Pretest–posttest data were analyzed using the analysis of covariance (ANCOVA) method. To test the effect of the experimental process, we proposed and applied ANCOVA methods in the pretest–posttest control group design. We used the Mann–Whitney U test to analyze the difference between interaction data (pageviews and time on site) and participation (blog and question–answer activities) because the assumptions of the t test are not met.
Analysis of qualitative data
Qualitative data were gathered through semi-structured interviews in our study and were analyzed inductively. The main feature of all content analysis is to separate the text into much smaller categories of content (Burnard, 1996). It is assumed that the views classified in the same category have a similar meaning (Cavanagh, 1997). The inductive analysis process used in this study has two main stages: organizing and reporting.
The organizing process includes open coding, category creation, and abstraction steps (Hsieh & Shannon, 2005). During the open coding phase, all texts were read and codes were generated during reading. Following this step, codes with similar characteristics were combined under category lists. The aim of grouping the data was to reduce the number of categories by reducing similar or different ones to the wider upper level categories (Downe-Wamboldt, 1992). And, we have named the resulting themes in the abstraction phase.
In the reporting step, we have interpreted themes or categories and used some quotations to support these comments.
To ensure the trustworthiness of the qualitative findings, we followed the steps of Guba (1981). First, we held peer debriefing sessions with two faculty members to get feedback on interview data, codes, categories, themes, and comments. Second, we have made persistent observations to the understanding of what is essential or characteristic by providing extended interaction with the process and we have spent enough time on the online learning environment. Third, we collected referential views, against which findings and interpretations can later be tested. Finally, we tested every datum and interpretation against all others to be certain that there are no internal conflicts or contradictions.
Results
This section contains the findings related to the research questions and evaluations of these findings.
Do Students’ Pageviews Show a Significant Difference According to the Gamification?
The total number of pageviews of the students in the experimental and control groups was given with a treemap.
An examination of the treemap in Figure 6 reveals that the total number of pageviews of students in the experimental group was more than 3 times that of the control group.

Total pageviews of the students in the experimental and control groups.
We used the Mann–Whitney U test for nonparametric statistical methods to test the significance of the differences between the data. Table 1 presents the results.
Mann–Whitney U Test for Pageviews.

According to Table 1, there was a statistically significant difference in the number of pageviews between the experimental group participants (median = 532) and the control group participants (median = 290; U = 265.50, p < .05). This finding indicates that the gamified online environment of flipped learning significantly increased the number of pageviews.
Do Students’ On-Site Times Differ Significantly According to the Gamification?
The graph shown in Figure 7 presents the amount of time spent in the online learning environment by students in the experimental and control groups.

Time on site of the students in the experimental and control groups.
The graph shows that students in the experimental group spent almost twice as much total time on the website than students in the control group. We used the Mann–Whitney U test for nonparametric statistical methods to test the significance of the difference between the data. The findings are given in Table 2.
Mann–Whitney U Test Regarding the Time Spent on the Website.

Table 2 reveals a statistically significant difference between the time spent on the website by participants of the experimental group (median = 38,831) and by participants in the control group (median = 26,719; U = 379.00, p < .05). This result shows that the game components significantly increased the total time spent on the website by the experimental group.
Does the Number of Blogs Written by Students Show a Significant Difference According to the Gamification?
The graph shown in Figure 8 shows the total number of blogs written by students in the experimental and control groups over 9 weeks.

Total blog post of the students in the experimental and control groups.
The graph examined shows that students in the experimental group wrote more than 10 times the number of blog posts as students in the control group. We used the Mann–Whitney U test to determine the significance of the differences in the data. The results are given in Table 3.
Mann–Whitney U Test Regarding the Blog Writing Numbers.

Table 3 reveals a statistically significant difference in the number of blogs written by the experimental group participants (median = 8) and by the control group participants (median = 0; U = 252.00, p < .05). This finding shows that the gamification of the online environment was effective in increasing the number of blogs.
Of the 37 students in the experimental group, 28 (75.7%) answered “yes” to the question “Have you ever written a blog during the semester?” The follow-up question asked them to explain why they had written blogs. The “to gain more points” code was the most expressed (n = 13) reason for blog writing given by students in the experimental group. The second most expressed (n = 8) opinion was “getting a place on the leaderboard.”
Furthermore, four students stated that they want to “share what they know” and three students highlighted that “loving blogging.”
These results reveal that the game components were effective in influencing the blog-writing habits of students in the experimental group. This result coincides with the findings from Table 3.
The following are the examples of students’ views on this question: I participated for the points I would get from the blog. I didn’t want to be left behind in the leaderboard, even if it didn’t affect the final grade. (S37) I think the most important point of blog writing was that it allowed us to earn points because I was raising my total score to a very high level instantly. This increasing score helped me get more motivated. (S35) I felt the need to write down what I learned about the subject. I wanted others to benefit as well. At the same time, I wanted to increase my score and enter the general leaderboard. (S31)
Nine students in the experimental group (24.3%) answered “no” to the question “Have you ever written a blog during the semester?” When asked why they did not participate, the students offered various opinions. The most frequently (n = 6) mentioned reason for not writing blogs was that they did “not directly affect the final grade.” The “requires effort” code was in second place (n = 3).
In addition, two students mentioned that blogging “took a lot of time.”
Examining the opinions of the students in the experimental group who did not prefer to write blogs reveals that gamification was found to be not motivating on these students. Designers need to be careful when selecting game components that will be a part of the environment. Incorrect or incomplete choices may adversely affect student participation (Kocadere & Çaglar, 2018).
The views of students are shared below: I would write it if it affected the grade, but once I learned it had nothing to do with the grade, I stopped writing. (S05) I would love to participate because I love writing. However, the fact that the decision of writing was in my own hands and that they were not going to give me any points in return prevented me from writing blogs. (S11) I did not want to write it once I learned that it did not affect the final grade. (S25)
In total, eight of the 37 students in the control group (21.6%) answered “yes” to the question “Have you ever written a blog during the semester?” In this 9-week-long study, these eight students wrote a total of 20 blogs. When asked why they had written blogs, the findings reveal that four out of eight students in the control group who wrote blogs stated that they do so “thinking that it would contribute to the final grade.”
In addition, three students said “loving blogging,” and one student explained that he wrote because he wanted to “reinforce his knowledge.”
I wrote only once. Just for the points. (S11) I wrote only in the first week. I thought it was obligatory and we would be getting points. (S19)
Of the 37 students in the control group, 29 (78.4%) answered “no” to the question “Have you ever written a blog during the semester?” When their reasons for not writing blogs were examined, the code “writing a blog takes a lot of time” was the most frequently (n = 8) expressed opinion for why students in the control group did not write blogs. The code “not affecting the final grade directly” was the second most expressed (n = 4) opinion.
Furthermore, “it did not imperative” code was in third place (n = 4). And, the “not interesting” code was the last (n = 3).
Examining these opinions reveals that students who did not see any benefit of the blogging activity did not show any interest in this activity. Students offered the following opinions: The intensity of the other courses and the high number of project studies are exhausting enough. At first, I wanted to, but then I gave up. (S09) I thought it would be a waste of time when the course started, so I did not continue writing. (S10)
Does the Number of Students Participating in the Question–Answer Activity Differ Significantly According to the Gamification?
The graph of the total number of questions and answers written by students in the experimental and control groups over 9 weeks shown in Figure 9.

Total questions and answers of the students in the experimental and control groups.
Members of the experimental group asked and answered a total of 2,959 questions and answers, whereas this number was only three for members of the control group. The size of the difference can be seen in the treemap. We used the Mann–Whitney U test to test the significance of the difference of Q&A activity participation data between students in the experimental and control groups. Table 4 presents the results.
Mann–Whitney U Test on the Participations in the Question-and-Answer Activity.
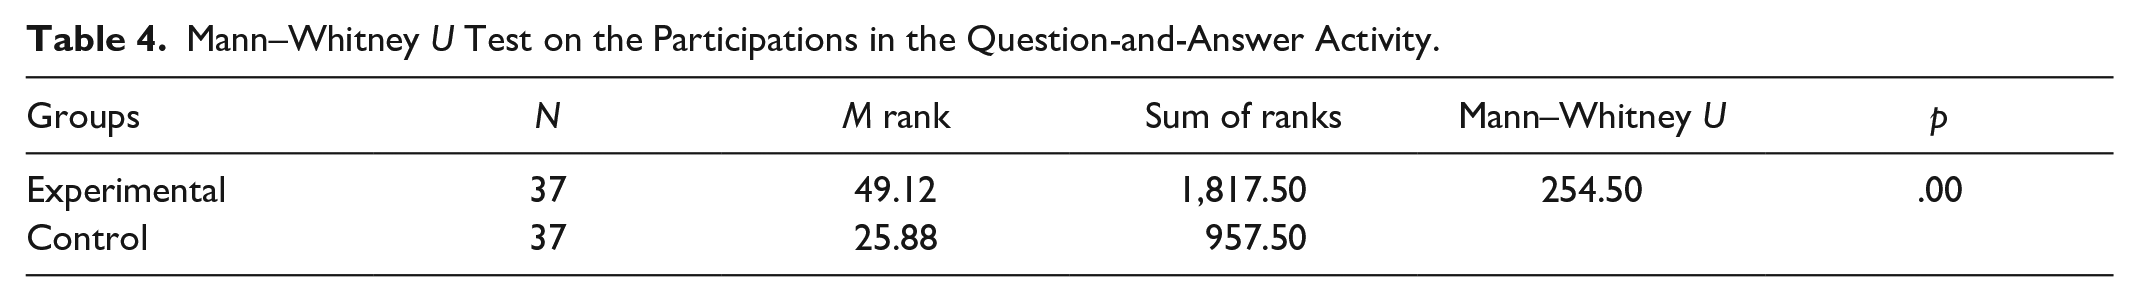
Table 4 highlights a statistically significant difference between the number of questions asked and answered by participants in the experimental group (median = 7) and participants in the control group (median = 0; U = 254.50, p < .05). This finding indicates that the gamified online environment was effective in increasing the number of participants in the question–answer activity.
We also analyzed students’ views about their participation in the question–answer activity. A total of 20 of the 37 students in the experimental group (54.1%) answered “yes” to the question “Have you ever shared anything on the Q&A page during the semester?” When asked why they participated in the question–answer activity, the “earning points” code was the one most frequently (n = 12) expressed by students in the experimental group. The second most given (n = 6) response was “getting a place on the leaderboard.” In other words, the game components were effective in encouraging participation in the question–answer activity by students in the experimental group.
Furthermore, five students explained that they participate in the question–answer activity because they wanted “reinforce their knowledge.”
The opinions of the students are as follows: I love competition. I tried hard to increase my score in the first weeks. (S13) It had the same purpose with a blog. There were times I asked a lot of questions to become a part of the leaderboard. (S36) I participated in this activity to revise what I’ve learned and to increase my score. I did all of them at the same time. (S1)
A total of 17 students in the experimental group (45.9%) answered “no” to the question “Have you ever shared anything on the Q&A page during the semester?” When asked why they did not participate in this activity, the “waste of time” code was the most commonly expressed (n = 6) opinion given by students in the experimental group. The “multiple unnecessary questions being asked just to get some points” code was in second place (n = 5). Taken together, the findings reveal that the sense of competition brought by gamification can negatively affect the learning environment. The sense of competition also caused some participants to ask unnecessary questions to earn points. This situation even reached a point where some students were given up from participating in the question–answer activity.
The opinions are shared below: After the first week, I forgot it. I mostly watched the videos and researched the topic provided for blog writing. (S08) Because I noticed that people were writing unnecessarily, so I stopped writing. (S12) Since it was a virtual point, I did not need it. (S25)
Three of the 37 students in the control group (8.1%) answered “yes” to the question “Have you ever shared anything on the Q&A page during the semester?” These three students stated that they participated in the activity only to “strengthen” their knowledge. One student’s opinion is given below.
I asked my friends to learn the things I’m not sure of. (S30)
In turn, 34 of the 37 students in the control group (91.9%) answered “no” to the question “Have you ever shared anything on the Q&A page during the semester?” Students in the control group most commonly (n = 23) stated they did not participate in the question–answer activity because failing to do so did “not affect the final grade.” The “not feeling the need” code was in second place (n = 6). Examining the opinions of the students reveals that the low level of participation in the question–answer was a result of the activity not being rewarded in any way. Student opinions were as follows: . . . Since it was not giving us any points, I did not participate. (S19) . . . I did not have any problem with the courses. If anything, I asked my friends about it. That’s why I did not participate. (S10)
What Is the Effect of Gamification on Students’ Achievement in Flipped Learning?
At the end of the study, the experimental group or the control group that scored higher than the final test may seem more successful. However, the main aim is to reveal the contribution of the intervention in the process to reach this point rather than the point reached. In other words, what is important in experimental designs is the difference between the initial and final points.
Descriptive statistics regarding the pretest and posttest scores of the participants in the experimental and control groups are given in Table 5.
Descriptive Statistics Regarding to Pretest–Posttest Scores.
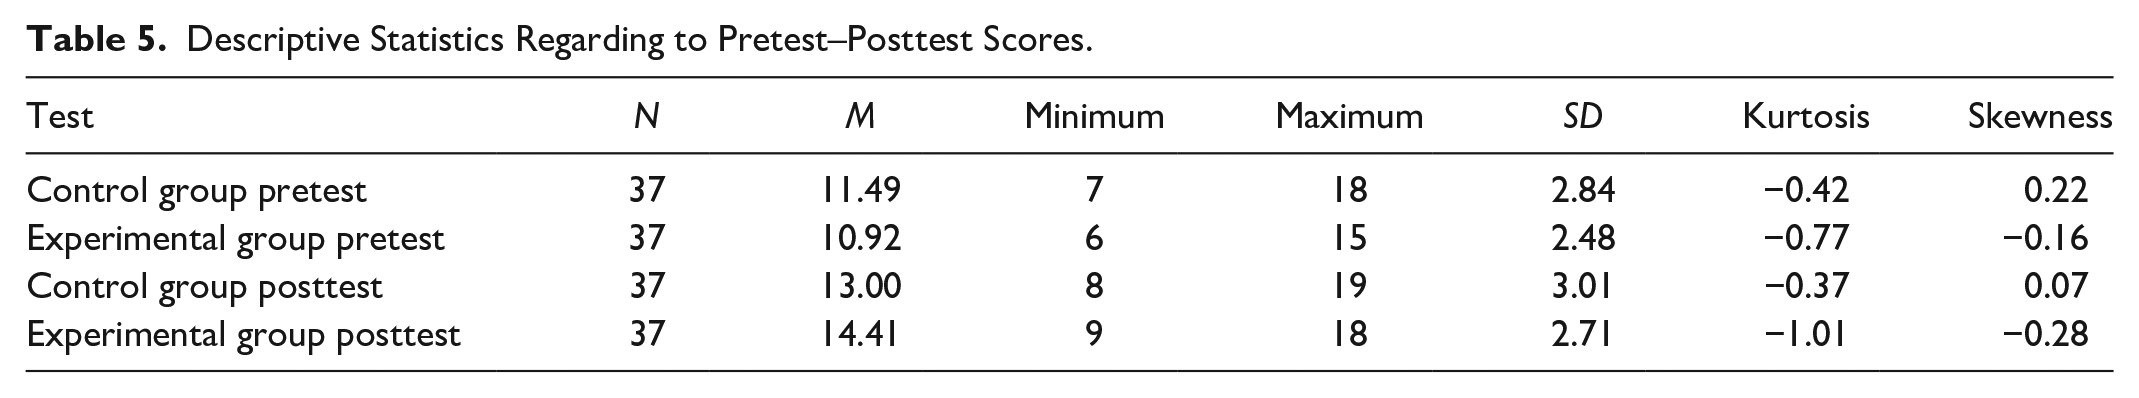
When Table 5 is examined, it is seen that pretest–posttest data of control and experimental groups have a normal distribution.
While comparing the posttest scores of the students in the experimental and control groups, we preferred to use covariance analysis (ANCOVA) to control the pretest scores. Data of the dependent variable, at least the interval scale, have normal distribution characteristics in each subgroup (for four separate groups in the pretest and posttests of the experimental and control groups; Table 5). In each measurement performed in more than one group at the same time, the variances of the groups were homogeneous and no significant difference was found between the covariances of the groups for binary combinations of the measurement groups. The covariance analysis according to the corrected scores table is given in Table 6.
Tests of Between-Subjects Effects.

R2 = .271 (adjusted R2 = .251).
Table 6 reveals a statistically significant difference between posttest scores corrected according to students’ pretest scores (p < .05). In other words, the use of gamification on flipped learning had a positive effect on students’ achievement.
Discussion
In the study, we analyzed the effect of gamification on online interaction, participation, and achievement in the context of flipped learning. After 9 weeks, we examined the total number of pageviews and the time spent on the website by students in the experimental and control groups. Experimental group participants who had the gamified online environment had significantly more pageviews compared with the control group participants who did not use the game components. Experimental group participants also spent more time in the environment.
Although they do not examine the effect of gamification in the flipped learning approach, some studies have also reported that gamification has a positive effect on pageviews and time on site. Denny (2013) and Kuo and Chuang (2016) concluded that the game elements positively affect the interaction data such as time spent on the site and the total pageview. According to the results of a systematic review study on the effects of gamification on pageviews, two studies found that gamification has positive effects, whereas three studies found no significant effects on pageviews (Looyestyn et al., 2017).
The results show that students participate more in activities with gamification, and they report the course as both more motivating and interesting than nongamified courses. When we examined students’ participation in the blogging and question–answer activities, we determined that gamification encouraged the participants of the experimental group to participate more than the control group students. The fact that students who used game elements such as points, levels, and leaderboards during the 9-week period had higher numbers in variables such as blogging and participation in question–answer activities compared with the control group shows that gamification is an effective technique for increasing participation. There are some studies that have reached similar findings. According to Huang et al. (2019), the gamified-flipped learning promoted students to complete more in-class activities before the deadline than the nongamified group. Also, the gamification encouraged learners to produce higher quality artifacts (Hew et al., 2016). Therefore, students with low participation can be encouraged to do online activities with gamification techniques (da Rocha Seixas et al., 2016). At this point, it should be ignored that there is a strong relationship between fun and engagement (Bisson & Luckner, 1996; Prensky, 2002).
When we examined the levels of participation in the question–answer activity by students in the experimental group, we observed that their main purpose was not to learn new information, revise what they had learned, or help their classmates. Instead, they strongly experienced the feeling of competition due to gamification. Therefore, we could not predict whether there would be any difference in the achievement of the two groups. However, we observed that the experimental group participants’ superiority over the control group in the site interaction data and the level of participation in the learning activities brought success. When analyzing the pretest–posttest revealed that gamification had a positive effect on students’ achievement. There are similar findings showing that gamification has a positive effect on academic performance (Çakıroğlu et al., 2017).
Conclusion
The essence of gamification is the motivation (Tsay et al., 2018), defined as an inner motive that drives people and encourages them to move toward a goal (Hanus & Fox, 2015). Students with high motivation are expected to be more confident about participation in classroom activities and to better understand the content of the course. According to Sun et al. (2017), it is important to provide motivational support through the online environment to strengthen students’ commitment to out-of-class processes.
We had observed that, whereas the students who had the high motivation and autonomous learning skills were getting ready to face-to-face lesson, other students came to the classroom without watching the videos. Based on this problem, which is one of the common criticisms of flipped learning, we examined the effect of gamification. We can suggest that the online environment of flipped learning should be gamified. However, it should not be overlooked that changing education without good preparation could cause confusion and stress for students and teachers (Blau et al., 2016). It should be noted that students who are used to traditional teaching methods, low motivation, or lack of autonomous learning skills cannot show the expected performance in out-of-class learning processes.
However, our study had several limitations. First, we implemented this application at the higher education level. Therefore, we cannot predict whether such an approach would provide the same results in other levels of education. Future studies could comparisons between the different levels and disciplines by testing the same design framework at the K–12 level or in adult education. Another important limitation of this study is the ability to control the competitive environment, as in most gamification studies. It is recommended that researchers should make comprehensive planning prior to the research so that the competitive environment brought by gamification does not reduce the quality of the process.
Footnotes
Author Contributions
A.Y.G. and B.A. detailed the concept of the study and developed the conceptual framework. A.Y.G. designed the online environment, gamification elements, and in-class activities with the help of B.A. All authors wrote, read, and approved the final article.
Availability of data and material
Data sets on request will be provided by the corresponding author.
Declaration of Conflicting Interests
The author(s) received no financial support for the research, authorship, and/or publication of this article.
Funding
The author(s) received no financial support for the research and/or authorship of this article.