
Abstract
Previous studies have shown that cryptocurrencies could hedge equities. However, most of those studies did not take into account the recent cryptocurrencies bubbles in 2018 and domestic currencies. Therefore, this research aimed to study whether the hedge effectiveness of cryptocurrencies still exists. This research used five cryptocurrencies (bitcoin, ethereum, monero, ripple, and litecoin), equity indices (Indonesia, Malaysia, Vietnam, Thailand, and the Philippines), and iShares ETF MSCI World (developed world). Commodities-based hedging using iShares S&P GSCI Commodity-Indexed Trust was also analyzed as a comparison. The asymmetric generalized dynamic conditional correlation (AG-DCC) GARCH showed that one cryptocurrency could not significantly and consistently hedge equities while five equally weighted cryptocurrencies could marginally hedge equities. Meanwhile, the classical minimum variance model also showed that the hedge effectiveness of cryptocurrencies was insignificantly positive. Equity traders could add cryptocurrencies into portfolios when the purpose was to maximize the Sharpe ratio instead of hedging. Overall, commodities were the better hedge for Southeast Asia emerging markets.
Introduction
Since the work of Markowitz (1952), many researchers have focused on the advantages of diversification and many studies have analyzed the optimal combination of assets that could maximize returns and also minimize volatility. The popularity of cryptocurrencies has begun to attract investors who wish to add cryptocurrencies into their portfolio. Few studies have analyzed the correlation between cryptocurrencies and other assets (Corbet et al., 2018). Also, few types of research have concentrated on hedging and diversification capabilities (Baur et al., 2018; Bouri, Molnárb, et al., 2017; Brière et al., 2015; Dyhrberg, 2016a; Kajtazi & Moro, 2019; Robiyanto et al., 2019; Shahzad et al., 2019; Urquhart & Zhang, 2019).
Few studies have analyzed whether bitcoin has similar financial properties with gold (Dyhrberg, 2016a; Klein et al., 2018). Moreover, few academics have examined cryptocurrencies’ volatility (Charfeddine & Maouchi, 2019) and their connection with global instability (Bouri, Gupta, et al., 2017; Demir et al., 2018; Fang et al., 2019). Besides, the proficiency of Bitcoin to minimize market risk has been published, regardless of the speculative nature (Bouri et al., 2019). However, most of those studies did not incorporate the cryptocurrency bubbles in 2018 and domestic currency.
In this research, there are at least six different geographical portfolios that lead to cryptocurrencies’ effects on risk-adjusted returns and hedging abilities. Therefore, there are three major purposes of this research: to analyze whether cryptocurrencies can increase the equity portfolio’s performance, to explore those effects on the domestic currency, and to compare cryptocurrency-hedged portfolios with commodity-hedged portfolios.
This research fits in the category of cryptocurrency–equity relationship (Bouri et al., 2019; Corbet et al., 2018; Kajtazi & Moro, 2019; Shahzad et al., 2019). Nevertheless, this study broadens previous studies in three areas. First, this research used five cryptocurrencies and commodities as a comparison. Second, this research explored the time variability in diversification analyses of cryptocurrencies against major Southeast Asia emerging markets and developed markets as a comparison. Third, the performance analyses were based on domestic currencies of Indonesia, Malaysia, Vietnam, the Philippines, Thailand, and developed markets.
The remainder of this research is organized as follows. Section “Portfolio of Different Asset Classes” gives the description of the portfolio of different asset classes. Section “Method” describes the methodology used in this research. Section “Empirical Results” explores the results. Section “Managerial Implications” is the managerial implications. Finally, section “Conclusion” concludes the paper.
Portfolio of Different Asset Classes
Generally, there are three types of financial classes: shares, fixed income, and cash (Baur & Lucey, 2010; Robiyanto, 2018). Shares have the ownership element and dividend payment that can change over time, while bonds are debt elements with an interest payment. Moreover, Corbet et al. (2018) imply that Bitcoin and Ethereum are homogeneous (digital) asset classes. Bitcoin and Ethereum are peer-to-peer electronic cash systems that allow trading to be conducted without using financial intermediaries. Hence, unlike other financial asset classes, they have no physical forms and they are divisible. The value of Bitcoin and Ethereum is based on algorithm security.
Previous studies have shown that different asset classes, such as gold and fixed income assets, might enhance or minimize portfolio performance and risk (Robiyanto et al., 2019; Shakil et al., 2018). Fixed income securities can be used to hedge portfolios or financial assets. Furthermore, they suggested that firm bonds could be used as a safe-haven instrument in Indonesia. Moreover, cryptocurrencies can provide diversification advantages (Bouri et al., 2019; Brière et al., 2015).
Brière et al. (2015) suggested that including Bitcoin in a portfolio can provide significant diversification benefits. Furthermore, they showed that a small percentage of Bitcoin may greatly increase the risk-adjusted return of a portfolio. Meanwhile, Corbet et al. (2018) investigated the movement between cryptocurrencies and other assets and found that cryptocurrencies are fairly different from other economic assets.
Moreover, Baur et al. (2018) concluded that Bitcoin is not correlated with a non-digital asset in the crisis period. They also argued that Bitcoin is a speculative asset. However, Dyhrberg (2016a), who used GARCH (generalized autoregressive conditional heteroskedasticity), methodologies concluded that Bitcoin has some similarities to gold implying that Bitcoin has hedging capabilities. Also, Baur et al. (2018), who extended the research of Dyhrberg (2016a), showed that Bitcoin has very different returns, volatilities, and correlation characteristics than gold.
Furthermore, Bitcoin is a hedge for equities (Dyhrberg, 2016b). Bitcoin is regarded to have some of the same hedging abilities as gold and may be utilized to hedge market risk. Meanwhile, Bitcoin can be regarded as a poor hedge for other non-digital assets such as gold and currencies (Shahzad et al., 2019). Furthermore, Bitcoin can be utilized as a shield against uncertainty such as implied volatilities (Bouri, Gupta, et al., 2017). Similarly, Demir et al. (2018) showed that uncertainty in economic policy can be hedged by using Bitcoin.
Method
The Datasets
This research utilized five cryptocurrencies (bitcoin, ethereum, litecoin, monero, and ripple), obtained from https://coinmarketcap.com/ followed Bouri et al. (2019). The daily prices of equity indices (Indonesia, Malaysia, Vietnam, Thailand, and the Philippines) were obtained from Bloomberg. The equities indices were LQ45 (Indonesia), FTSE Malaysia (Malaysia), VN (Vietnam), SET (Thailand), and PSEI (the Philippines). The Singapore market was excluded since Singapore is not considered as an emerging market in Southeast Asia. Furthermore, this research also used the return of iShare ETF MSCI World, as the representative of the developed world (Chunhachinda et al., 2018). Commodity-based hedging using iShares S&P GSCI Commodity-Indexed Trust was also analyzed as a comparison (Chunhachinda et al., 2018). Based on the data availability of the cryptocurrencies, the sample starts from August 8, 2015, to July 2, 2019, consisting of 1,425 observations. Moreover, the sample included weekends since trading in cryptocurrency is not constricted to business days. Following Baur et al. (2018), since equities are not traded on weekends, this research assumed zero returns for weekends and holidays to align with cryptocurrencies.
Since the cryptocurrencies and commodities were in U.S. dollars while the equities were in domestic currencies, this study converted the return of cryptocurrencies to the domestic currencies (Indonesia, Malaysia, Vietnam, Thailand, and the Philippines). Moreover, the returns of the assets were calculated with the following formula: ln (Pt/Pt–1).
Asymmetric generalized dynamic conditional correlation GARCH
This study used asymmetric generalized dynamic conditional correlation (AG-DCC) GARCH of Cappiello et al. (2006), which is an enhanced version of Engle (2002). This process measures the co-movement of financial markets with the dynamic covariance matrix. Hence, the method can obtain time-varying correlations across different asset returns. Bollerslev (1990) suggested that the covariance matrix at time t is:

where Dt is a diagonal matrix of time-varying GARCH volatilities and C is a correlation matrix. Engle (2002) modified C into time-varying but not stochastic. Cappiello et al. (2006) enhanced the DCC model to have an asymmetric correlation. The conditional correlation matrix is given by:

where diag(Qt) is the diagonal matrix that is created from diagonal elements of Qt, and Qt is a positive definite matrix that follows the process:

where
In a multivariate GARCH model, the variables of the conditional variance and conditional covariance should be calculated simultaneously by maximizing the following log likelihood:

where Ht is the conditional covariance matrix and
Furthermore, the following formula is used to measure hedge ratio showing the amount, whereby a long (buy) position of equity should be accompanied by a short or long position of

Also, the conditional volatilities can be utilized to compute the portfolio weights that consist of equities and other assets with the following formula (Kroner & Ng, 1998):


where
Also, hedging effectiveness (HE) was computed by the following formula (Chang et al., 2011):

where
Sensitivity Test (Mean-Variance Process)
This research used the classical mean-variance framework to calculate the minimum variance portfolio that consists of equities and other assets. Following the following is the optimization procedure:

Subject to:


where
Empirical Results
Table 1 shows the descriptive statistics. All returns were in domestic currencies. The average Bitcoin returns in Indonesia, Malaysia, Vietnam, the Philippines, and Thailand were around 0.26% daily. Meanwhile, the mean of Ethereum returns was around 0.42% daily. This result shows that Ethereum had higher average daily returns than Bitcoin. Also, Ethereum had a higher risk compared with Bitcoin. This finding is similar to Bouri et al. (2019). From equities markets, it shows that Vietnam had the highest average daily returns compared with other emerging markets in Southeast Asia. The Malaysian capital market had the lowest risk compared with other markets and this result is in line with Muharam et al. (2019). Table 1 also shows that the differences between domestic returns and original returns of cryptocurrencies based on their original prices (US$) were not significant. For instance, the mean return bitcoin in Indonesian converted-price was 0.2595 while the mean return bitcoin in the original price was 0.2564. Similar differences prevailed in other nations indicating that the exchange rate was not a major issue in this research. Ripple was the riskiest cryptocurrency in this research, while commodities were riskier than equity indices although commodities had lower mean returns than the equities during the study period.
Descriptive Statistics.
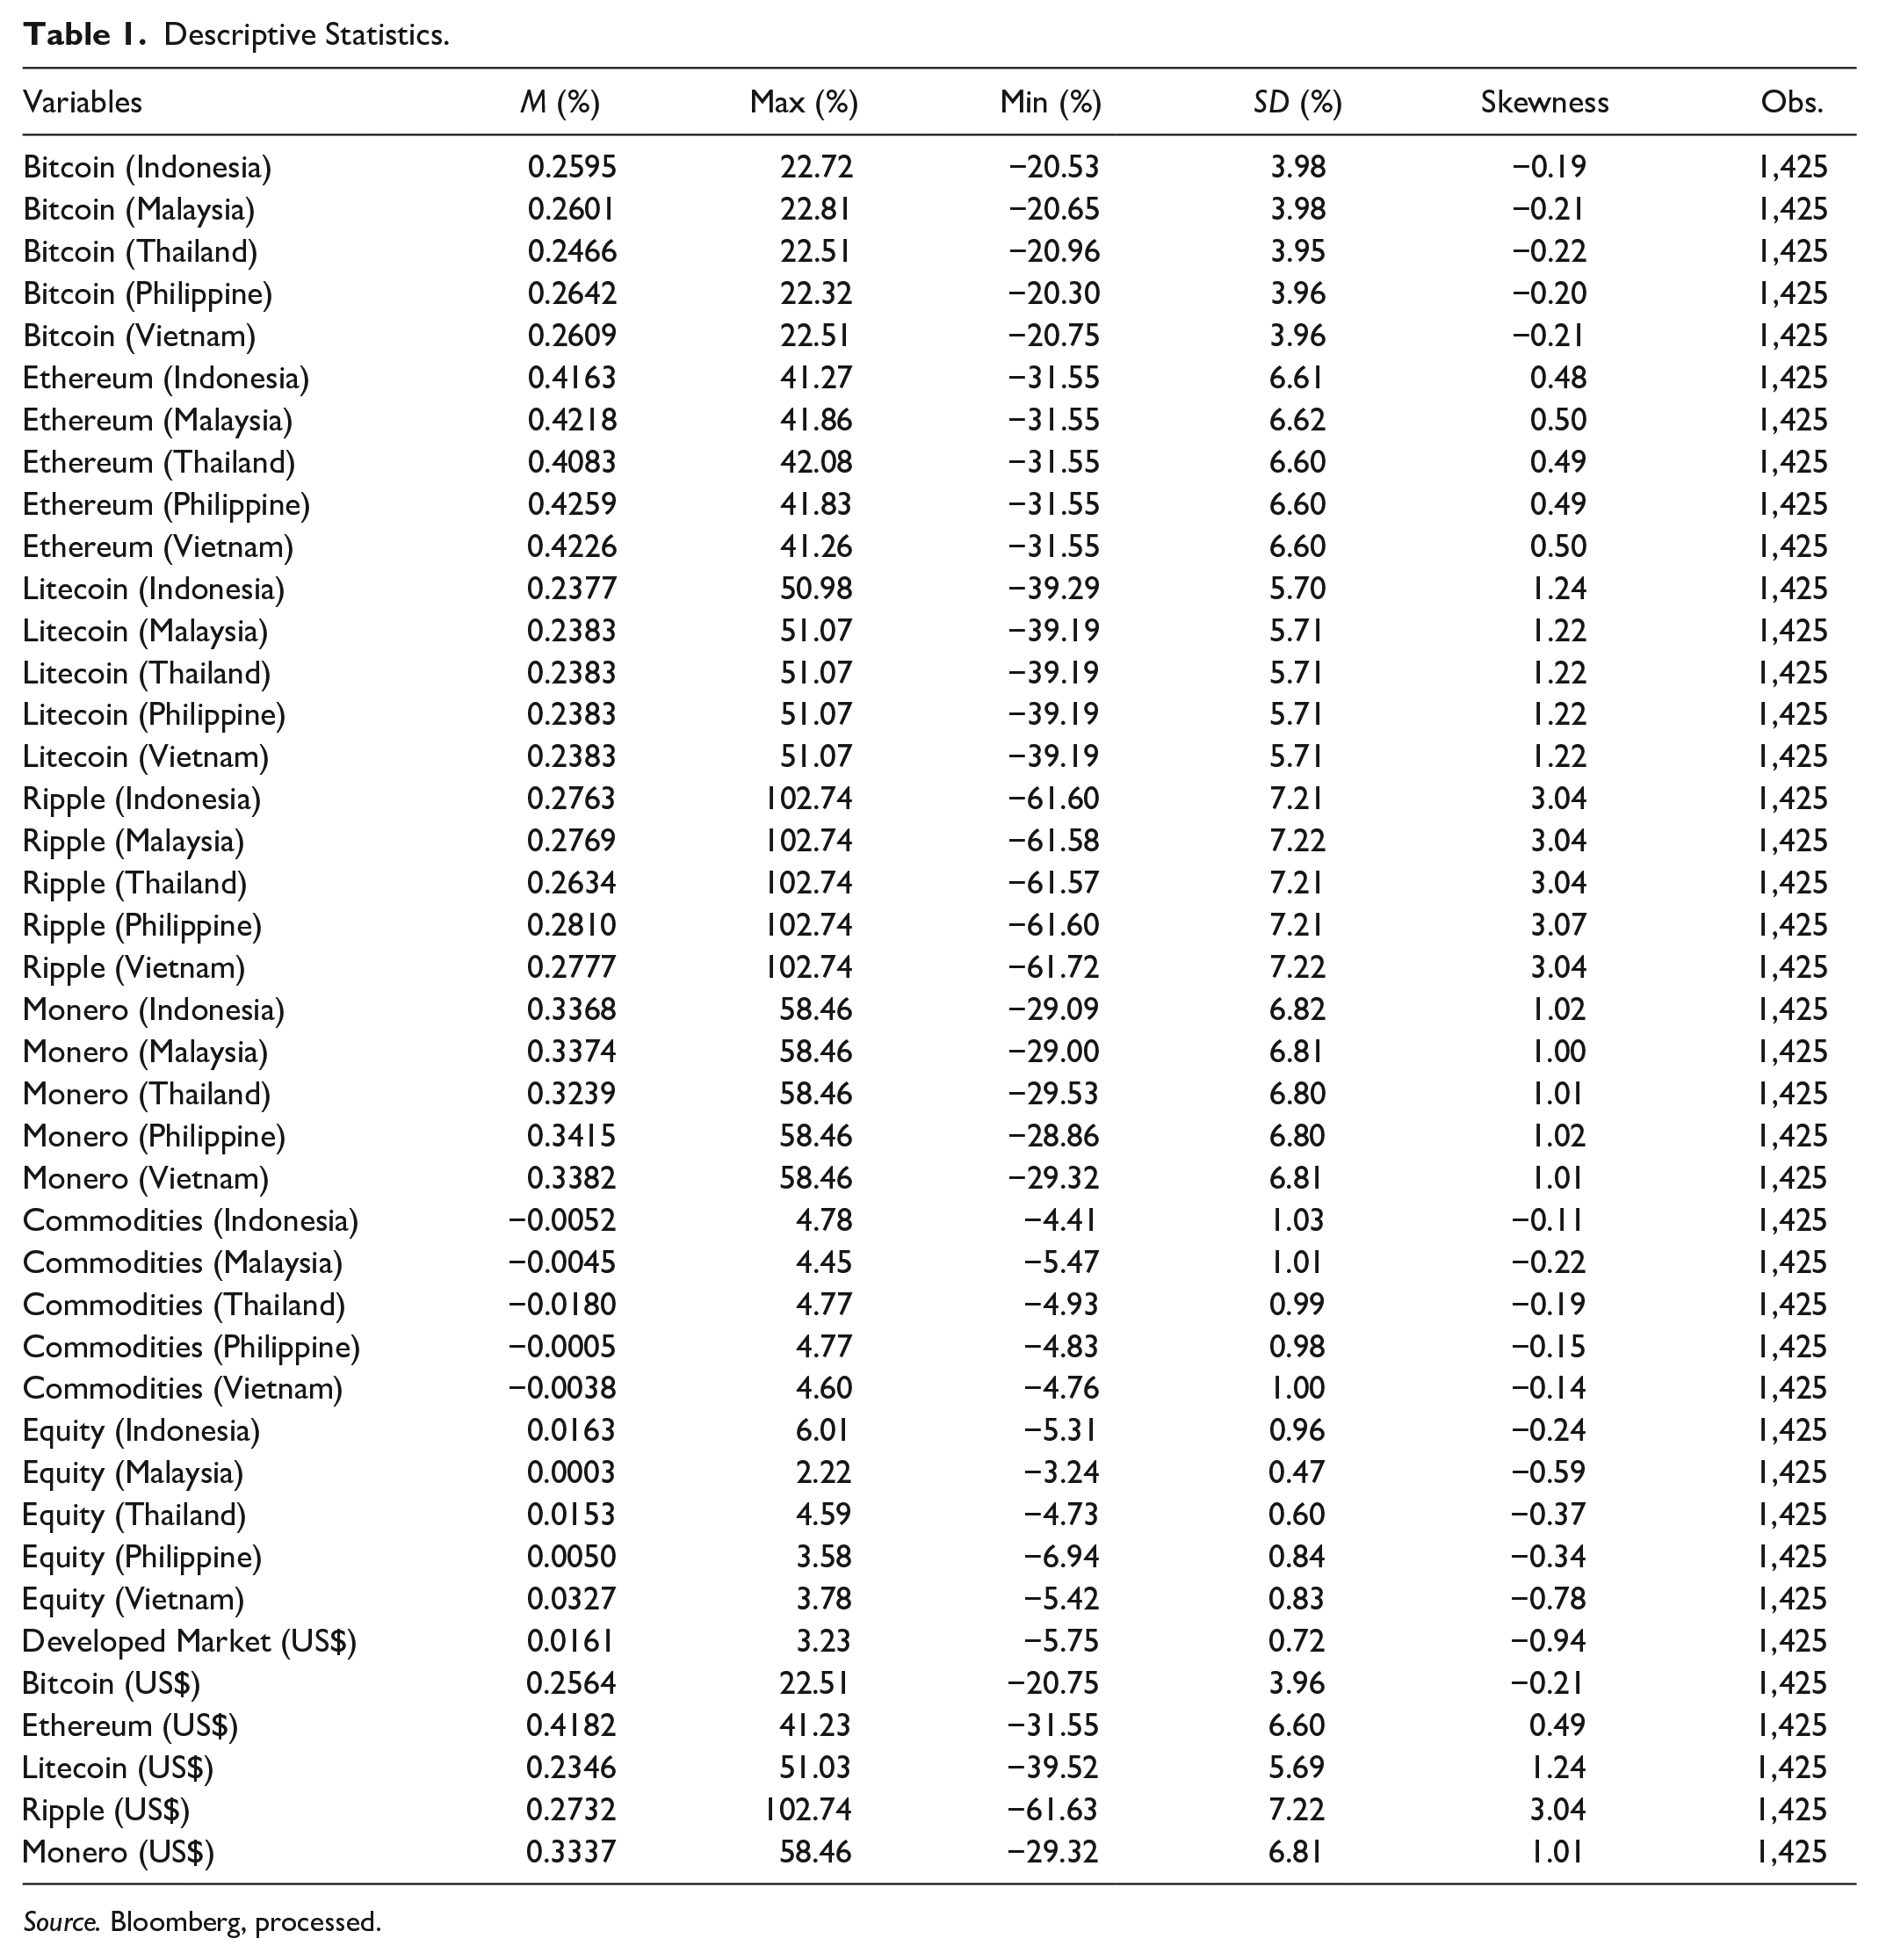
Source. Bloomberg, processed.
Table 2 shows the unconditional correlation. The Indonesian equity had the lowest and positive correlation with ethereum, while Malaysian equity had the lowest and negative correlation with bitcoin. Meanwhile, Thailand’s equity had the lowest and positive correlation with litecoin, while Philippine equity had the lowest and negative correlation with bitcoin. Also, Vietnam equity had the lowest and positive correlation with litecoin. Furthermore, Indonesia equity had the highest and positive correlation with ripple, while Malaysia equity also had the highest and positive correlation with ripple. Meanwhile, Thailand’s equity had the lowest and positive correlation with monero, while Philippine equity had the highest and positive correlation with ripple. In addition, Vietnam equity had the highest and positive correlation with ethereum. The maximum values of correlation between equities and cryptocurrencies were always below 0.10 which were very low.
Unconditional Correlation.

Source. Bloomberg, processed.
Furthermore, bitcoin, ethereum, and ripple had the highest and positive correlation with litecoin. Also, commodities had a very low correlation with cryptocurrencies. The ETF-based equity from developed nations also had a very low correlation with cryptocurrencies. Moreover, the low correlation between cryptocurrencies, commodities, and equities may provide limited hedging benefits. Nevertheless, the unconditional correlation cannot be efficiently used since there are dynamic volatilities and covariances of the returns. Therefore, the AG-DCC GARCH was utilized.
Table 3 shows the AG-DCC GARCH parameters. The α values in equities and commodities were relatively low indicating that the equities were not sensitive to market events. Except for litecoin, the α values in cryptocurrencies were quite large indicating that the cryptocurrencies were sensitive to market events. Interestingly, the five equally weighted cryptocurrencies had lower α compared with any single cryptocurrency except litecoin implying that the diversification benefits existed when combining five cryptocurrencies into a portfolio. Moreover, β values in the equities were relatively large indicating that volatilities took a long time to die out following turmoil in the market. Furthermore, since the values were above 0.99, the α + β values of bitcoin and ethereum showed that the term forecasts from the model were relatively flat. Furthermore, ethereum had the highest long-term volatility compared with other cryptocurrencies meanwhile commodities had higher long-term volatility than the equities. It is worth noting that the five equally weighted cryptocurrencies had lower long-term volatility compared with any single cryptocurrency implying that combining five cryptocurrencies into a portfolio could reduce risk. As previously mentioned, in a multivariate GARCH model, the variables of the conditional variance and conditional covariance should be calculated simultaneously by maximizing the following log likelihood. The table also presents the maximum log likelihood values of each variable.
AG-DCC GARCH Parameters.

Source. Bloomberg, processed.
Figure 1 shows the time-varying optimal weights obtained from the AG-DCC GARCH model. To save space, the authors only present some of the optimal weights. The graphs from Figure 1 could be used to generalize other portfolio weights in this study. For instance, the average weights of bitcoin in the equity-cryptocurrency portfolio were less than 0.10%. Also, the average weight of five equally weighted cryptocurrencies in the equity-cryptocurrency portfolio was less than 0.10%. However, Figure 1 shows that having five equally weighted cryptocurrencies in the equity-cryptocurrency portfolio could reduce the rebalancing frequencies. Also, the average weight of commodities in the equity-commodities portfolio was above 0.3%. Furthermore, Figure 2 and Table 4 show the time-varying and summary of hedge ratios, respectively. When buying one domestic currency of equity in Indonesia, it should be accompanied by shorting (sell) 0.006 of bitcoin. So, buying one domestic currency of equity in Malaysia should be accompanied by buying (long) 0.008 of bitcoin. The average hedge ratio for Southeast Asia emerging markets was less than 0.10 indicating that it was a cheap hedge. Moreover, buying one dollar of equity in the developed market should be accompanied by buying (long) 0.003 cents of bitcoin. The average hedge ratio for developed markets was also less than 0.10 indicating that it was also a cheap hedge. Meanwhile, the value of hedge ratios in commodities hedging were bigger than the cryptocurrencies hedge. For example, the value of the hedge ratio for Indonesia/commodities portfolio was −0.025 indicating that buying one equity in Indonesia should be accompanied by buying 0.025 of commodities futures contract. The commodities hedge was more expensive than cryptocurrencies hedge for Southeast Asia emerging markets. Similar patterns could be found in the developed market/commodities portfolio. The cheap hedge of cryptocurrencies was consistent with Figure 3 which was the result of the time-varying correlation between cryptocurrencies and equities. Cryptocurrencies had a very low dynamic correlation with equities in Southeast Asia emerging markets and developed markets. Meanwhile, commodities had a higher dynamic correlation with equities than cryptocurrencies.
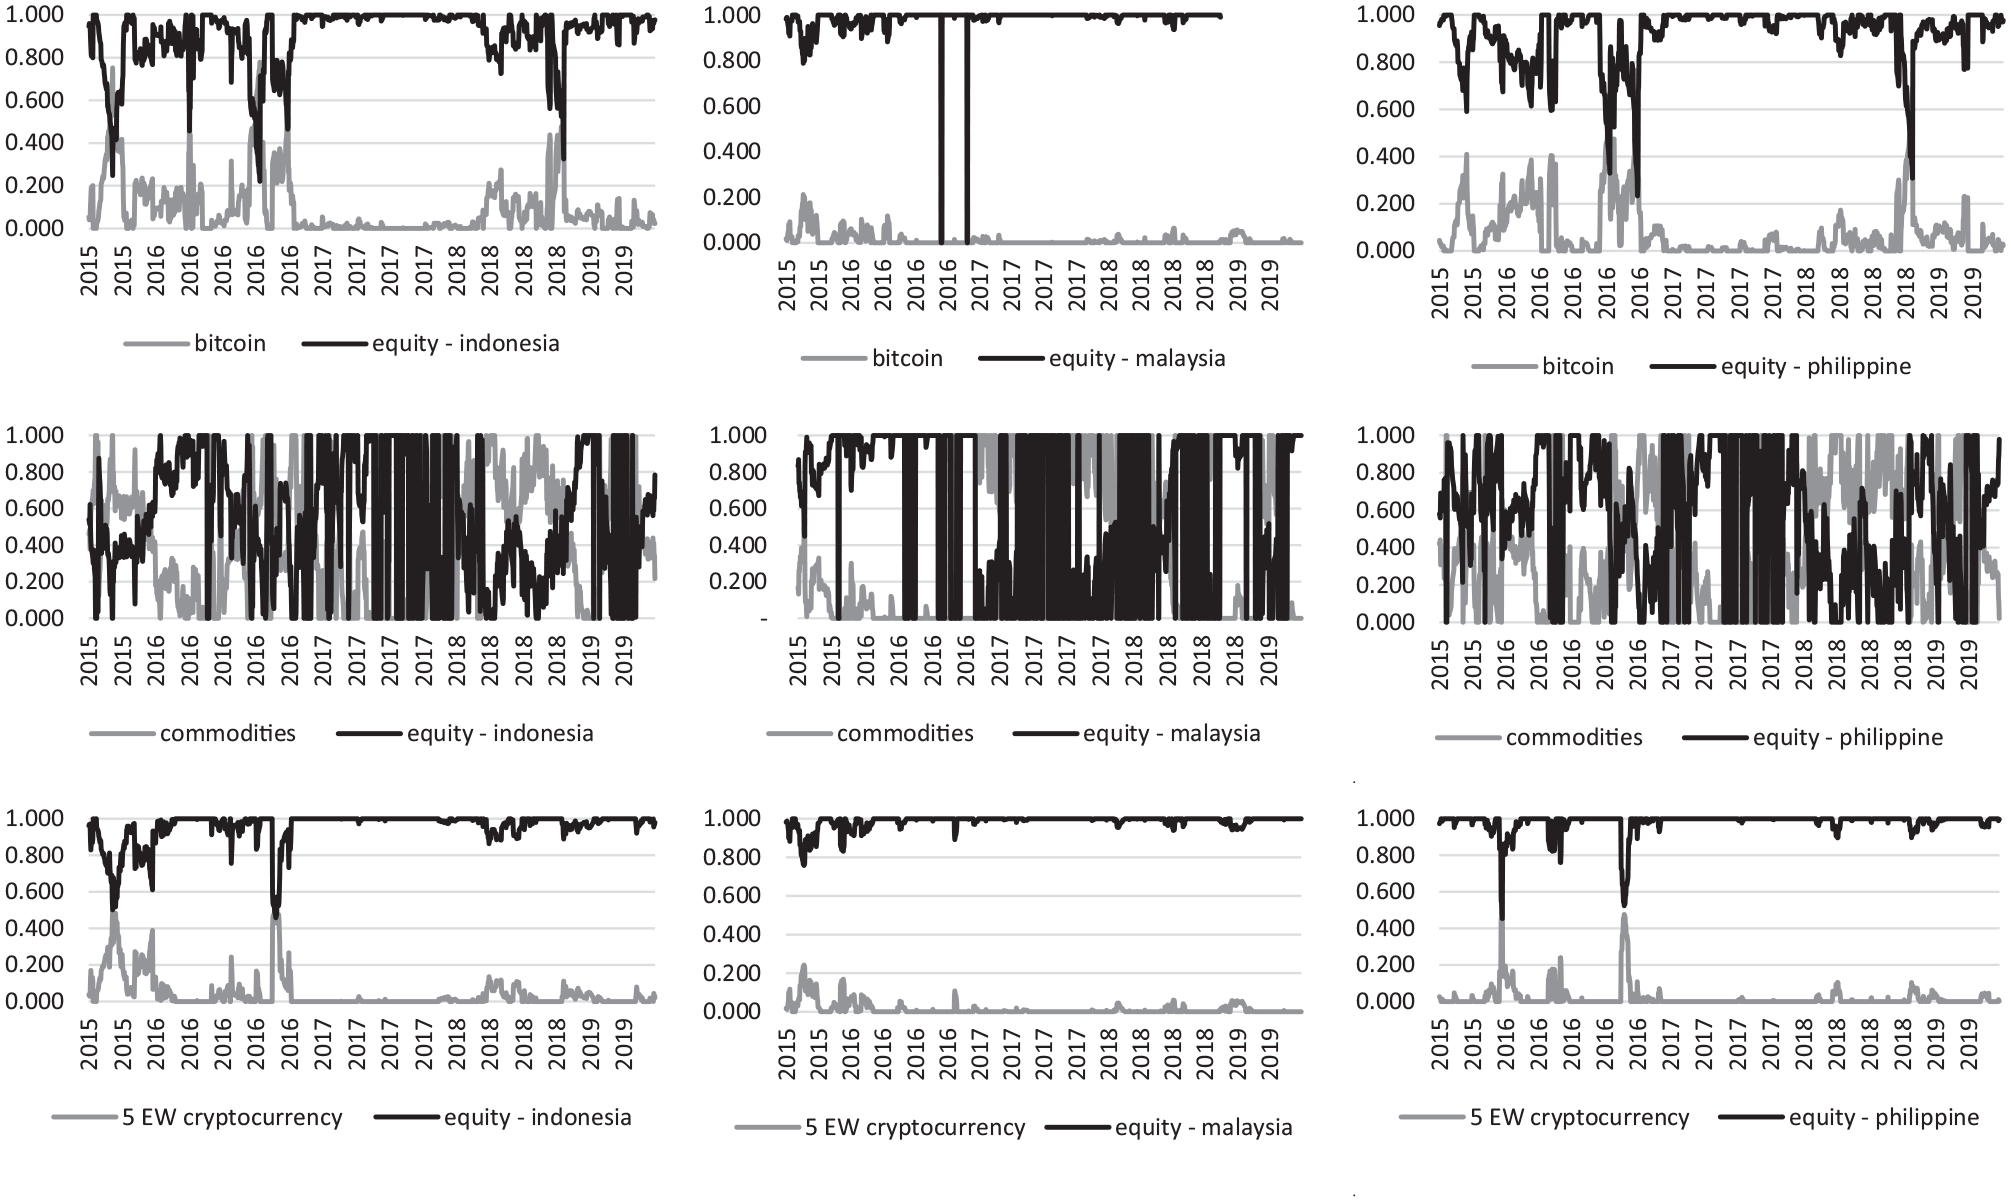
Time-varying of optimal weights.

Time-varying hedge ratio.
Hedged Portfolio Performances.

Source. Bloomberg, processed.
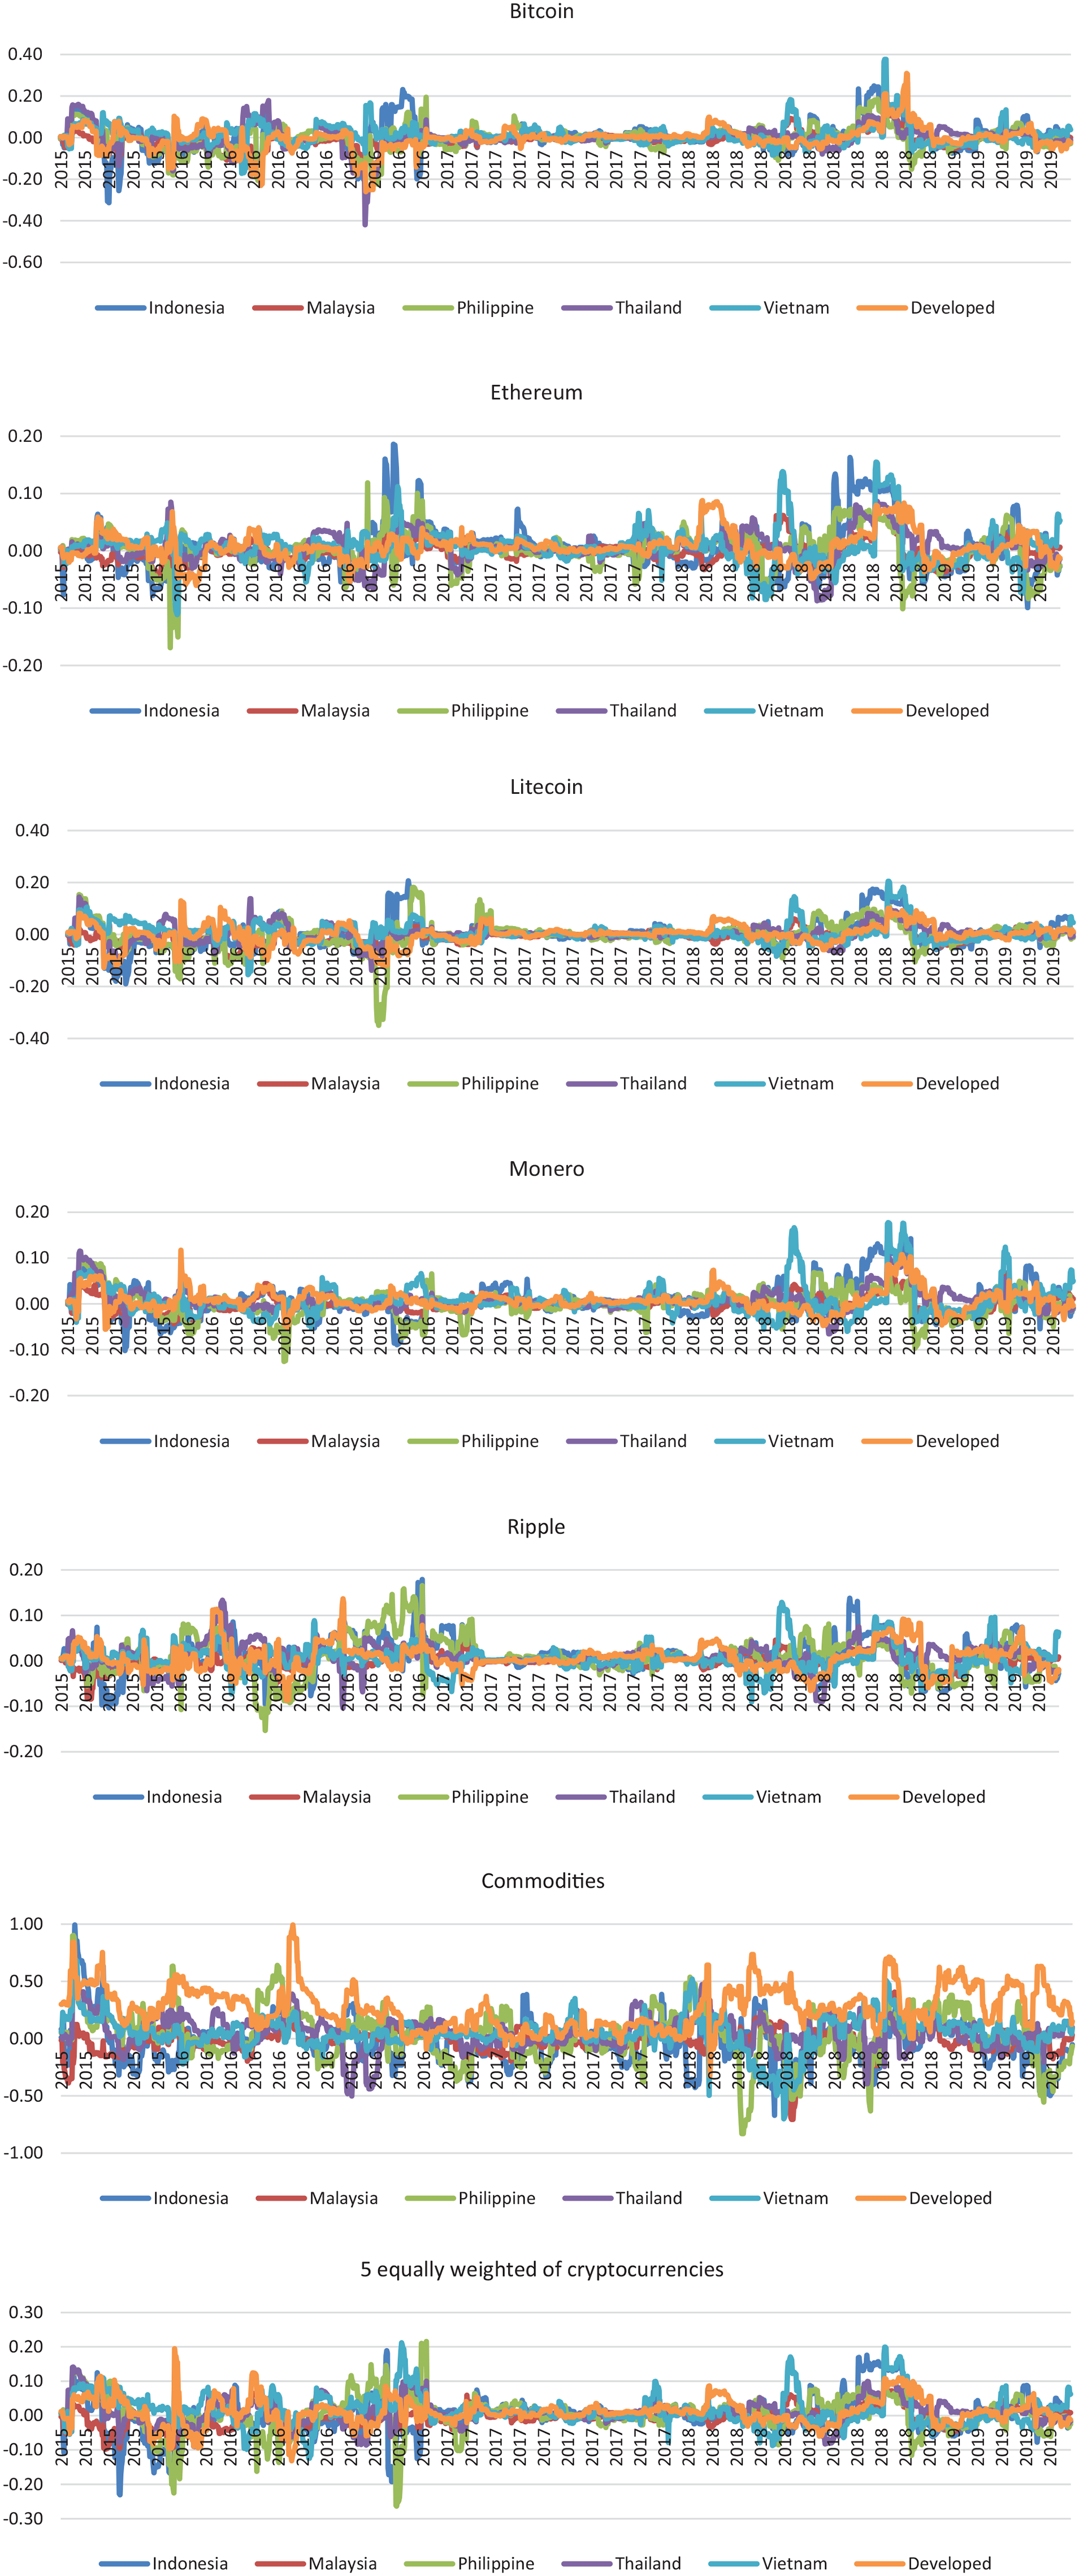
Time-varying correlation.
Table 4 shows the performance of the hedged portfolio. Over the sample period, the values of hedge effectiveness were higher in the equities/commodities combination than in equities/cryptocurrencies. Based on the GARCH method, cryptocurrencies could not consistently hedge equities since the values of hedge effectiveness were not always positive. Meanwhile, the values of hedge effectiveness were always positive in the minimum variance method. The reason for the difference was largely due to GARCH’s ability to capture time-varying volatility compared with the classical minimum variance portfolio. The hedge effectiveness values from the minimum variance model showed that cryptocurrencies were not good hedge since the values were significantly low which were also consistent with the GARCH method. More interestingly, five equally weighted cryptocurrencies had better performance for hedging the equities. The values of hedge effectiveness in the equities/five equally weighted cryptocurrencies portfolio were always positive. Also, commodities had better abilities to hedge equities than cryptocurrencies from GARCH and minimum variance perspectives. Table 4 also shows the Sharpe ratio calculation. The average Sharpe ratio from equities/cryptocurrencies portfolio was higher than commodities/cryptocurrencies portfolio implying that adding more cryptocurrencies in the portfolio could improve risk-adjusted returns in the expense of hedge effectiveness.
Managerial Implications
The overall results show that the optimum weights cryptocurrencies in the combined portfolio are recommended between 1% and 10%. This result is in line with Brière et al. (2015). For risk takers, adding more cryptocurrencies can lead to higher risk-adjusted returns. The results of this study also support the work of Dyhrberg (2016b). This research complements the results of previous studies. However, the findings from this study are also lined with Klein et al. (2018) who suggested that Bitcoin is a very weak hedge. Interestingly, the five equally weighted cryptocurrencies had lower GARCH error or α implying that the diversification benefits existed when combining five cryptocurrencies into a portfolio. Also, the values of hedge effectiveness in the equities/five equally weighted cryptocurrencies portfolio were always positive. Although commodities were the better hedge, they were more expensive too. Moreover, commodities that can be used to hedge equities are consistent with the findings of Chunhachinda et al. (2018).
This result gives a practical implication for investors and policymakers. The availability of cryptocurrencies as a low-cost hedge may attract some equity traders. However, cryptocurrencies are still far riskier than equities or commodities. Hence, investors should be cautious when using cryptocurrencies. Moreover, the dynamic ability in the diversification benefits of cryptocurrencies suggests that instability is quite similar to that shown in gold. This finding also implies that managers should not constrain their preferences to the top two cryptocurrencies which are bitcoin and ethereum but also other cryptocurrencies to gain better diversification benefits.
Conclusion
This study considered the perspective of domestic investors when combining cryptocurrencies or commodities with equities in a portfolio. This study also investigated the evolution of the conditional correlations between cryptocurrencies or commodities with equities and found very low fluctuations of correlations between cryptocurrencies and equities. Moreover, this study observed that the fluctuations of correlations between cryptocurrencies and equities were below commodities and equities.
The results of the AG-DCC GARCH model, the hedge ratios, and the hedge effectiveness show that only five equally weighted cryptocurrencies could consistently but marginally reduce portfolio risk. However, they did not reduce risk as much as when commodities and equities were combined. Also, the classical model of the minimum variance portfolio more or less supported the findings of AG-DCC GARCH.
The findings of this research can be useful for portfolio managers assessing diversification opportunities besides gold. From a hedge effectiveness perspective, an investment strategy focused on equities/commodities portfolio may lead to more risk reduction but when risk-adjusted portfolio returns are considered, equities/cryptocurrencies give a better investment performance.
The limitation of this study is that the authors did not make a sub-sample analysis regarding the cryptocurrency bubbles starting from the end of 2017 to 2018. For future studies, it is recommended to consider the non-linear relationship between cryptocurrencies and equities when examining hedge effectiveness.
Footnotes
Authors Contributions
All the authors have made an equal contribution to this study.
Availability of Data and Materials
The datasets used and/or analyzed during the current study are available from the corresponding author on reasonable request.
Declaration of Conflicting Interests
The author(s) declared no potential conflicts of interest with respect to the research, authorship, and/or publication of this article.
Funding
The author(s) received no financial support for the research, authorship, and/or publication of this article.