
Abstract
Hedge funds play an important role in investment markets, but high-profile frauds and market manipulation have necessitated increased scrutiny for the detection and prevention of such activities. Market metrics which signal fraudulent activity quickly, early, and reliably are scarce and sometimes provide fallacious results. The bias ratio in conjunction with other metrics could provide a solution as it compares the real asset return distribution to that of unbiased returns. High bias ratios combined with statistical moments which differ considerably from those expected from normal distributions provide compelling evidence for possible return manipulation. Application of these metrics to known fraud cases shows that—used historically and in tandem—they would have provided powerful early indicators of suspicious investment activity. Uncovering these frauds earlier could have potentially saved investors considerable resources. The bias ratio also shows promising results in detecting other possible market scams such as insider trading.
Introduction
Fraud damages financial and investment markets through deceptive, misleading, or other illegal practices (Chen, 2020), yet it is widespread. It is not confined to hedge funds, but the manner and magnitude of hedge fund fraud has placed this industry under intense scrutiny (Investment News, 2020). Most regulations governing hedge funds do not demand the same level of disclosure, transparency, and record keeping that is required for mutual funds (Bollen & Pool, 2008; Honigsberg, 2019) making uncovering fraud within the hedge fund industry difficult. There are many methods that could be used to commit fraud—ranging from returns smoothing to outright fabrication of returns (a fine line distinguishes the two).
Many hedge funds invest in securities that are illiquid and hard to price. As a result, the net asset value (NAV) of the hedge fund can be subjective (Abdulali, 2006). This subjectivity allows unscrupulous hedge fund managers to manipulate NAV to smooth returns, a process which involved mitigating both positive and negative return surprises. This reduces the fund volatility, improves the risk-adjusted performance (Bollen & Pool, 2008) and makes the relevant fund more attractive to investors (Le Marois & Douady, 2007).
It is, therefore, important to detect and mitigate fraud in the hedge fund industry. Undetected fraud often involves considerable losses for investors, yet it is difficult to detect in hedge funds (the number of global hedge funds renders auditing each fund impractical). A mathematical tool is required to detect fraud. Abdulali (2006) developed a bias ratio indicator which can be used to signal funds that may be committing fraud in some way (Le Marois & Douady, 2007).
The bias ratio uses fund returns as an input to the metric and compares them to unbiased returns around the critical area surrounding the 0% return and highlights any fund that may potentially be committing fraud (Abdulali, 2006). The bias ratio output is directly correlated to return smoothing: the more smoothed the returns the higher the bias ratio. Thus, the bias ratio of a fund with normally distributed returns will be close to 1. Examples of this would be an equity index which would have a bias ratio close to 1 (Le Marois & Douady, 2007). Funds which are valued through the market price (funds which contain liquid securities) will also as a result have a bias ratio close to 1. This is because it is difficult to smooth the returns of liquid securities. Illiquidity can result in hard-to-price securities (embraced by some hedge funds) having a high bias ratio without any fraud taking place.
Funds with bias ratios considerably >1 may not directly implicate fund managers nor indicate definitive fraudulent activity. However, the bias ratio does provide an early warning indicator so such funds should be investigated further, and additional metrics should be applied to augment suspicions.
The remainder of the article proceeds as follows: Section 2 provides a comprehensive literature review, Section 3 discusses the data and presents the mathematical basis for the analysis which follows. The application of the bias ratio to various indices (and known fraud cases) follows in Section 4 and Section 5 assesses the limitations of the current work and possible future directions that could arise from this study. Section 6 concludes.
Literature Review
Due to decreasing yields on financial instruments, combined with persistently low yields of fixed income instruments, and the volatility of the property markets, investors continue to seek alternative sources of yield outside traditional strategies (Caglayan et al., 2018). Hedge funds have been an increasingly popular form of alternative investments since the turn of the millennium. Hedge funds are a popular form of alternative investment.
The Securities and Exchange Commission (SEC) defines a hedge fund as any private fund that meets the following criteria (Dixon et al., 2012):
Pay its investment advisors a performance fee calculated by taking into account unrealized gains.
Borrow funds more than half its net-asset-value (NAV).
Have gross exposure more than twice its NAV.
Sell securities short or enter into similar transactions.
The illiquid and high-risk nature of hedge funds restricts the number and types of potential investors: these are commonly high net worth individuals or large institutions (Dixon et al., 2012). Individuals who invest in hedge funds are regarded as “mature” investors: this is the reason why hedge funds are not yet regulated as tightly as other investment options, but this is changing (Fichtner, 2013). The Financial Conduct Authority recognizes that low levels of good governance in the asset management sector is the factor that is most likely to cause harm (Abad-Segura & González-Zamar, 2020; Andor, 2019; Henderson & Ellison, 2020). Since 2013 protocol has been installed to regulate the alternative investment sector, limiting the extent of leverage hedge fund managers can take on, but the level of regulation that hedge funds face is still relatively low compared to other fund types (CFA Institute, 2020).
The total global assets under management (AuM) at the end of 2019 was $89.0 t (Heredia, 2020) with hedge funds contributing $3.1 t AuM to this figure (Rudden, 2020)—this amounts to roughly 3% of total global AuM. Although this is not a large proportion relative to other funds, hedge funds exert more influence over the market than their total market share because many hedge funds use dynamic and leveraged trading strategies as opposed to mutual funds which generally “buy and hold,” hedge funds trade more often than mutual funds (Minhas & Hussain, 2016; Mitra, 2009). Blundell-Wignall (2007) found that hedge funds accounted for between 25% and 60% of total trades on markets included in the study. More recently, the percentage share of institutional trading that hedge funds have contributed is just above 30%, just under 10% more than that of other fund managers. Quantitative funds now contribute most global trades at approximately 35% of total trades (The Economist, 2019).
There are several features of hedge funds that contribute to potential systemic risk within a system (Dixon et al., 2012). They are generally highly leveraged; this high leverage can lead to systemic instability within a system if a hedge fund were to collapse. A comprehensive review of these and related issues is provided by Reurink (2016).
There is evidence to suggest that hedge funds contributed to the Asian Financial Crisis by amplifying its negative effects (De Brouwer, 2001). Hedge funds also contributed to the global financial crisis (GFC) in 2008 (Fichtner, 2013). Following the “dot com” crash many hedge fund managers sought new, lucrative investment instruments, many hedge fund managers saw opportunity in the subprime derivative market (Lysandrou, 2011a). Immediately prior to the crisis hedge funds held 48% of the total stock of Collateral Debt Obligations while total hedge fund AuM amounted to just over 1% (Lysandrou, 2011b). Since hedge funds can take both highly leveraged and concentrated positions, a significant change in the market can have detrimental effects on the economy as demonstrated by the collapse of Long-Term Capital Management (LTCM) in 1998 (Lhabitant, 2014).
Although fraud is prevalent in all facets of the finance and investment industry, the hedge fund industry is infamous for fraud that has occurred (Baucus & Mitteness, 2016; Phillips, 2004). Many cases of hedge fund indiscretions, including those observed in the Madoff Ponzi scheme were because of fund managers having the ability to both misreport fund values as well to completely fabricate returns (Bollen & Pool, 2012; Chariri et al., 2018). This ability possessed by hedge fund managers is due to the environment in which hedge funds operate where there is little regulation. Duan and Gaurav (2021) provide an intriguing review of the application of artificial intelligence and machine learning to the problem of fraud detection using return manipulation.
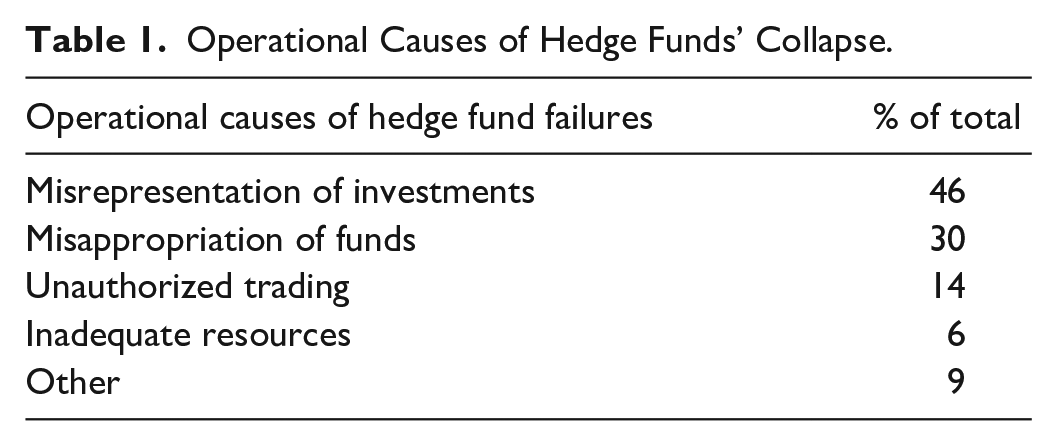
Table 1 highlights how important it is to have stringent measures in place for hedge funds. More than 75% of hedge funds that collapse, do so because of some variation of fraud.
Operational Causes of Hedge Funds’ Collapse.
Agarwal et al. (2011) state that investors direct more capital to funds that feature a higher number of months with positive returns. Thus, because compensation fund managers receive is a function of total AuM, there is motive for fund managers to inflate returns to attract this capital (Bollen & Pool, 2009). Fairfield Sentry returns (a Madoff feeder fund) recorded only 10 months of negative returns in the 215-month history of the fund (Gregoriou & Lhabitant, 2009). Bollen and Pool (2012) show using reasonable assumptions about the return distribution that the probability of recording only 10 months of negative returns out of 215 is improbably low. This highlights how indiscretions by hedge fund managers can be uncovered through statistical means, thus greater regulation is required to allow authorities to conduct these statistical analyses on hedge fund returns.
However, the bias ratio provides an indication of funds that should have further investigation. If the bias ratio had been used in the Madoff securities incident, it would have flagged that return manipulation was taking place and that further investigation was required. Inputting the Madoff Security Returns over the period of existence into the bias ratio calculator, produces an output of 13.5.
Cox and Thomas (2003) studied the factors that resulted in action by the Securities and Exchange Commission (SEC) in the USA. Cox and Thomas (2003) concluded that there was little proactive investigation into fraudulent behavior, suggesting that most investigating and enforcement the SEC did was because of complaints from investors or negative press coverage. The lack of proactive enforcement by the SEC is partially because of the lack of regulations that are present within the hedge fund industry. If regulation were increased and hedge funds were required to disclose financial records, relevant authorities would be more easily able to detect fraud (Bollen & Pool, 2012).
The prevalence of misreporting in the hedge fund industry was first hypothesized by Bollen and Pool (2008) who studied discontinuities in pooled monthly returns and found:
Sharp discontinuities recorded at 0%.
The number of small gains was greater than expected while the number of small losses was lower than expected.
Although hedge fund fraud is no more prevalent than any other kind of corporate fraud, it is the scale, manner, and macro effects that have brought the industry under scrutiny (Phillips, 2004). There is a need for a simple mechanism that will allow for the early detection of fraudulent behavior.
The bias ratio—introduced by Abdulali (2006)—is an indicator that can be used to detect possible fraud. The bias ratio approximates the ratio between the area under the return histogram from 0 to +1σ and −1σ to 0 where
The purpose of this research is to extend and augment available research. The bias ratio can help filter suspicious funds that may possibly be manipulating returns and ultimately the NAV, furthermore the bias ratio can be used to identity illiquid assets where they should not be present (van Dyk et al., 2014). By supplementing results obtained from the bias ratio with other statistical measures, early, reliable detection of fraud may be possible, thereby alleviating much of the losses incurred by illegal activities including return manipulation and insider trading.
Data and Methodology
Data
Most data used in this analysis were obtained from the Edhec-Risk Institute (2020). Due to the lack of regulatory oversight, hedge funds are not required to provide their specific strategies and return information—indeed, for many this is proprietary information and closely guarded information. As a result, it is difficult to obtain information regarding individual hedge funds. Consequently, this work analyses hedge funds per strategy—that is, using indices—as these data are more readily available. Monthly returns are used to determine bias ratios for each fund strategy. This is mostly because hedge fund return data are only reported monthly—more frequent data are not available.
The data are representative of global hedge fund performance—the Edhec-Risk Institute data span all jurisdictions. As of June 2020, just under 87% of hedge funds were based in either the US or UK (Aurum, 2020). The data span some 15 years, from Apr-05 to Apr-20. This period embraces both severe market turbulence (e.g., the GFC in 2008/2009 as well as the sovereign crisis that occurred within some European countries in 2011/2012) and relative calm (e.g., the distinctly non-turbulent global market from 2005 to 2007). Time series analysis—using a rolling window of 200 monthly returns—allows hedge fund bias ratios to be analyzed, measured, and compared over these different periods and consequently produces interesting results pre, during, and post these respective milieus.
The data used in this analysis are biased toward surviving funds. The returns of funds which have collapsed, or those exposed for indulging in fraudulent activity have been excluded from the relevant indices. This survivor-bias may therefore understate the level of industry-wide fraudulent behavior
Hedge Fund Strategies
Hedge funds are defined by the strategy undertaken by the fund manager. The strategies listed below are used in this analysis (Cressman, 2003; Mitra, 2009; O’Hara, 2020).
Convertible Arbitrage
CTA Global
Distressed Securities
Emerging Markets
Equity Market Neutral
Event Driven
Fixed Income Arbitrage
Global Macro
Long Short Equity
Merger Arbitrage
Relative Value
Short selling and long-only, and
Fund of Funds.
Methodology
The bias ratio takes the following mathematical form:

where:
The bias ratio (BR) is mathematically represented in a continuous form:

The function obeys the following principles:

If
If
If the return distribution is normal, with
The numerator of (1) is the area from (0, +1σ). This is a measure of the concentration of returns from 0 to one standard deviation away from 0. The denominator of (1) is the area under the return histogram from −1 standard deviation away from 0 to 0. Like the numerator, the denominator is a measure of the concentration of returns that fall within this range.
An unbiased distribution would be perfectly normally distributed and thus have a bias ratio of 1 (Abdulali, 2006). The bias ratio measures the distributions degree of symmetry, that is, a measure of the degree to which the returns differ from an unbiased distribution.
The return distribution is normally distributed, but there are fat tails present representing extreme negative and extreme positive returns, exceeding those predicted by normality. There is also evidence that the central area of the distribution is thinner than the normal distribution, indicating leptokurtotically distributed returns. Two regimes are also present in return distributions: periods of turbulence represented by fat tails and periods of market calm which reflects most returns in the center of the distribution. Assuming normality, then, increases the probability that the model will not accurately represent extreme market events.
The attraction of using the bias ratio as a measure is the simplicity of its inputs. The only inputs required are hedge fund returns. Other metrics are used to provide a better understanding of the results: analyzing only the bias ratio without these other metrics may provide biased results. These measures are returns, standard deviation, skewness, and kurtosis—the first four distributional moments.
Results and Discussion
Table 2 collates and displays the summary statistics for the various hedge fund strategies.
Summary Results of Different Strategies.

Figure 1 presents the relationship between the bias ratio and maximum returns for the different strategies. An R2 = .54 suggests that there is a correlation between the variables. These variables are inversely related. Figure 1 indicates that funds portraying a high bias ratio tend to report lower returns, and thus have a lower maximum return as a characteristic.

Bias ratio versus maximum return Dashed line indicates a bias ratio of 1.
Because a higher bias ratio is an indicator of fabricated returns, it is a plausible suggestion that if fraud is occurring, serial correlation is present at positive returns closer to zero. This result aligns with the literature. There are various reasons why this result could occur, the most obvious reason lies in the fact that reporting high returns attracts attention. When these returns are fabricated, the attention is obviously unwanted. Thus, it is likely that fund managers will report small incremental positive gains, resulting in a relatively low maximum return and consequently a high bias ratio. This is affirmed by the well-known case study, Madoff Investment Securities in 2008. Throughout the period when it was known that Madoff Securities was fabricating returns, the returns ranged from −0.55% to 3.36% generating a bias ratio of 8.09.
Figure 2 shows the relationship between the bias ratio and standard deviation of the respective strategies. An R2 = .56 shows that there is a correlation between the two variables, again an inversely proportional relationship. This result is expected and aligns with the literature. It is plausible—using (1)—that returns with a high standard deviation imply a lower bias ratio. A higher standard deviation means that the data are less concentrated around the mean, and thus serial correlation is unlikely. Furthermore, a higher standard deviation implies that there will be fewer data in both areas [−1σ: 0] and [0: +1σ], thus a high standard deviation results in a low bias ratio.

Bias ratio versus standard Dashed line indicates a bias ratio of 1.
Figure 3 shows the relationship between the bias ratio and the skewness of the data for each respective strategy. An R2 = .82 suggests a strong linear relationship (and the negative regression coefficient demonstrates this relationship is negative shown in Figure 3). The results around zero skewness align common understand of the bias ratio and its characteristics. These fund returns are close to normally distributed, and fund returns that are normally distributed will have a bias ratio

Bias ratio Dashed line indicates a bias ratio of 1.
A high skewness can thus be attributed to a high bias ratio. The bias ratio is not ultimate proof of fraud. This relationship (Figure 3) demonstrates how a fund can exhibit a high bias ratio due to good performance. A fund will portray negative skewness when more positive returns are being reported relative to negative returns which can occur through continued good performance. Thus, discretion must be employed when using the bias ratio as a metric to detect—and assert—fraud.
There is a clear relationship between the bias ratio and kurtosis of the return distribution (Figure 4). The R2 = .76 indicates a strong positive relationship: these results are expected. Considering the likely behavior of fund managers who falsify returns, it is most likely that serial correlation will occur and there will be a high density of returns

Bias ratio versus Dashed line indicates a bias ratio of 1.
Table 3 presents the bias ratio calculated using standard deviation versus EWMA. Differences are expected as standard deviation does not consider the timing of information whereas EWMA does. Most strategies show a relatively small difference; however Fixed Income Arbitrage shows a large decrease when using EWMA with a bias ratio of 4.02 under the standard deviation method, and 2.38 under the EWMA approach. No preferred volatility measure is specified in the implementation of the bias ratio, but the differences under different approaches can be large (Table 3) and should be accounted for.
Bias ratio Using Different Measures of Volatility.

The Bias ratios of both Fixed Income Arbitrage and Equity Market Neutral are high. The summary statistics in Table 2 indicate that both Fixed Income Arbitrage and Equity Market Neutral are characterized by higher-than-normal skewness and kurtosis. Fixed Income Arbitrage and Equity Market Neutral have a skewness of −4.01 and −2.05 and
Fraud is unlikely to be occurring in funds that have a Bias ratio
The exponentially weighted moving average (EWMA) volatility was also calculated and used instead of standard deviation as the volatility metric. Figure 5 shows the bias ratio plotted against the standard deviation and the EWMA for comparison.
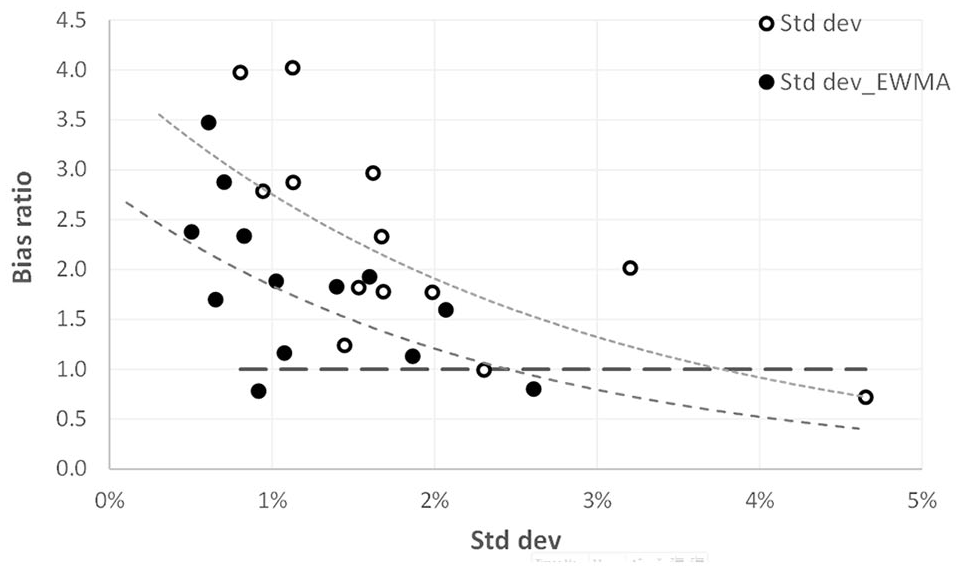
Bias ratio versus standard deviation and EWMA. The dashed line reflects a bias ratio of 1.
Figure 6 highlights the effect using different metrics to calculate the Bias ratio can affect the output. The period in the lead up to the GFC in 2008 is of particular interest, as this is the period with the largest disparity.

Equity market neutral bias ratio over time. The dashed line reflects a bias ratio of 1.
Because EWMA weighs the most recent information the highest, it is plausible that Equity Market Neutral had a lower volatility in this period compared to the volatility shown by standard deviation. This lower volatility may be the result of Equity Market Neutral funds using hedging to become market neutral and thus minimize market risk. Therefore, considering the relationship highlighted in both Figures 3 and 6, this decrease in volatility would most likely result in a higher bias ratio. Hedge fund AuM decreased substantially ibn 2007 due to investors requiring equity, but also due to large hedge funds capitulating due to fraudulent behavior.
Figure 7 shows the effect of using different measures for volatility on the bias ratio: only Fixed Income Arbitrage is shown. The fact that the bias ratio increased to as much as seven just prior to 2007 is suspicious, and if the bias ratio were used as a fraud metric, it would have resulted in an investigation.
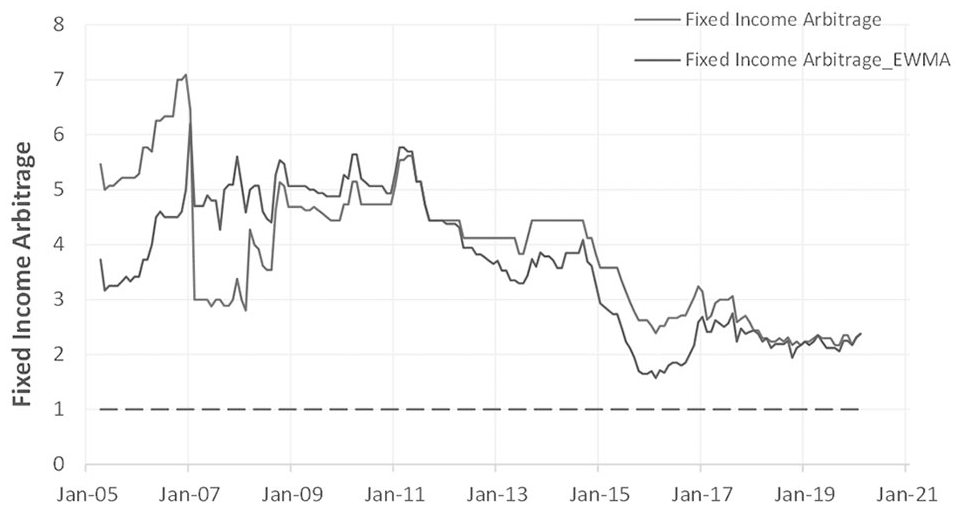
Fixed income arbitrage bias ratio over time. The dashed line reflects a bias ratio of 1.
Fraud may not necessarily have been committed, as there were opportunities to exploit arbitrage oppurtunities within the fixed income market during the financial crisis (Taliaferro & Blyth, 2011). However, considering the impact fixed income had on the GFC in 2008, it is likely that if the bias ratio was being used at the time as a fraud detection measure, some of the underlying funds in Fixed Income Arbitrage would have been further investigated.
Figure 8 shows the bias ratio for the Distressed Securities strategy. The bias ratio increases until its peak in 2011—aligning with the development of the European soveriegn crisis which arose in 2010. Hedge funds played a particularly big role in the crisis, because many funds purchased countries’ sovereign bond default protection, in particular Greece (Lagarde, 2010). This result is not one that is expected and could be an indication that some of the underlying funds were committing fraud. A hedge fund that uses the Distressed Securities strategy, purchase bonds/debt in firms/countries that have filed, or are expected to file for bankruptcy in the near future. Thus, in the lead up to the sovereign crisis, it is not clear as to how the bias ratio for the strategy would increase due to legal reasons. These countries, defaulted on their debt obligations and thus the instrument would be worthless. More negative returns were a result, leading to a lower bias ratio. The fact that there was a fairly constant increase in the bias ratio for this period contradicts this result, the bias ratio would most likely have highlighted that an investigation was needed into the underlying funds. The increase in bias ratio could be a result of survivorship bias: funds that did invest in the defaulted securities could have ceased to exist and thus are not included in the data.
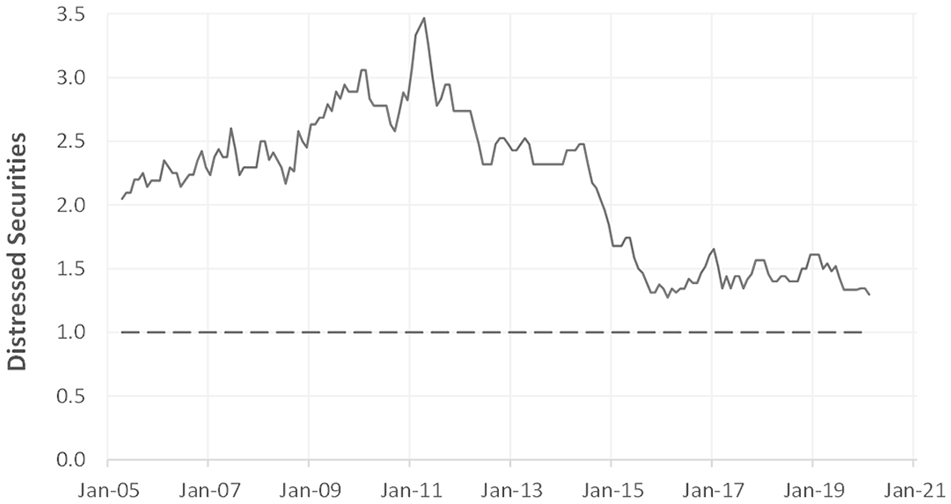
Distressed securities bias ratio over time. The dashed line reflects a bias ratio of 1.
Figure 9 shows the average bias ratio for emerging markets for the period this paper analyses. The period leading up to the GFC of 2008/2009 is the period of interest. The increase shown in the lead up to crisis, can somewhat be explained by the strong global growth experienced during that period (Llaudes et al., 2010).

Emerging markets bias ratio over time. The dashed line reflects a bias ratio of 1.
This result, had the bias ratio been used as a fraud metric, would still most likely have led to an investigation into these underlying funds. After the financial crisis of 2008/2009, it is evident that the bias ratio follows a downward trend until the present. This is most likely a consequence of survivorship bias. It is plausible to suggest that most hedge funds that were involved in fraudulent activity would have ceased to exist post the financial crisis. These funds would most likely have contributed to the high bias ratio of the index. Thus, post the financial crisis and these funds ceasing to exist, it is expected that the bias ratio will decrease.
Emerging markets outperformed the S&P500 considerably in the lead up to the GFC. Due to the nature of the bias ratio, strong performance can result in an elevated bias ratio, thus it can explain the emerging markets high bias ratio for that period.
The S&P 500 has outperformed the iShares Emerging Market exchange traded fund since the GFC crisis of 2008. The fact that this has occurred, could explain the downward trend of the bias ratio for the emerging markets index. Prior to the GFC, the general modus operandi of hedge funds was to invest in a wide array of funds, including funds with considerably different risk profiles. However, due to the decimation of the hedge fund industry post crisis, most funds reduced their exposure to higher risk securities and funds, so emerging market investments diminished. The combination of reduced investment, a decrease in funds and the elimination of weak or already-suspicious funds could plausibly have had the associated effect of reducing the probability of fraud in this market strategy, leading to lower bias ratios for this index.
All data used in this study were obtained from indices rather than individual funds. Although index returns provide useful information and could potentially flag suspicious strategies which occur more frequently in broad indices, the next step in fraud detection is to isolate individual hedge fund returns and calculate their bias ratios. The relative scarcity (and high cost of procuring) individual hedge fund return data precluded this possibility.
For hedge funds that have failed due to fraud, had the bias ratio been in use at the time preceding the fraud, this activity could have been detected earlier. Several hedge funds have failed due to fraud: three large ones are The Galleon Group, SAC Capital, and Madoff Securities. Both the Galleon Group and SAC Capital were convicted of Insider Trading compared to Madoff Securities, who was convicted of return manipulation. Figures 10 and 11 show the return characteristics of the Galleon Group and SAC Capital, respectively.

Galleon group bias ratio, skewness, kurtosis, and returns over time. The vertical line in the lowest graph indicates the start date for the results in the upper two graphs.

SAC capital bias ratio, skewness, kurtosis, and returns over time. The vertical line in the lowest graph indicates the start date for the results in the upper two graphs.
The results shown for The Galleon Group and SAC Capital highlights the practical use the bias ratio has, and how it can detect fraud. However, it shows to a greater extent the need to use all metrics available when analyzing a fund. If the bias ratio had been used in isolation, more than likely the fund would not have been flagged. However, when using the bias ratio, skewness, kurtosis, and returns in conjunction patterns can be observed.
In Figure 10, the period between Jan-02 and Jan-05 is of interest. Throughout the date range there is a constant increase in kurtosis, skewness, and the bias ratio. Furthermore, the returns show characteristics of fraudulent behavior, namely positive returns close to zero. If the bias ratio had been used in isolation, it would most likely not have flagged this fund for further investigation.
Like Figure 10, Figure 11 highlights the importance of using all metrics available when analyzing funds. with regards to the bias ratio, it would have raised a red flag as early as 2002 as well as 2004. A bias ratio
Both these hedge funds were charged for insider trading as opposed to return manipulation. However, considering the “slippery slope” argument, if firms are willing to commit insider trading, it is plausible they are willing to commit other crimes such as returns manipulation. Furthermore, both Figures 10 and 11 highlight a different use for the bias ratio. It is plausible to suggest that the bias ratio does not only detect return manipulation, but also unusual returns, or returns that have a low probability of occurring. Returns gained from insider trading will most likely fall into this bracket. Had the bias ratio been implemented during these periods, the insider trading committed by both the Galleon Group and SAC Capital may have been uncovered earlier. Figure 12 shows the bias ratio, skewness, kurtosis, and returns of Madoff Securities.

Madoff Securities group bias ratio, skewness, kurtosis, and returns over time. The vertical line in the lowest graph indicates the start date for the results in the upper two graphs.
Figure 12 further highlights the practical uses of the bias ratio. A bias ratio
The case study of the three funds shows the practical uses of the bias ratio in conjunction with the other metrics. It has shown that there are possible uses for the bias ratio other than detecting return manipulation, namely detecting unusual returns.
Limitations and Future Work
The returns used in this study were gleaned from indices of particular investment strategies. Index returns were used due to the difficult and expensive nature of acquiring individual hedge fund data.
Extant indices include returns from funds currently operating. Funds found committing fraud collapse, thus the results of this study are skewed toward funds that still exist.
Daily returns should ideally be used but all investment providers only report monthly data. To partially mitigate the impact of using monthly returns, 15 years (Apr-05 to Apr-20) of monthly data were used which included two financial crises (of which hedge funds were a considerable contributor);
Regions of study are combined into global indices so individual region analysis is impossible. However, this is partially negated because just under 90% of hedge funds are based in other the UK or US (Aurum, 2020).
Further tests of the effectiveness of the bias ratio against individual hedge fund returns are warranted. This sample group should comprise hedge funds that have been convicted of fraud, hedge funds that are suspected of committing fraud and funds that are not suspicious. This would allow for a diverse sample and control group where results could be analyzed and useful conclusions could be made. If the effectiveness of the bias ratio is proven to the relevant extent, it should be implemented more extensively in the financial sector (in the regulation of hedge funds) thereby providing the integrity pertinent to functioning, trustworthy financial sector.
Fraudulent behavior other than return manipulation could be investigated. Evidence suggests that it can be used to detect unusual returns, however the level of efficacy needs to be investigated further.
The bias ratio could be applied to funds such as Exchange Traded Funds (ETFs) and quantitative funds. This would extend our understanding of the bias ratio as well as its value in uncovering abnormal returns in funds other than hedge funds. This is of increasing importance as the popularity of both ETFs and quantitative funds rises.
The robustness of the bias ratio in highly stressed markets is currently unexplored: further investigation is required to understand this. The severely volatile market conditions experienced in 2020/21 because of the COVID-19 pandemic, may provide a convenient period to test this.
Conclusions
Fraud arises in all divisions of the financial industry, but the scale and prevalence of fraud that has occurred in hedge funds has placed this sub-sector under enhanced scrutiny (Phillips, 2004). The deception perpetrated by Madoff Securities and the role played by hedge funds in the severity of the credit and sovereign crises experienced in many European countries in 2011/2012 only emphasized the need for robust industry regulation.
The bias ratio is a mathematical formulation that can be used to identify both fraudulent behavior and return manipulation (Abdulali, 2006). It can, for example, identify suspicious levels of portfolio return serial correlation, a clear and common indicator of return manipulation. While serial correlation is not the ultimate arbiter of fraud prevalence (illiquid instrument returns can produce the same effect), its presence can signal a warning of the possibility of suspicious behavior. The bias ratio, although not infallible, identifies suspicious fund returns which may consequently warrant further investigation using additional market metrics.
The bias ratio enjoys many practical successes in fraud identification: a prominent example is that of Madoff Securities. If the bias ratio had been used rather than the Sharpe Ratio as a fraud measure, the activity would have been detected earlier and warranted deeper investigation sooner, thereby reducing the impact of the fraud as investors withdrew or refused to invest.
Analysis of the returns reported by two hedge funds convicted of insider-trading (SAC Capital and The Galleon Group) shows that the bias ratio is also useful in the detection of unusual, or abnormal, returns. Madoff Securities’ returns were abnormal because they were consciously manipulated, while returns generated from insider-trading may be unusually (or persistently) high. These abnormalities are also easily identified as being suspicious by the bias ratio, so it may also be used to uncover insider-trading and other fraudulent behavior.
The bias ratio, used in conjunction with the other statistical metrics currently available, could provide much needed regulatory control over the investment industry, and in particular the hedge fund industry.
Footnotes
Declaration of Conflicting Interests
The author(s) declared no potential conflicts of interest with respect to the research, authorship, and/or publication of this article.
Funding
The author(s) received no financial support for the research or authorship of this article. Funding was provided for publication of this article by the University of Cape Town and North-West University.