
Abstract
This article aims to elaborate a systematic literature review (SLR) on the subject of experiments in behavioral finance, including papers published between 2014 and 2018. Methodology involved the careful selection of articles published in Web of Science and Scopus databases, and bibliometric analysis was applied. Final sample included 60 articles, the Journal of Behavioral Finance was the most productive journal and the majority of the 152 authors worked in the Americas. For cocitation, important authors, such as Kahneman and Tversky and Barber and Odean were among the most cited and with greater relational ties. For bibliographic coupling, Bursztyn et al. and Bigelow et al. were the most cited, whereas Kadous et al. presented more relational ties. The research contribution lies in the application of the SLR to a growing research area, allowing to know the most relevant subjects, articles, journals, authors, and countries in the area nowadays.
Introduction
The concept of behavioral finance emerged from the studies of Tversky and Kahneman (1974). At that time, the expected utility theory and efficient market hypothesis predominated in financial and economic theories, wherein individuals would make strictly rational decisions and maximize the usefulness of each decision (Barberis & Thaler, 2003). Tversky and Kahneman (1974) showed that individuals often make decisions from simplified decision-making processes, called heuristics, and are susceptible to cognitive biases.
According to Barberis and Thaler (2003), behavioral finance is a new approach to the study of financial markets that emerged as a reflection of the difficulties encountered by traditional theories, because some financial phenomena can be better understood by using models where agents are not completely rational. Pompian (2006) defined behavioral finance as the application of psychology to finance.
Much of the financial literature focuses on the decisions of auditors and managers and the behavior of investors in negotiation decisions, leading to the publication of a large number of experimental studies in the 1960s and 1970s (Libby et al., 2002). Moreover, the instruments of the experimental method—the ability to observe directly, control, and manipulate variables—are adequate for the research in behavioral finance, because many variables are not observable and are difficult to measure or control for researchers examining data from real financial markets (Duxbury, 2015).
Knowing the importance of the behavioral finance and the extensive use of experiments as a research method in the area, it was expected to find studies that conducted a survey of the most relevant articles. Conlisk (1996) presented a number of papers dealing with limited rationality; Duxbury (2015) made a research of perceptions provided by experimental studies examining financial decisions and market behavior; whereas Libby et al. (2002) compiled a series of experimental papers in finance to illustrate how experiments can be conducted successfully. Recently, Calma (2019) conducted a literature review focused on the papers published in the Journal of Behavioral Finance, but did not give priority to the experimental method.
A literature review allows researchers to map and access the existing intellectual territory and to develop the body of knowledge (Tranfield et al., 2003). However, reviews conducted in management and finance have been criticized for being carried out without criteria, based on the researcher’s biases. This is the case in the first three literature reviews presented previously, which did not adopt a selection criteria, whereas Calma (2019) performed a very careful review. Thus, the adoption of a systematic literature review (SLR) is appropriate, once it allows to confront biases through the use of preestablished premises that guide the review.
To elaborate this article, researches in databases of journals were made to find articles that fit as an SLR and that approached behavioral finance and experiments. The SLR by Costa et al. (2017) addressed the association between behavioral finance and decision-making with cognitive biases such as overconfidence, anchoring effect, and anchoring bias; however, it gave no relevance to the experimental method.
Thus, this article aims to elaborate an SLR on the subject of experiments in behavioral finance. Because the seminal researches that address the two concepts have been extensively explored in the literature, the focus of this SLR is on articles published recently, covering the period from 2014 to 2018. The year 2019 was not included because it had not closed during the elaboration of this research; also, the chosen period of analysis is in line with Campanario (2011), according to which, researchers tend to use and cite papers published in the last 3, 4, or 5 years, more often than papers published 1 or 2 years ago. Through the SLR, the article offers an overview of what is being discussed in the most recent academic articles, the main journals and authors, which can serve as a guide to authors in choosing their research topic.
Specific objectives were defined to conduct the SLR: (a) Select the best articles published between 2014 and 2018 in the Web of Science (WOS) and Scopus databases, using a series of specific criteria; (b) analyze titles, abstracts, and keywords of each of the selected articles; and (c) perform a bibliometric analysis of the final set of articles, which is based on the research protocols of Tranfield et al. (2003) and Zupic and Čater (2015).
This article is structured in five sections, the first being this introduction. The next section presents the theoretical framework, approaching behavioral finance and experiments. The “Method” section shows the methodological procedures used in the research, whereas the section “Analysis of SLR Results” presents the analysis of results. Finally, the section “Final Remarks” presents the conclusions, limitations, and recommendations for future research.
Theoretical Framework
Behavioral Finance: Background and Consolidation
Before the concept of behavioral finance was developed, many financial and economic theories tried to explain how investors made decisions and how financial markets worked. Regarding the investor’s decision-making process, emphasis was placed on the theory of expected utility, through which Von Neumann and Morgenstern (1944) analyzed the behavior of individuals in situations of uncertainty, and concluded that individuals assessed risk in a rational way, always seeking to maximize their utility. Regarding the markets, Fama (1970) consolidated the hypothesis of efficient markets, arguing that an efficient market is one where prices totally transmit all the available information and that, in certain situations, markets may not be fully efficient. It can be said that the efficient market hypothesis is a development of the expected utility theory, because it presupposes that, if individuals were rational, markets would be efficient by definition (Shleifer, 2000).
Over time, those paradigms were criticized and a new financial theory emerged, behavioral finance. In this approach, Tversky and Kahneman (1974) demonstrated that the decision-making process of individuals in situations of uncertainty is affected by the existence of heuristics and cognitive biases; thus, individuals will not be rational as indicated by previous theories. The concept of heuristics is defined by Kahneman (2011) as a research device based on the progressive approximation of a problem, so that each step is considered to be provisional, and biases are described as systematic errors that repeat themselves in a predictable way in particular situations.
The expected utility theory was criticized by Kahneman and Tversky (1979), who developed the prospect theory, describing how individuals choose between alternatives involving risk, where the probabilities of results are uncertain, and taking into account the heuristics and biases. The authors concluded that individuals are risk averse in situations of sure gains, but risk prone in situations of sure losses, and suggested that losses generate a greater emotional impact on people than gains.
From the prospect theory, the disposition effect concept was deduced. Shefrin and Statman (1985) described it as a tendency of investors to sell “winning” shares or assets—those showing a price increase—faster than “losing” stocks or assets, which are experiencing a constant decline in their value. Thus, investors will retain “losing” assets for longer, a fact linked to the emotional impact of losses on individuals.
Barberis and Thaler (2003) affirmed that the formal beginning of behavioral finance occurred around the 1980s, when many theoretical researches developed models of the financial markets considering not totally rational agents. Although 40 years have passed, Kahneman and Tversky’s (1979) prospect theory, one of the milestones of behavioral finance, continues to be approached extensively in academia, as do heuristics, biases, and the disposition effect. Current articles dealing with the prospect theory and adding other elements include those by Jiao (2017) and Kohsaka et al. (2017).
The Experimental Method in Behavioral Finance
According to Smith (1976), the study of the decision-making behavior of individuals and groups in laboratories or other isolated facilities has an important application for the development and verification of theories of the economic system. The author argues that laboratory experiments allow “real-world” features, such as risk aversion and self-interest motivations, to arise naturally in an experimental setting where real people can make real money by making decisions based on fictitious statements.
Although appropriate for behavioral finance, Kahneman and Tversky (1979) criticized the use of experiments, stating that certain characteristics of the laboratory experiment, such as involving invented bets for certain situations and the repetition of very similar problems, complicate the interpretation and restrict its generality. However, in subsequent research, Tversky and Kahneman (1992) adopted the experimental method.
Libby et al. (2002) argued that there was a boom of financial publications using the experimental method in the 1960s and 1970s, but they were widely criticized in the 1980s and 1990s, due to the irrelevance of individual behavior in the market’s configuration, to the fact that research methods chosen by the authors were not adequate to the research questions, and to the almost nonexistent psychological or economic theory to predict effects and to specify the mechanisms by which they occur. Notably, the experimental method resurged in the mid-1990s, and research involving both individual behavior and so-called experimental economics became examples of well-executed studies (Libby et al., 2002).
Finally, it is perceived that experiment continues to be a widely used method in behavioral finance. For example, the papers by Bulipopova et al. (2014), Goulart et al. (2015), Kempf et al. (2014), and Ploner (2017) used the experimental method to study the behavior of individuals in different decision-making situations.
Method
The SLR method was used to analyze experiments conducted in behavioral finance between 2014 and 2018. The SLR allows to map and access the existing intellectual territory, besides specifying a research question to develop the existing body of knowledge (Tranfield et al., 2003). Thus, this research seeks to answer the following question:
The question was defined with literature support, which showed the wide use of the experimental method in behavioral finances, as in Barber and Odean (2001), Bulipopova et al. (2014), Graham et al. (2017), Kadous et al. (2014), and Tversky and Kahneman (1992).
The SLR’s development was based on a research protocol, because it requires great methodological rigor to neutralize research bias, by making explicit the values and hypotheses that underpin the review (Tranfield et al., 2003). Thus, the research protocol by Tranfield et al. (2003) was followed, which is composed of three stages: review planning, review conduction, and dissemination of knowledge.
Stage 1: SLR Planning
The first stage of the SLR consists of its planning, which requires identification of the need for a review, preparation of a proposal for review, and finally, development of a research protocol. It was verified that there were no published SLRs involving the terms “behavioral finance” and “experiments”; then, the proposal was elaborated and the protocol developed, containing information on specific issues addressed by the study, the sample, and the criteria for inclusion of the studies in the SLR, as suggested by Tranfield et al. (2003). The protocol is a plan that ensures the objectivity of the study by explicitly describing the steps to be taken (Tranfield et al., 2003).
Stage 2: Conducting the SLR
The second step is to carry out an article search in a comprehensive and impartial way, choosing keywords that best align with the research question (Tranfield et al., 2003). Searches using keywords in the English language that characterize behavioral finance and experiments were carried out in two journal databases, WOS and Scopus. The search string TS = (“behavioral finance*” AND “experiment*”) was used in WOS, and the string used in Scopus was TITLE-ABS-KEY (“behavioral finance*” AND “experiment*”). As the subject of behavioral finance and experiments is broad, some restrictions were applied. Only articles written in English were chosen. They must fit into certain areas of the SCImago Journal Ranking (SJR)—accounting; economics and econometrics; finance; strategy and management; economics, econometrics, and finance (miscellaneous); business, management, and accounting (miscellaneous). They must be published between 2014 and 2018. Journals must belong to Q1 and Q2 of the SJR (to capture only the most relevant journals). Duplicate articles were taken from one of the databases; and titles, abstracts, and keywords of the articles were read to ensure that they fitted the topic. In the paper selection process, the desired areas/subjects and quartiles were defined previously, both from SCImago. From the articles that emerged in the filtering, each of the journals in which the papers were published were consulted in the SCImago’s website, to know which areas and quartiles the journals belonged to. Figure 1 presents the flowchart of the articles’ selection.

Flowchart of the textual corpus selection process.
The search was performed on August 14, 2019, and initially 136 results were found in WOS, whereas 238 results were in Scopus. After the application of all search filters, 30 articles in the WOS and 30 in the Scopus database remained, totaling 60 articles that compose the research corpus, published in 17 journals. Selected articles were grouped in a spreadsheet and data regarding citation indicators and content of each study were extracted. For the citation indicators, there are seven items: year of publication, journal in which it was published, title, number of times it was cited, number of authors, names of authors, and country where the authors worked. Regarding the content indicators, there are keywords and abstract.
Stage 3: Dissemination of Knowledge
The third stage is the dissemination of results. According to Tranfield et al. (2003), through this stage, there is the generation of knowledge. This stage comprised the detailed analysis of characteristics of the papers composing the research corpus, based on data collected in the citation indicators. The spreadsheet, HistCite (Garfield, 2007), VOSviewer (Van Eck & Waltman, 2018), and Iramuteq software were used. To fit the Scopus records in the HistCite software, because it accepts only WOS’ records, each article that emerged in the Scopus database was searched in the WOS database. Coincidentally, all the Scopus’ papers were found in the WOS database, which did not emerge in our structured search.
At this stage, the following tasks were undertaken: (a) verifying the number of publications per year, (b) examining which journals are the most relevant in the area of knowledge, (c) knowing the countries and institutes to which the authors are affiliated, (d) analyzing the authorship composition of the papers, (e) verifying the scientific productivity of the authors, (f) performing author’s cocitation and bibliographic coupling analyses, and (g) verifying the occurrence of words in the articles analyzed. Tranfield et al. (2003) pointed these tasks as fundamental for an SLR, whereas Zupic and Čater (2015) also support the analyses of cocitation and bibliographic coupling.
Analysis of SLR Results
Distribution of the Textual Corpus Per Year
The first step of the analysis shows the distribution of articles published during the studied period, 2014 to 2018. As observed in Figure 2, there was great variation in the frequency of publication of articles on the subject behavioral finance and experiments.

Distribution of articles published per year between 2014 and 2018.
During 2014, 15 articles (25% of the sample) were published, being the period with the highest number of published papers for the entire period. The paper by Bursztyn et al. (2014), titled “Understanding Mechanisms Underlying Peer Effects: Evidence From a Field Experiment on Financial Decisions,” published in 2014 in Econometrica, achieved a total of 66 citations worldwide until the data collection to this paper was completed, being the most cited paper of the textual corpus.
In the following years, there was a gradual reduction in the number of published articles, going to 13 articles (21.67%) in 2015 and seven articles (11.67%) in 2016. This demonstrates that the combination of the two concepts may have become less relevant, or possibly there was a greater number of publications in journals that belonged to other citation quarters (Q3 and Q4), which were not part of the sample because they are less expressive. From the year 2017, an increase was perceived, reaching 11 published articles (18.33%), and in 2018, 14 articles (23.33%).
Reputation of Textual Corpus Journals
The second analysis concerns the characteristics of the 17 journals in which the articles of the research corpus were published. Table 1 shows a list with the journals’ names, the number of articles published in each of them during the period, the SJR quartile to which they belong, their SJR and H indexes, and their countries of origin. Such indexes help to verify the productivity and relevance of journals.
Analysis of the Journals’ Reputation.

Source. Prepared by the authors.
Note. SJR = SCImago Journal Ranking.
For SJR quartiles and index, the reference year adopted was 2018.
In the period studied, the Journal of Behavioral Finance published the largest number of articles (36 articles, 60% of the sample), being the most relevant journal. This number is quite expressive, because the second most prolific journals were the Journal of Behavioral and Experimental Finance and the Journal of Economic Behavior & Organization, with only four articles (6.67%) each. Other journals published one or two articles. For the quartiles of the SJR classification, 10 journals belong to the Q1 quartile of citations (58.82% of the total journals), whereas seven are in Q2 (41.18%). The most prolific journal is located in Q2.
Regarding the SJR and H indexes, the highest SJR index belongs to Econometrica (17.64), whereas the highest H index belongs to Management Science (221); each of these journals published only one article in the sample. Regarding the journals’ countries of origin, seven are from the United Kingdom (41.18% of the sample), five from the Netherlands (29.41%), four from the United States (23.53%), and one from Turkey (5.88% of the sample). It should be noted that the Journal of Behavioral Finance and the highest SJR index (Econometrica) are from the United Kingdom, whereas the journal with the highest H index (Management Science) comes from the United States. Furthermore, Econometrica, with the highest SJR index, published the most cited article of the sample.
Furthermore, the analysis of journals’ productivity is supported by Bradford’s (1953) law, because it was possible to visualize that the logarithm of the cumulative number of journals and the cumulative number of papers formed an approximately S-shaped graphic. Regarding the zones, when establishing two zones with 30 papers each, it is clear that the core is formed by the Journal of Behavioral Finance alone, whereas the remaining journals belong to zone 1.
Distribution of Textual Corpus Authors by Country
Subsequently, the articles’ authorship was analyzed. According to HistCite software, by Garfield (2007), the total number of authors is 152, distributed among the 60 articles in the database. Regarding the authors’ place of work, Figure 3 presents its distribution by country.
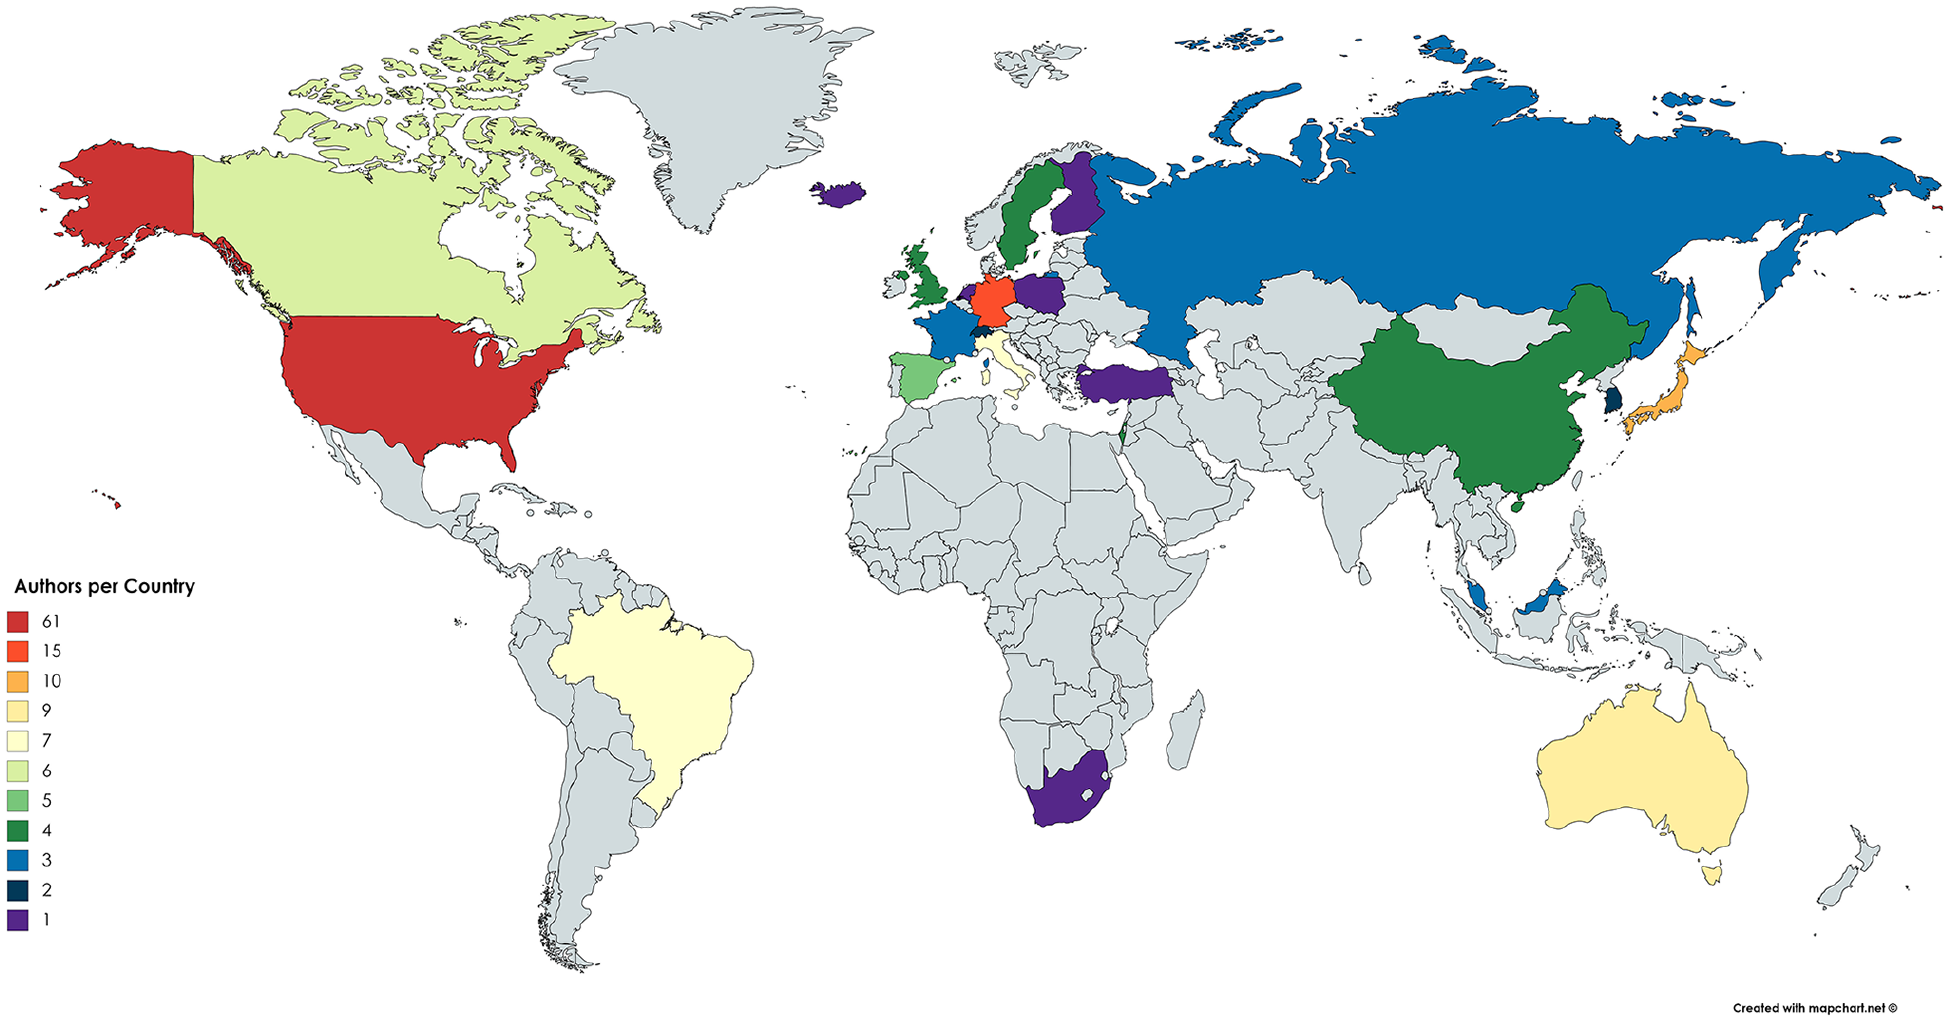
Distribution of authors of the textual corpus by country.
As observed, the 152 authors are scattered in 23 countries. Furthermore, 61 authors (39.35% of the total) work in institutions located in the United States, country with the largest participation in the textual corpus. In second place, Germany has 15 authors (9.68%), whereas Japan has 10 authors (6.45%), Australia has nine authors (5.81%), and Brazil and Italy each have seven authors (4.52% each) participating in their institutions.
Canada has six authors (3.87%), Spain has five authors (3.23%), and China, Israel, Sweden, and United Kingdom have four authors each (2.58% each). Moreover, France, Malaysia, and Russia have three authors each (1.94% of the sample each); and Switzerland and South Korea have two authors (1.29%) each. Finally, the countries Finland, Iceland, Netherlands, Poland, South Africa, and Turkey, each, have only one author (0.65%) participating in its institutions. It is important to clarify that the total sum of authors distributed across countries is 155, as some authors are linked to different countries.
Analyses of Authorship Composition and Authors’ Productivity
The next analyses concern the authorship composition and the authors’ productivity. Figure 4 shows the authorship composition of the articles over the 5 years studied.

Composition of authorship of the textual corpus.
According to Figure 4, there is intense collaboration in the production of the articles, and the average number of authors per article was of 2.53. These results show that 55 articles (91.67% of the sample) have two or more authors, and only five articles (8.33% of the sample) have just one author. Regarding the papers with only one author, three of them were cited only once, whereas one of them was cited 3 times and another one was not cited during the period. The limited citation of articles with only one author may be attributed to the fact that they are relatively recent articles, because certain papers take at least 2 years to be cited (Leydesdorff, 2009).
In detail, 24 articles (40% of the sample) have two authors, whereas 17 articles (28.33%) have three authors, and 14 articles (23.33%) have four or more authors. It is worth mentioning that the most cited article in the sample, by Bursztyn et al. (2014), which was cited 66 times, had the participation of four authors. The second most cited article, by Bigelow et al. (2014), which obtained a total of 25 citations, also involved four authors. The third most cited article, with 22 citations, by Frydman and Rangel (2014), was produced by two authors. These results demonstrate that the most cited articles of this textual corpus were elaborated from partnerships.
Regarding authors’ productivity, a large part of the sample—specifically 142 of the 152 authors (93.42%)—participated in the publication of only one article. Conversely, only 10 authors (6.58%) participated in the publication of two articles. Authors who had participated in the publication of more than two articles in the sample were not found. The most productive authors were, therefore, those who participated in the publication of two articles: Anderson, L. R., Andersson, M., Bossaerts, P., Deck, C., Garling, T., Hedesstrom, M., Porter, D., Seiler, M. J., Voskort, A., and Nursimulu, A. D. It should be noted that the productivity of authors is commonly supported by the law of Lotka (1926).
Analyses of Author’s Cocitation and Bibliographic Coupling
Subsequently, author’s cocitation and bibliographic coupling analyses were undertaken using VOSviewer software, by Van Eck and Waltman (2018). This step was performed based on the protocol of Tranfield et al. (2003) and Zupic and Čater (2015). Initially, the author’s cocitation analysis was performed, which is defined as the frequency at which two authors are cited simultaneously (Small, 1973; White & Griffith, 1981). An important issue of cocitation is the fact that the more two articles are cited together, the more likely it is that their content is related (Zupic & Čater, 2015).
The author’s cocitation analysis is presented in Figure 5. For its elaboration, a total of 1,673 authors were considered, related to the references cited in the 60 articles of the corpus. In the software, the cocitation analysis was considered as the type of analysis, the unit of analysis being cited authors, and the chosen counting method was full counting. A minimum number of eight citations was defined for each author, a restriction that allowed the best visualization of the network. The method of normalization applied was association strength. As results, it generated 21 ties—that is, 21 sets of authors, 147 links, and total link strength of 943.

Authors’ cocitation network.
The author’s cocitation analysis indicated the existence of four clusters, in which the size of the node is related to the number of citations of a set of authors, and the lines that interconnect them show the cocitation relationships between the sets of authors—that is, they were cited in the same document.
To complement the network analysis, the characteristics of eight of the 21 nodes, each of the clusters being represented by their two most relevant nodes, are presented in Table 2. Regarding the papers’ content, the seven set of authors in Cluster 1 approached individual issues, such as the concepts of overconfidence and differences between genders. In relation to Cluster 2, it presented six groups of authors, who proposed improvements or changes to the study of the prospect theory and the disposition effect, including the study of the financial literacy. Cluster 3 also presented six sets of authors, and approached the traditional versions of prospect theory and disposition effect. Finally, Cluster 4 has an approach very similar to Cluster 3, and presented two groups of authors.
Top Eight Most Cited Authors in the Textual Corpus.

Source. Prepared by the authors.
In the first cluster, there are Barber and Odean (Node 4), which were cited in 20 papers (13.70% of the top eight citations) and presented 164 relational ties. Barber and Odean (2001) observed the behavior of investors, splitting them by gender, and concluded that men carry out asset transactions much more often than women, which reduces the net return women get compared with men. Those authors are linked to Fischbacher (Node 5), also located in the first cluster, an author who was cited 12 times in the sample (8.22%) and had 68 relational ties. Fischbacher (2007) presented a tool that can be used to conduct economic experiments.
Fischbacher is connected to Tversky and Kahneman (Node 2), who are located in the second cluster, two authors who contributed greatly to the development of behavioral finance, and were cited in 21 papers of the sample (14.38%) and had 141 relational ties. Tversky and Kahneman (1992) proposed an improvement to the prospect theory, suggesting different weights for different levels of certainty regarding a gain or a loss. Thus, in a situation of low probability of gain or high probability of loss, individuals are prone to risk, and in situations of high probability of gain and low probability of loss, they are averse to risk. Tversky and Kahneman are linked to Lusardi and Mitchell (Node 7), also in the second cluster, who were cited 11 times (7.53%) and presented 44 relational ties. These authors are recognized for their research on financial literacy, for showing its importance on the decision-making process and how the financial literacy levels vary across gender, age, and countries, as in Lusardi and Mitchell (2011).
Lusardi and Mitchell are linked to Kahneman and Tversky (Node 1), who belong to the third cluster and were cited 29 times in the sample (19.86%), presenting 165 relational ties. They are the most cited authors in the cocitation analysis. In a seminal research, Kahneman and Tversky (1979) analyzed the decision-making of investors in risky situations and realized that they are risk averse to gains but risk prone to losses according to prospect theory. Kahneman and Tversky are linked to Barberis and Xiong (Node 6), also located in Cluster 3, who were cited in 27 papers of the sample (18.49%) and presented 191 relational ties, being the authors with the most relational ties in the cocitation analysis. Barberis and Xiong (2009) investigated how preferences in prospect theory can predict the disposition effect, defining a model with preferences based on losses and annual gains, and another model with perceived losses and gains in a specific asset, showing that this last model more effectively predicts the willingness of investors.
Barberis and Xiong are linked to Weber and Camerer (Node 3), who are located in the fourth cluster and were cited in 18 papers of the sample (12.33%) and had 169 relational ties. Weber and Camerer (1998) also studied the disposition effect through an experiment, in which subjects had to buy and sell shares in six risky assets, and confirmed the subject’s tendency of keeping losers and selling winners. Finally, Weber and Camerer are related to De Bruin et al. (Node 8), also in the fourth cluster, who were cited 8 times in the sample (5.48%) and presented eight relational ties. De Bruin et al. (2011) introduced a measure of uncertainty about future inflation, based on a survey, asking subjects to give forecasts across inflation outcomes, and showed that the heterogeneity in the uncertainty expressed by respondents was related to demographic characteristics and financial literacy levels. Regarding the connection between the four clusters, it can be seen that the relational ties between all the sets of cocited authors cover all clusters. Finally, from the analysis of Figure 6 and Table 2, it is possible to identify the main trends studied in the field of behavioral finance, in addition to the connections between the main authors.

Network of bibliographic document coupling.
Regarding bibliographic coupling, it allows to identify similarity between pairs of documents from the analysis of the common citations used (Kessler, 1963). If two works cite the same source, they are expected to have thematic similarity. Bibliographic coupling is also the most appropriate analysis to verify the evolution and current pattern of a research domain (Zupic & Čater, 2015). Figure 6 shows the network of documents coupled in the corpus.
In VOSviewer, the type of analysis chosen was bibliographic coupling, with document as the analysis unit; the counting method was full counting. Of the 60 documents, only those with at least four citations were selected, totaling 19 documents. Of these 19 documents, 18 were retained, because one had no connection with the other documents. The choice of at least four citations allowed the best visualization of the network, which presented four clusters. In Figure 6, the nodes’ size represents the number of citations of a document, whereas the lines indicate the coupling ratios—the documents are linked by having an equal number of citations.
Subsequently, Table 3 shows the analysis of the coupled documents. It can be seen that Cluster 1 is formed by seven documents and had a total of 76 citations. The paper by Bigelow et al. (2014; Node 1) was the most cited in Cluster 1, with 25 citations (32.89% of the cluster’s citations), whereas Oehler et al. (2018; Node 6) had the largest number of relational ties in the cluster, totaling 32 ties. Regarding the themes studied in Cluster 1, overconfidence, gender differences, and age of individuals—issues that affect the behavior of investors in their decision-making in financial markets—are noticed. Cluster 2 presented four documents and obtained 44 citations. Cluster 2’s highlights were Frydman and Rangel (2014; Node 8) with 22 citations (50% of cluster’s citations) and Kadous et al. (2014; Node 9) with 46 relational ties, being the article with the most relational ties among the bibliographic coupled documents. In this cluster, topics involve the disposition effect and prospect theory.
Analysis of the Coupled Documents.

Source. Prepared by the authors.
In Cluster 3, four documents were grouped and 34 citations were obtained. The paper by Nursimulu and Bossaerts (2014; Node 12) had 13 citations (38.24% of the cluster’s citations) and Bateman et al. (2015; Node 14) presented eight relational ties. Cluster 3 approached the taxes aversion bias that affects assets, volatility, and risk preferences based on investor demographics. Finally, Cluster 4 presented three documents and a total of 75 citations. Bursztyn et al. (2014; Node 16) had 66 citations (88% of cluster’s citation) and was the most cited article in the whole sample, whereas Andersson et al. (2014; Node 17) presented 17 relational ties. This cluster approached subjects such as psychological aspects and herding behavior in financial markets.
Analysis of Occurrence of Words
The occurrence of words in the textual corpus was evaluated from the articles’ abstracts, finding support in Zipf’s (1949) law, and a word cloud and an analysis of similarity were performed. The word cloud consists of a figure presenting the words occurring in a text, in different sizes. The size of the word corresponds to its importance within the textual corpus: Those written with larger fonts are more important, those in smaller fonts less so. The software used for such analysis was Iramuteq.
The abstracts that compose the textual corpus contained a total of 8,330 words with the application of the lemmatization. The number of forms present in the corpus (active and supplementary words) was 1,474, of which 643 words occurred only once; the mean number of words per summary was 138.83. Figure 7 shows the word cloud, in which only words with at least five occurrences were selected to help in the visualization of the most important words.
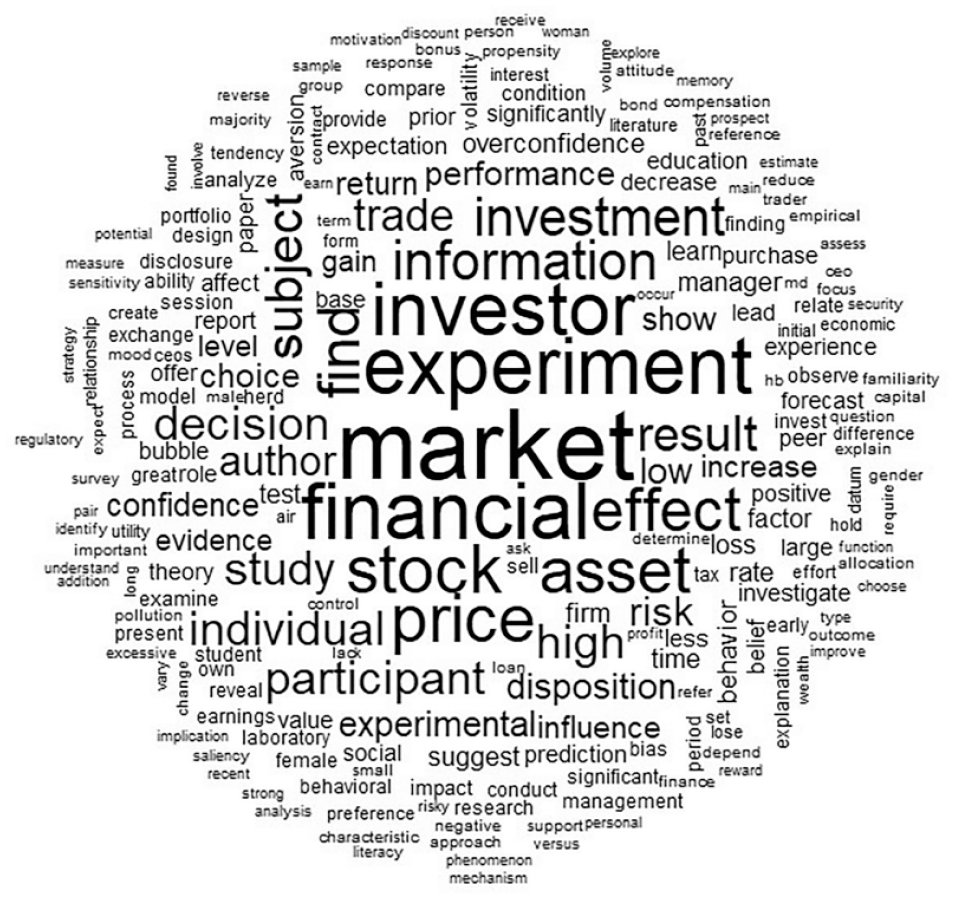
Word cloud of the textual corpus.
The words of greater importance in the textual corpus are “market,” with 86 occurrences (1.03% of the total cases); “experiment,” with 69 occurrences (0.83%); “financial,” also with 69 occurrences (0.83%); “investor,” with 64 occurrences (0.76%); and “stock,” with 56 occurrences (0.67%). This allows to identify the focus that the textual corpus gave to the analysis of investor’s decisions in financial issues and in stock markets, through the use of experiments. Also, appearing as less frequent words are “price,” “asset,” “effect,” investment “information,” “risk,” “disposition,” “decision,” “overconfidence,” and “subject,” among others.
Finally, the similarity analysis consists of an image representing the connection between the words in the corpus, from which it is possible to infer the arrangement of the construction of the text and the most relevant themes. In Figure 8, there is the representation of such analysis.

Similarity of corpus’ words.
The word “experiment” is the nucleus of the semantic set of words, from which other words branch out. The terms that appear in the similitude graph are those with the highest number of occurrences in the texts; for the construction of the graph, this was limited to words that had at least 20 occurrences to facilitate the visualization. In the graph, the thicker connection lines show a greater relationship between words, a characteristic we can observe between the words “experiment” and “stock,” “experiment” and “find,” “experiment” and “subject,” “experiment” and “investor,” “experiment” and “market,” “effect” and “disposition,” “market” and “price,” “market” and “financial,” and “market” and “asset.”
Directions for Future Research
Regarding the particularities of this research, there are the in-depth results, which revealed some proposals, arising both from the corpus’ papers and from the authors’ insights, in a way that it can help in the development of future researches on the experimental behavioral finance framework, contributing to the expansion of this research line in academic or organizational terms.
Initially, for the undertaking of new researches that approach an experimental stock market, the use of variables such as personality traits of the individual economic agents, as well as their sociodemographic characteristics is suggested, because those variables can affect the behavior of the market. Probably, those variables can interfere in the investors’ financial decisions, mainly in researches involving speculative bubbles, and such ideas are in line with those described by Oehler et al. (2018).
Also, concerning researches that employ the laboratory configuration, through techniques of simulations involving risk, it is proposed to ask the investors about the return distribution of investments, to better understand where do the differences in investor behavior over time come from, and to better know the short-term return expectations by individuals, which can help to obtain more assertive information about the behavior’s mechanisms in negotiations. Such a suggestion agrees with the ideas of Bradbury et al. (2019).
Another recommendation to the development of future research is in accordance with Bartholomae et al. (2019), who consider an experimental environment of investment decisions in human capital, which is to include qualitative components, such as gender biases, in this kind of research, in a way that seeks to explain the respondents’ attitudes regarding the decision-making in risky conditions and in scenarios that involve uncontrolled debt. In this context, the inclusion of noneconomic factors in future experiments, such as meeting new people, expansion of network, acquisition of new skills, factors that reflect a realistic world in a simulation context, because the investments in personal growth does not bring only financial benefits, must be considered.
Finally, another suggestion to future experimental researches, in which the dividend payment and the profit increase are addressed, concerns the fact that the authors should include in the simulations possible nonlinear effects in the increase of profitability, because the behavior of these effects can be reversed as sufficiently high levels of profits, or even as rates of return sufficiently small for the investors. Such a proposition is consistent with what is portrayed by Jia and McMahon (2019).
Final Remarks
This article carried out an SLR, focusing on articles recently produced in the behavioral finance area and which were classified as experiments. The behavioral finance line is constantly expanding, and its seminal literature has already been extensively explored, giving space for verification of the most current studies, in the publication period from 2014 to 2018. The choice of the experimental method was based on it being one of the most used methods, since the initial researches, to study the behavior of investors in a fictitious environment.
The textual corpus included 60 articles, following the application of several filters, where only the most relevant papers and journals with a high reputation were chosen. The year with the greatest number of publications was 2014, comprising 25% of the sample. Regarding the journals in which the papers were published, 10 are located in Q1 of the SJR, whereas seven are located in Q2. The Journal of Behavioral Finance (Q2) was prominent in productivity, having published 36 articles (60% of the sample).
The total number of authors in the textual corpus is 152, who worked in 23 countries, predominantly in the United States. As to authorship composition, 91.67% of the papers had two or more authors, and regarding productivity, the majority of authors (93.42%) participated in the authorship of only one article, whereas 6.58% participated in the authorship of two articles of the corpus. The most cited paper was that by Bursztyn et al. (2014), developed by four authors, with 66 citations.
In the cocitation analysis, the very important authors for the development of the subject, such as Kahneman and Tversky, Barber and Odean, and Barberis and Xiong, were among the most cited and with greater relational ties. Analyzing the similarity between articles by the number of references in common, Bursztyn et al. (2014) and Bigelow et al. (2014) were the most cited papers, whereas Kadous et al. (2014) presented the highest number of relational ties (46). In these two analyses, the existence of four clusters was detected, which generally addressed the prospect theory, the disposition effect, overconfidence, and other investors’ characteristics that can affect behavior, such as gender and age.
Regarding the occurrence of words, a word cloud evidenced major use of the words “market,” “experiment,” “financial,” “investor,” and “stock.” In the similitude analysis, “experiment” was the most important word, representing the nucleus, from which other words branched, especially “information,” “investor,” “subject,” “stock,” and “find.” It was also noticed that there is a strong connection between “effect” and “disposition,” because the disposition effect was very approached in the textual corpus, and between “market” and “financial” and “market” and “asset,” because the price of assets in the financial markets was also studied.
As contributions, this research brought the application of the SLR method to the subject of experiments in behavioral finance—a very specific subject, but a widely used research method which had not yet been approached in such a way. The SLR helped to highlight the most important papers, journals, authors and countries that have been studying behavioral finance with the experimental method nowadays. It can guide researchers in choosing the best and most relevant articles to cite, in finding which authors deal with their topics of interest, and were to look for guidance when needed.
Although this was a research with a large number of results, some limitations are found. For example, only articles published in English which belonged to Q1 and Q2 of the SJR were selected, ignoring the fact that relevant papers may have been published in other formats, such as books, theses or dissertations, or in other languages. The delimitation of the quartiles may also have eliminated interesting articles which have not been accepted in reputable journals. As suggestions for future research, the sample size can be increased, consulting other databases, considering a broader period of analysis, for example, from 1974 to 1990, 1991 to 2000, 2001 to 2010; besides adding the in-depth analysis as suggested by Tranfield et al. (2003).
Footnotes
Author’s Note
The author Wesley Vieira da Silva is a researcher on Productivity at the National Council for Scientific and Technological Development (CNPQ) - Level 1D.
Declaration of Conflicting Interests
The authors declared no potential conflicts of interest with respect to the research, authorship, and/or publication of this article.
Funding
The authors disclosed receipt of the following financial support for the research, authorship, and/or publication of this article: The authors would like to thank the Federal University of Santa Maria (UFSM) and the Coordination for the Improvement of Higher Education Personnel (CAPES) for the financial support given to this research.