
Abstract
Transportation infrastructure such as highways and bridges requires upgrades and maintenance. In many U.S. regions, these requirements have surpassed current funding, so new solutions are needed. One obvious though imperfect source is gasoline taxes, but raising these is politically risky, regardless of need. To illuminate this conflict, we analyze data from four random-sample telephone surveys (2016–2018, n = 2,035) that asked residents in the U.S. state of New Hampshire about their perceptions of highway and bridge conditions, and support for gas tax increases. About one third of the respondents counterfactually reported that highway and bridge conditions had improved compared with 10 or 20 years ago. At the county level, subjective perceptions correlate well with actual pavement and bridge conditions. Majorities of respondents also said they would support tax increases of 5 of 10 cents, although support falls off at higher amounts. Support for a tax increase varies not only with the proposed amount, but also with individual characteristics—especially political identity. In a structural equation model, infrastructure perceptions serve as an intervening variable between ideology and tax support: if infrastructure is falsely seen as improving, that supports an ideologically favored rejection of taxes. Partisan differences in perceptions of physical conditions, noted previously in other domains such as climate change, pose an unexpected challenge in building public support for transportation infrastructure.
Keywords
Introduction
In April 2017, the California legislature and governor approved a bill that increased the state gasoline tax by 12 cents per gallon, and raised the diesel fuel tax by an additional 20 cents per gallon, while introducing new vehicle fees as well. The bill was intended to increase revenue by 5.4 billion dollars annually for transportation projects such as road and bridge maintenance. One year later, however, a poll of registered voters found 51% favored repealing this tax increase, and only 38% favored keeping it. Governor Jerry Brown and others across the state argued in support of the tax, which would provide badly needed funds to make travel and commuting easier and safer throughout the state. Brown and his allies sought to frame the issue not only in terms of infrastructure and deteriorating roads, but as a way to help the economy (Dawid, 2018; McGreevy, 2018). Republican opponents of the gas tax introduced a ballot measure for repeal, and sought to use this issue to mobilize their voter base. In 2018, the repeal measure was defeated, by a vote of 57% to 43%. Political struggles over public support for infrastructure investments have also occurred in many other places around the country (Cates-Carney, 2018; Greenblatt, 2012; VanHulle, 2019). These struggles take on growing urgency as infrastructure elements age and their capacity decreases.
We know that in general, public opinion about taxes correlates with ideology (Agrawal & Nixon, 2013; Reuters, 2015). Rhetorically, opposition to taxes often is coupled with opposition to specific things the taxes might support, such as spending on social support programs. Maintaining transportation infrastructure such as highways and bridges, however, might seem less likely to evoke such opposition, because highways and bridges have importance across the political spectrum. As Governor Brown found, however, even support for infrastructure improvements divides people along ideological lines. The Public Policy Institute of California’s statewide survey reported that 63% of Democrats and only 33% of Republicans supported funding infrastructure projects (Baldassare et al., 2017). This ideological split in California raises the possibility that, rather than questioning the value of safe highways or bridges, it is possible that those ideologically opposed to funding might question instead the need for any maintenance. Carried to an extreme, ideology might constrain perceptions of material conditions, such that people with generally tax-averse ideologies are less inclined to acknowledge physical problems, and hence the need for taxes that might address them. In social-science terms, perceptions about infrastructure conditions could behave as an intervening or mediating variable, predicted from ideology as well as from objective conditions, but justifying and hence predicting in turn views about infrastructure-addressed taxes.
In this article, we test these propositions regarding infrastructure perceptions and reality using data from four statewide New Hampshire surveys conducted from 2016 to 2018. All four surveys, collectively more than 2,000 interviews, carried some common questions asking about perceptions of transportation infrastructure conditions, and subsequently, whether respondents would support a proposed gas tax “if the funds are needed to maintain New Hampshire highways and bridges.” Specific amounts suggested for the hypothetical gas tax varied randomly across interviews, from 5 to 40 cents per gallon. The surveys identify respondents by county, permitting comparison of infrastructure perceptions and tax support with objective assessments regarding the condition of local pavement and bridge infrastructure.
Objective conditions are assessed in regular reports by the American Society of Civil Engineers, the most recent of which awarded New Hampshire a “C minus” overall grade—indicating less than adequate conditions of the state’s transportation infrastructure quality that requires resource investment (New Hampshire American Society of Civil Engineers [NHASCE], 2017). Previous reports in 2006 and 2011 had awarded slightly higher overall grades of C, which suggests that conditions by 2017 had slightly worsened or, at best, failed to improve. From these assessments and the views of state officials (Staub, 2019), there seems to be little doubt that transportation infrastructure needs attention, and that without changes, revenue sources in the near future will not be adequate for this task. Majorities of our survey respondents recognized the static or deteriorating condition of state infrastructure, and said they would favor gas tax increases of 5 or 10 cents—although support dropped off for increases above 20 cents. A substantial minority, however, perceived infrastructure conditions as improving, and also rejected a gas tax. The complicating effects of political identity on infrastructure perceptions as well as policy views present a challenge to overcome in building public support for infrastructure investments. These effects also parallel recent finding in other areas, including public perceptions of weather and climate.
Background
Approximately 40% of U.S. bridges are more than 50 years old, and 9% are structurally deficient, according to the American Society of Civil Engineers (NHASCE, 2017). “Structural deficiency” indicates that a bridge’s structural capacity is reduced below the original design. Based on available resources and transportation network priority needs, some bridges and roadway are repaired or replaced while others continue to deteriorate based on age and use. Infrastructure elements often remain in service well beyond the intended design life. U.S. highways and roads face similar challenges. Twenty-one percent are considered to be in poor condition, and funding has been in decline since 2003. To address these deficiencies, an estimated US$120 billion investment over the next 15 years is required (American Society of Civil Engineers [ASCE], 2013).
In 2017, the United States averaged a “D plus” grade for infrastructure nationwide (ASCE, 2017). There are state-to-state variations of course, but infrastructure in New Hampshire is not much above average; the 2017 report gave the state a C minus for infrastructure overall, developed from analysis of aviation, dams, bridges, drinking water, hazardous waste, energy, ports, rail transport, solid waste, roads, storm water, and wastewater. Bridges and roads each separately earned C minus grades as well, due to declining structural condition due to harsh environmental and traffic demands and limited resources for maintenance and rehabilitation. Part of the reason for this is that almost 13% of bridges in New Hampshire had been red listed by 2015. These bridges have functional restrictions such as weight limits and require more frequent inspections. Less than half the highways and roads were reported to be in “good” condition; 29% were rated “poor” or “very poor” (NHASCE, 2017). While letter grades may seem abstract, a national research group estimated that these conditions cost drivers approximately $397 per motor vehicle annually in additional maintenance and repairs (TRIP, 2018).
New Hampshire Roads and Bridges
As the condition of infrastructure such as roads and bridges deteriorates, it becomes increasingly costly to fix. The ASCE (2017) estimates that to bring New Hampshire’s current infrastructure up to “fit for the future” standards would cost approximately 16 million additional dollars per year to hit the miles needed to ultimately keep up with repairs. This estimate is based solely on the 2018 estimate for road investment which means it is likely a conservative estimate for years following. Replacing the bridges in New Hampshire, many of which are structurally deficient, would cost approximately $8 billion that the state does not have. How might such maintenance be funded New Hampshire?
Our survey questions focus on a system currently in place to fund infrastructure, the gasoline tax. New Hampshire sales in 2018 amounted to approximately 84 trillion Btu of motor gasoline which, at 120,333 Btu/gallon is approximately 698,062,875.5 gallons (U.S. Energy Information Administration, 2019). In one way, this is good news, as an extra $0.05 tax per gallon could bring in an additional 34,903,143.8 dollars per year, based on those 2017 sales. That money would go a long way to addressing needed repairs and improvements given the ASCE estimates of an additional 16 million dollars needed per year for roads. However, gas taxes are not an “ideal user fee,” having been constructed as a proxy for highway use before car efficiency dramatically improved and travel mileage increased. Car efficiency and increases in travel have resulted in less tax being collected for more miles traveled. This has led many to call the gas tax “regressive.” Moreover, even a large increase in the tax, possibly a dollar per gallon, would not be enough to make up the needs for infrastructure maintenance (Duncan et al., 2017; Herzig, 2018; Mathur & Kallen, 2018; Povich, 2014). Even if a small increase in the gas tax today would help bolster the infrastructure funds for the next few years, the overall trend of increased fuel efficiency and miles traveled could make the funds obsolete at some point in the future.
One alternative to increasing the gas tax is a mileage-based fee. Proponents of a per-mile fee argue that it is superior as a direct user fee, like utilities, is sustainable for the future as it is not dependent on the energy source used, can be tailored to costs and funds needed easily, increases fairness, is transparent regarding funding source and use, ensures ongoing maintenance and expansion as needed, finances instead of funds infrastructure, and could reduce traffic congestion (Poole & Moore, 2014). Research has found that those who use the roads most are less likely to support a fee based on miles traveled and that this opposition is stronger in intensity than support for the fee, indicating an uphill battle for anyone trying to pass such an alternative to gas taxes. Contrary to prior research (Duncan et al., 2017), our surveys did not find significant partisan differences in opinions on per-mile fees. Despite considerable opposition, the lack of partisan divisions on the issue could be a hopeful sign in terms of convincing voters to change the whole system rather than just increasing the gas tax.
Increasing the Gas Tax
Gasoline taxes were initially introduced to meet the financial need for expanding roads, bridges, and highways required when automobiles became popular and affordable and the previously used property tax was not enough. In the early 1900s, states began using the gasoline tax to fund infrastructure projects, which made up about one quarter of all state expenditures by 1927 (Weingroff, 2005). Gas taxes were subsequently raised to keep up with inflation and maintenance costs but stagnated by the end of the century. The last federal increase occurred in 1993 leading some states to address shortfalls in funding by increasing their own taxes (Weingroff, 2005).
New Hampshire followed this pattern, holding its state gas tax steady at 19.6 cents per gallon from 1999 to 2015, and then raising it to 23.8 cents per gallon (New Hampshire Department of Transportation, 2018). In the meantime, however, vehicles have become more fuel efficient. Although efficiency benefits the environment and saves consumers money, it can negatively impact gas tax revenues. Drivers can travel further, putting more wear and tear on the roads, while paying the state less (Poole & Moore, 2014). As a result, infrastructure deteriorates faster, but there is less money to repair and maintain it.
Surveys find that while most people have strong opinions about gas taxes, they often have no idea how much they currently pay. A 2017 study found that only 23% of New Hampshire respondents knew the approximate amount of gas taxes in that state (about 40 cents per gallon included state and federal tax). The rest made wild guesses (30% guessing 20 cents or less; 25% guessing 60 cents or more), and 22% admitted they did not know (Fogg et al., 2017). Similarly, California and Michigan surveys found that people often overestimated what they paid in tax (Fisher & Wassmer, 2017). Moreover, those who overestimated the current tax were less likely to support a tax increase. The authors suggested that arguments for raising taxes should begin by informing voters about what tax is currently in place. As raising taxes is rarely popular, understanding how best to communicate about their necessity is important.
Although raising taxes is not generally a popular subject, research has shown that it matters a great deal how it is framed by politicians or researchers. One national poll found that when a 10-cent gas tax increase was proposed specifically to fund road maintenance, it was supported by 72% of respondents. The same tax increase when proposed to reduce accidents and improve safety, only received support from 66% of respondents. The survey overall showed that the majority of people want good public transportation services and are willing to fund it (Agrawal & Nixon, 2018). The drop-off in support when proposed for more general transportation work, including safety improvements, indicates that people do not want to pay for issues they may not be able to identify, or for problems that might arise in the future.
The same national survey found a substantial difference in tax increase support by political party affiliation; the party-line gap had widened by seven points since their own study 5 years before (Agrawal & Nixon, 2013). Democrats were much more supportive of a gas tax increase compared with other groups, and Republicans much less. On average, Democrats supported increasing the gas tax by 22 points more than Republicans, with groups other than Republican and Democrat somewhere in between. Only when the increase was proposed for safety improvements or to maintain existing infrastructure was there majority support among Republicans (Agrawal & Nixon, 2018). The Agrawal and Nixon study finds support for infrastructure funding across the political spectrum—for some purposes (basic maintenance or safety improvements) but not for others (e.g., general system improvements). In contrast, the Fisher and Wassmer (2017) study previously discussed in relation to knowledge of the gas tax also explored how support for the Tea Party impacted willingness to pay for gas tax increases. They found, not surprisingly, that those who supported the Tea Party were much less likely to support any tax increase for road improvement. While Agrawal and Nixon (2018) found that framing of taxation for improvements of road safety and maintenance garnered support across political lines, Fisher and Wassmer’s (2017) study indicates that support for taxes for more general improvements to roads follows expected political ideologies.
Historically, the U.S. public has broadly supported infrastructure maintenance in principle. Reuters polling found that 68% of respondents supported spending federal funds to improve roads, bridges, and railroads. This 68% includes 78% of Democrats and 59% of Republicans (Reuters, 2015). Much lower percentages from either party agreed on a more specific question asking about a 25-cent tax increase to fund ambiguous “infrastructure improvements.” Although infrastructure has, in the past, been a relatively nonpartisan issue, proposals to raise taxes or spend government money encounter predictable patterns of political division and opposition. U.S. partisan divisions have been deepening on many issues, likely affecting infrastructure topics as well.
Political identity often dominates among predictors of how people respond to infrastructure spending questions, but it is not the only factor. For example, the higher a person’s expectations about roads, the less satisfaction they express (Poister & Thomas, 2011). In addition, the purpose of the trip, prior driving experience, the road conditions when dry, and the familiarity with the roads all influence driver perceptions of road roughness. Older drivers and less frequent drivers perceive more road roughness than others (Tehrani et al., 2015). Infrastructure spending, despite being fundamental to a functional transportation system, clearly has a lot of variability in support. There is no one clear solution to the problems the United States is facing nor is there a clear method of gaining support for potential solutions. This article will explore how the public’s perceptions of road conditions and support for taxation for infrastructure are impacted by political ideology and awareness of current infrastructure conditions. We begin by asking residents what they know about current infrastructure conditions and funding sources, and later explore the demographics that impact this answer, in particular how political ideology affects knowledge of conditions and support for require maintenance funding.
Data and Methods
Work described in this article is supported and funded by the Living Bridge: The Future of Smart, User-Centered Transportation Infrastructure project. This project uses sensors and renewable energy (tidal power generation) in a practical demonstration of sustainable, user-centered technology applied to transportation infrastructure. Bridges provide fundamental transportation services to society but are often taken for granted. When bridges capture public attention, it is often because they have become extremely costly to replace, or in worst case scenarios, collapsed. The Living Bridge project has converted a steel truss bridge into a self-diagnosing “smart bridge” which reports on its own structural conditions in real time. The focus of the Living Bridge Project is the Memorial Bridge, a vertical lift bridge which spans the Piscataqua River, connecting Portsmouth, New Hampshire and Kittery, Maine. The Piscataqua River provides tidal energy which can potentially power the smart bridge technology. In future years, survey questions will explore public awareness and views related to this project. For baseline data, project-related survey questions to date assessed more general views about the state’s transportation infrastructure. To this end, we placed questions on four statewide New Hampshire telephone surveys between 2016 and 2018. Objective evaluations of infrastructure conditions were subsequently integrated with these survey data.
Granite State Poll
The Granite State Poll (GSP), carried out by the Survey Center at the University of New Hampshire, is an omnibus survey that conducts cell and landline telephone interviews with random samples of New Hampshire residents approximately four times each year. These high-quality surveys have been used in many peer-reviewed studies of topics such as voting behavior (Scala & Smith, 2007), public trust in scientists (Hamilton et al., 2015), and perceptions about natural disasters (Hamilton, Wake, et al., 2016). Direct comparisons between results from the Granite State Poll and nationwide surveys, where both asked the same environment or science-related questions, often find close agreement (e.g., Hamilton et al., 2019; Hamilton, Wake, et al., 2016). To assess New Hampshire public views about the state’s transportation infrastructure, we placed sets of questions on four iterations of the GSP (February and July 2016, May 2017, and August 2018), totaling more than 2,000 interviews. Response rates for these four iterations averaged 17%, calculated by the American Association of Public Opinion Research definition 4 (Smith, 2016). Probability weights, based on standard formulas, allow adjustments to compensate for design bias regarding household size and number of telephones, and also so that results better represent the state population with regard to age, sex, and region. Substantive effects of this weighting, applied to all analyses in this article, tend to be relatively small. For example, the statewide percentage reporting that infrastructure conditions have improved is 32 with weighting (Table 1), and 30 without; the former should better represent the state’s population.
Variable Definitions, With Codes Used for Modeling and Weighted Summary Statistics (n = 2,035).

Some preliminary results from the first waves of these surveys, in 2016 and 2017, are summarized in Fogg et al. (2017). Hamilton, Bell, et al. (2018) and Hamilton et al. (2019) track responses to a renewable energy across many GSP waves, placing these New Hampshire results alongside those from nationwide and other regional surveys. In this article, we conduct a more detailed analysis incorporating a full set of New Hampshire transportation responses, 2016–2018, and integrate those survey data with objective indicators for county-level infrastructure conditions.
Survey Questions on Infrastructure
Table 1 gives the wording of survey questions, and definitions of other variables analyzed for this article. The questions include several related to infrastructure, along with respondent background characteristics (age, sex, education, and ideology) known to predict responses across a variety of issues, including infrastructure and taxes.
The first infrastructure question (infbetter) simply asked respondents whether they thought condition of the state’s highway, bridge, and transportation infrastructure today is better, worse, or about the same as it was 10 or 20 years ago. Recent engineering assessments suggest that conditions have not much improved, indeed may have worsened, over the past decade (NHASCE, 2017). Almost one third of our respondents, however, said that conditions now are better (Figure 1A).

Responses to questions about transportation infrastructure conditions (infbetter, A), and support for a gas tax increase (taxyes) as a function of the randomly varied increase amount (taxamt, B). (A) Condition of state transportation infrastructure compared with 10 or 20 years ago? and (B) Support gas tax increase of X amount if needed to maintain?
Another question asked respondents whether they would support increasing the gas tax by an additional [5, 10, 30, 30 or 40] cents per gallon, specifically “if the funds are needed to maintain New Hampshire highways and bridges.” The amount specified varied randomly across interviews, so roughly one fifth of respondents heard 5 cents, one fifth heard 10 cents, and so forth. Variable taxamt records the amount specified in a particular interview. Variable taxyes indicates whether the respondent said yes, they would support an increase of that amount. As graphed in Figure 1B, majorities said they would support increases of 5 of 10 cents. Support drops off for tax increases of 20 cents or more.
Our subsequent analysis views taxyes, support for a gas tax increase, as an endogenous variable possibly predicted by infrastructure perceptions (infbetter, also endogenous), the exogenous tax amount (taxamt), respondent background characteristics (age, sex, education, ideology), survey timing (date), and an indicator for actual road conditions in respondent’s county (condition).
Indicators of Transportation Infrastructure Conditions
The survey question infbetter records subjective impressions. For objective indicators of transportation infrastructure conditions, we consulted data from NHASCE (2017). These reports include annual estimates of the percentage of pavement in good, fair, or poor condition within each of the 10 New Hampshire counties. Figure 2A plots the percent of survey respondents from each county (pooled over 2016–2018 surveys) reporting that transportation infrastructure conditions are better now, versus the percentage of pavement in that county objectively rated as poor condition (averaged over 2015–2017 engineers’ reports). We see a significant negative correlation (r = −0.81): survey reports of better conditions are less common in counties with a higher percentage of pavement in poor condition.

Survey percent reporting that “infrastructure conditions are better now” vs. percent of pavement rated poor condition in 10 NH counties (A), or overall bridge condition rating (B).
Figure 2B presents a similar plot of survey percentages versus overall ratings of bridge superstructure, substructure, and decks in each county. For this graph too, the survey data are pooled over 2016–2018, and engineers’ reports averaged over 2015–2017. The correlation in Figure 2B is strong and positive (r = +0.85): survey percentages reporting that infrastructure is better tended to be higher in counties where bridges are in better condition.
The Figure 2 plots provide unusual support for the validity of survey methods and results. Although the survey question (have state infrastructure conditions improved) does not exactly map onto the objective measures (recent conditions in each county), recent county conditions appear to substantially inform surveyed perceptions of the state. For these county-level graphs the time dimension is necessarily flattened; our survey data are not dense enough to calculate good estimates for each county in each year. For the individual-level modeling later in this article, however, we unfold timing to better match objective measures by linking survey data from each year with objective conditions over the previous 2 years. Given the degree of collinearity between pavement and bridge measures, it made sense to combine these into a single condition indicator as described in Table 1.
Results
In this section, we focus on the counterfactual perception that state transportation infrastructure has improved. (Focusing alternatively on the more accurate perception that conditions have stayed the same or worsened yields mirror-image but substantively similar results.) We start by asking who thinks that infrastructure has improved. Next, we analyze this infrastructure perception alongside other variables, including objective conditions, as possible predictors of support for gas tax increase to maintain highways and bridges.
Who Thinks Infrastructure Conditions Are Better?
Figure 2 established that aggregated survey perceptions correlate with actual infrastructure conditions, as one might hope. But what else, besides objective conditions, affects individual-level perceptions? Figure 3 charts the percentage of respondents who counterfactually think infrastructure conditions are better, broken down by individual characteristics. We see little variation by respondent sex or by date of survey (Panels 3b and 3f). Younger respondents and those less education, however, are significantly more likely to say that infrastructure conditions have improved (Panels 3a and 3c). Conversely, older and better-educated respondents, who take a dimmer view of infrastructure conditions, might be more observant of current problems, or have longer recollections of the past. Respondents 65 and older are particularly unlikely to think that infrastructure has improved, a pattern consistent with the effect of age on perceptions of road roughness reported by Tehrani et al. (2015).

Percentage who (counterfactually) say transportation infrastructure is better now, broken down by respondent characteristics and survey date.
Significant political gradients stand out in Figure 3. The most conservative respondents are more likely than any other subgroup to say that infrastructure conditions are better now (Panel 3d). Republicans and Tea Party supporters likewise are disproportionately inclined toward this view (Panel 3e). If conditions have improved then new taxes are not needed; these results raise the possibility that infrastructure perceptions are influenced by a need to justify more basic political opposition to taxes. If so, infrastructure perceptions present a new instance of the social-psychological phenomena called solution aversion: rejecting the reality of a problem, because one does not like the associated solutions (Campbell & Kay, 2014).
The political gradients in Figure 3 are striking enough to raise a question about Figure 2: might the correlations between aggregate perceptions and objective conditions appear different if we disaggregated by political parties? Further analysis confirms that this is indeed the case. Using data from Democrat or Independent respondents only, the county-level correlations between surveyed perceptions and objective conditions remain substantial, with appropriate signs: –0.62 regarding pavement, and +0.84 regarding bridges (corresponding to Figure 2A and 2B). Repeating this calculation using data from Republican or Tea Party respondents only, the subjective/objective correlations are far weaker: –0.26 for pavement, and +0.21 for bridges. Some weakening of correlations across the board can be expected due to smaller partisan subsamples (hence greater sampling variability, or less precision), but these sizable partisan differences in subjective/objective correlations deserve focused study in future research.
Structural Equation Modeling: Predictors of Infrastructure and Tax Views
The analyses of Figure 2 established that aggregated response percentages for whether infrastructure has improved strongly correlate with objective infrastructure conditions in the respondent’s own county. Figure 3 shows that infrastructure responses also correlate with respondents’ personal characteristics, and particularly with their age, education, and political identification. Do these respondent background effects hold regardless of objective conditions, or might they be partly spurious? Could infrastructure perceptions plausibly represent an intervening variable between individuals’ political identity and their support for a gas tax, demonstrating solution aversion? Multivariate analysis allows us to test this.
Figure 4 organizes propositions outlined previously into a path diagram, in which respondent characteristics (age, sex, education, ideology)—and also the objectively-assessed conditions of roads and bridges—could affect subjective perceptions of whether infrastructure conditions have improved. Those perceptions, along with respondent characteristics, could in turn affect whether respondents support increasing the gas tax to maintain state highways and bridges. The amount of a gas tax increase proposed, which we varied experimentally across interviews, also affects whether people support it. Solid lines in this diagram represent statistically significant positive effects (p < .05), and dashed lines negative effects, as tested in Table 2. That analysis tests all of the logically possible effects, but lines corresponding to nonsignificant effects are omitted to keep Figure 4 readable. Because the proposed tax amount (5–40 cents per gallon) is an experimental treatment, it is unrelated to any respondent characteristics.

Structural equation model for supporting a gas tax increase.
Predictors of Perception That State Transportation Infrastructure Is in Better Condition Now, Compared With 10 or 20 Years Ago; and of Support for a Gas Tax (of Variable Amount) if Needed to Maintain Highways and Bridges.
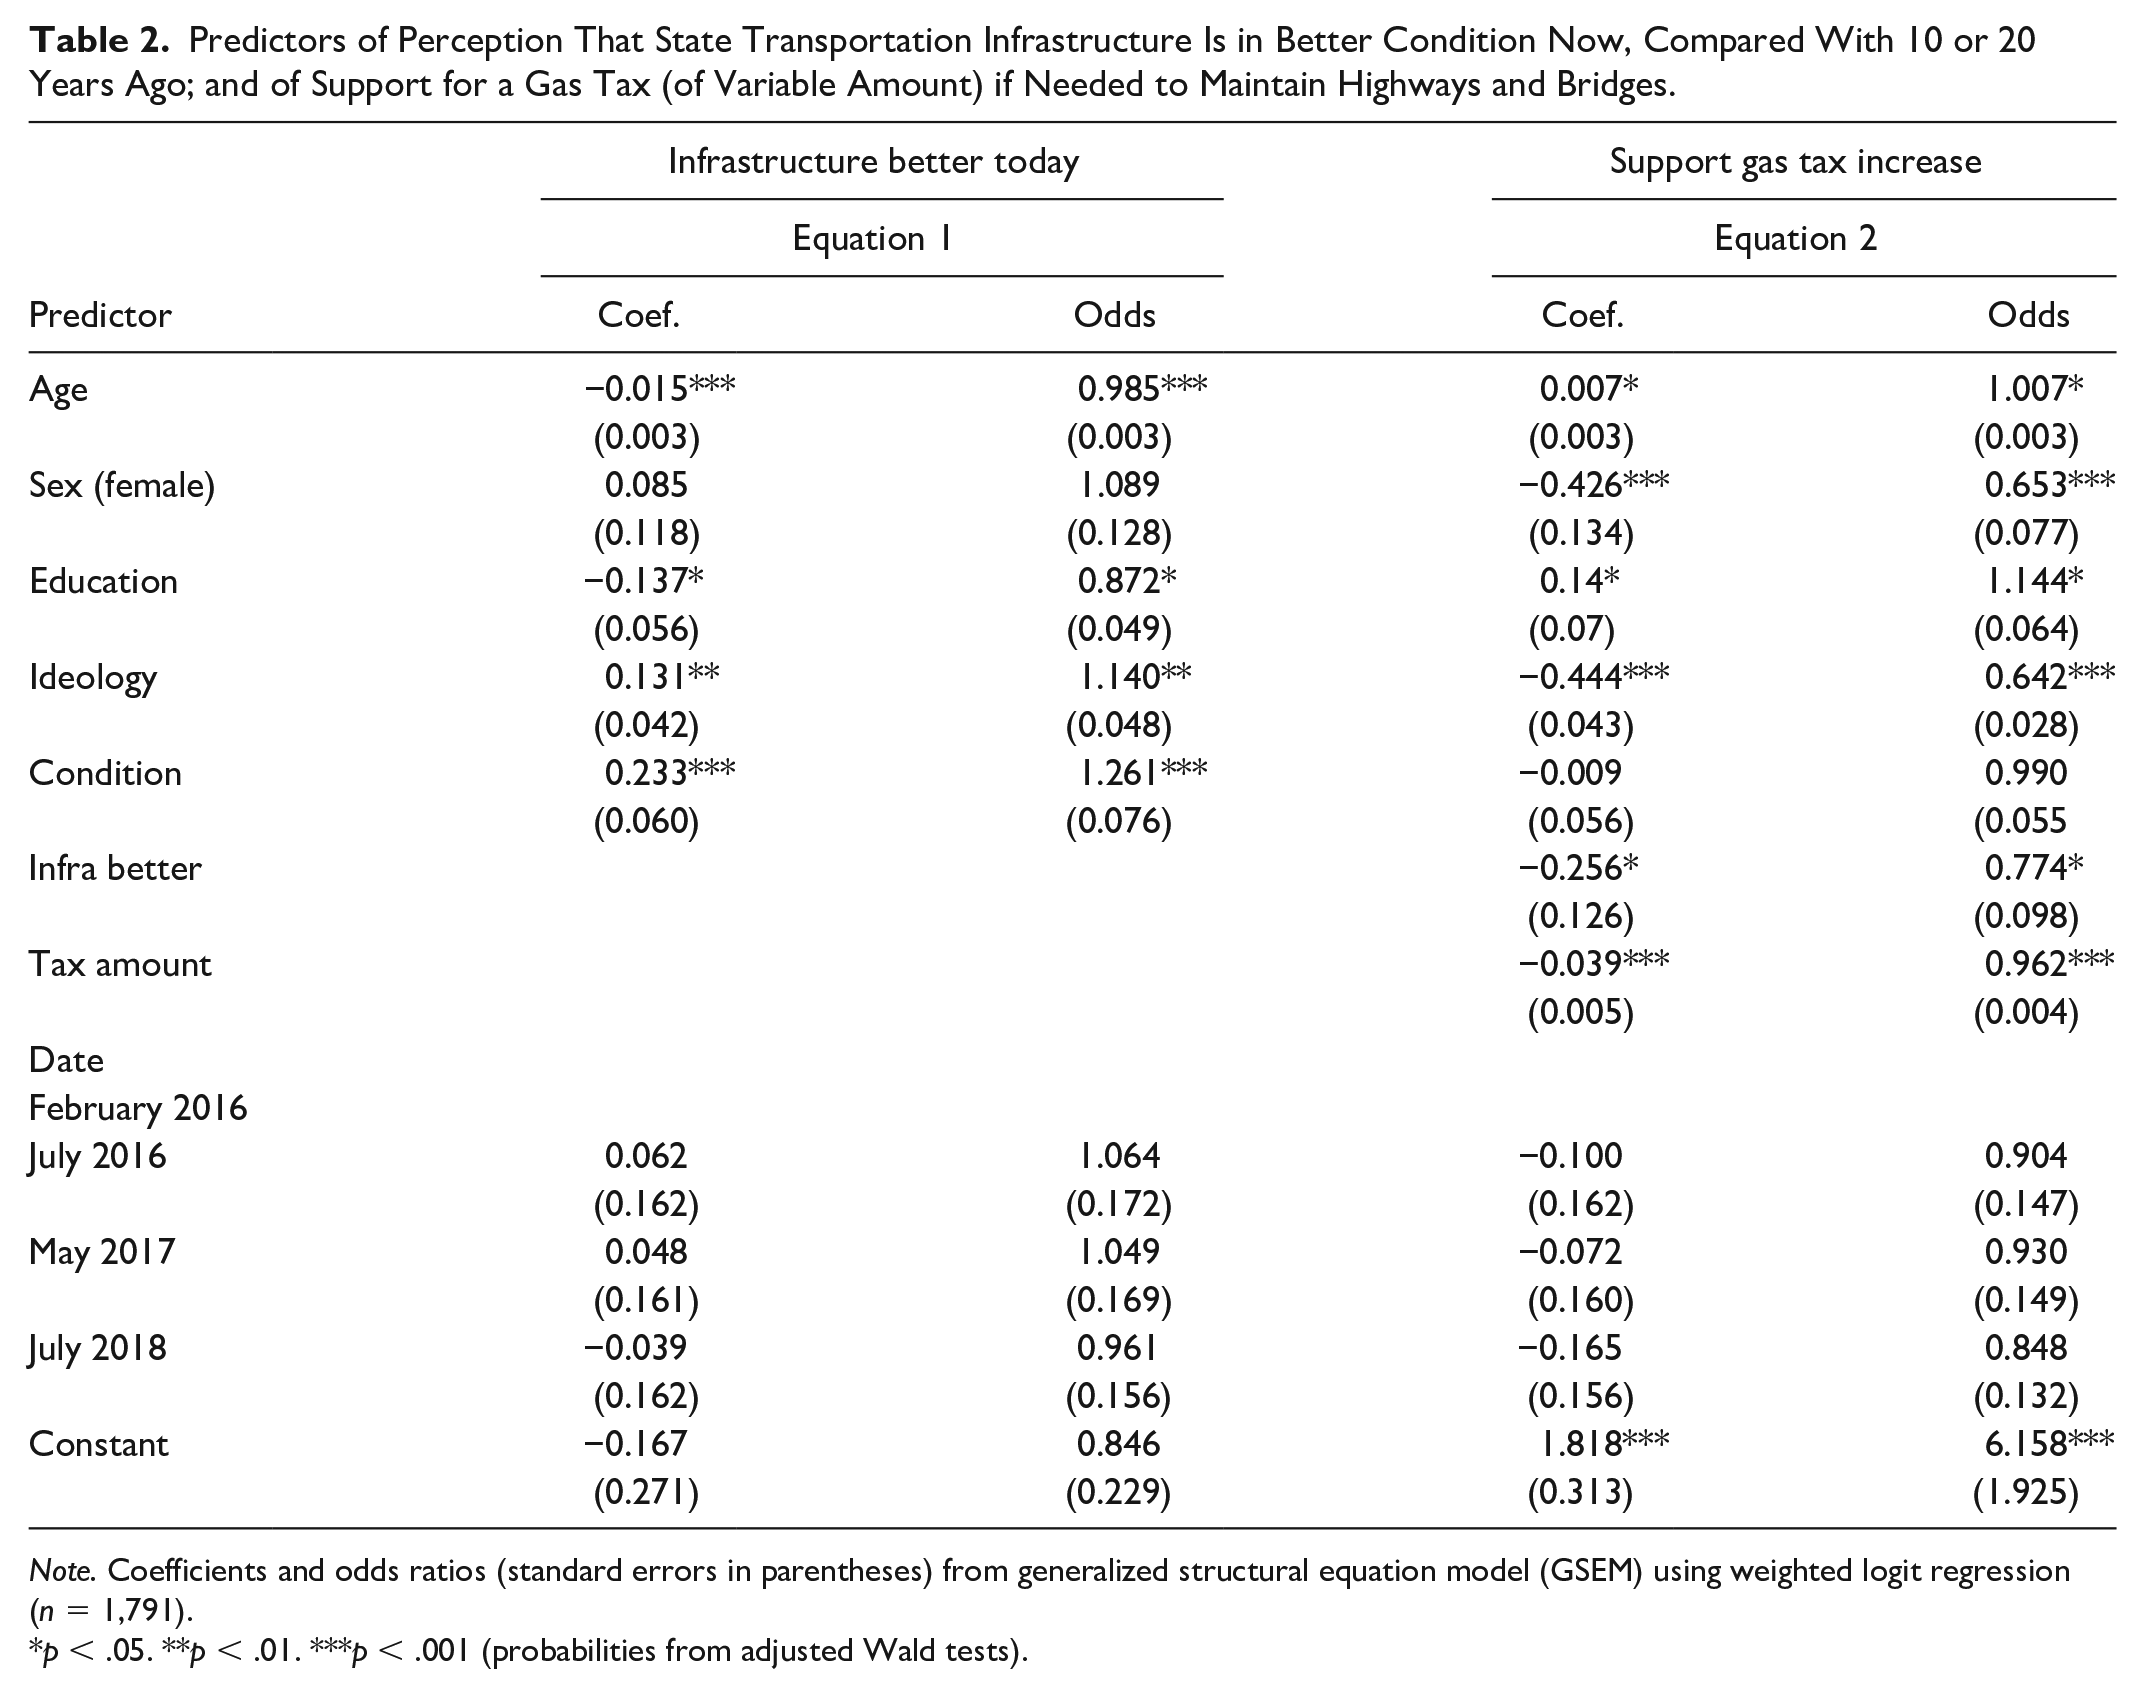
Note. Coefficients and odds ratios (standard errors in parentheses) from generalized structural equation model (GSEM) using weighted logit regression (n = 1,791).
p < .05. **p < .01. ***p < .001 (probabilities from adjusted Wald tests).
Parameter estimates and tests behind Figure 4 were obtained from the generalized structural equation model (GSEM) summarized in Table 2. GSEM extends the familiar multi-equation methods of structural equation modeling (SEM) by incorporating generalized linear modeling to relax the restriction to linear models. Generalized linear modeling allows for nonlinear forms such as the probability-weighted logistic regression (logit link function, Bernoulli distribution family) employed here to accommodate survey data and categorical endogenous variables. The GSEM model with two equations in Table 2 was estimated in one step using the gsem procedure of Stata v.16 (StataCorp, 2019).
The two left-hand columns in Table 2 report logit coefficients (linear effects on log odds) and odds ratios (multiplicative effects on odds), predicting the response that infrastructure is better now, that is, infbetter = 1. Other things being equal, the odds of saying that state highway, bridge, and transportation infrastructure have improved are significantly higher among younger, less educated, and more conservative respondents. For example, these odds decrease by 14% (are multiplied by 0.98510 = 0.860) with each 10 years of age, and decrease by 13% (multiplied by 0.872) with each level of education. Similarly, odds of saying infrastructure conditions are better are 69% higher (multiplied by 1.1404 = 1.689) among conservatives (ideology = 5) than they are among liberals (ideology = 1). Optimistic reports also are more common among respondents who live in counties with better road and bridge conditions. (Because the condition variable is a principal component score, standardized to zero mean and unit variance, its regression coefficients represent the impacts of a one standard deviation improvement in road and bridge conditions.) We see no significant differences between the infrastructure perceptions of men and women, or across the various dates of these surveys. These GSEM results are substantively consistent with bivariate findings in Figures 2 and 3; the significant effects seen earlier are not spurious.
The two right-hand columns in Table 2 give coefficients and odds ratios for a respondent saying that he or she would support increasing the gas tax if the funds are needed to maintain New Hampshire highways and bridges. Other things being equal, the odds of supporting a tax increase to maintain infrastructure are 23% lower (multiplied by 0.774) among people who think that conditions are better now. As we saw earlier, the “infrastructure better” responses themselves are influenced by ideology. Ideology has its own strong effect on tax support: Odds are 83% lower (multiplied by 0.6324 = 0.170) among conservatives than among liberals. Thus, ideology affects support for a gas both directly (conservatives oppose tax) and indirectly, as conservatives perceive infrastructure as better so there is no need for a tax. Education, age, and objective conditions likewise have indirect effects, which can be traced as sequences of arrows in Figure 4.
Other things being equal, support for a gas tax declines with conservatism but rises with age. It also rises with education, and is higher among men than women. Tax support within any subgroup is contingent, of course, on the amount of increase proposed. Survey interviewers proposed randomly varied amounts from 5 to 40 cents per gallon, which prove to strongly affect responses. Figure 5 visualizes four of these contingent relationships in terms of probabilities, using adjusted margins plots calculated from the GSEM of Table 2. A line has been added at 50% to more clearly indicate where there is majority support for a tax increase. The dominating effect of respondent ideology—numerically stronger than the effect of tax amount itself—stands out in Figure 5C. Respondent sex, education, and infrastructure perceptions, which likewise have statistically significant effects, produce visibly less spread in tax views.

Effects of sex, education, ideology, and infrastructure perceptions on support for increasing the gas tax by X amount.
Two further exogenous variables, political party and household income, were tested in similar models but omitted from the final analysis in Table 2. Political party overlaps substantially with ideology, providing similar information, but shared variance raises collinearity and interpretive problems if both variables are included. Using party alone yields substantially the same conclusions as using ideology alone. Household income seems plausibly relevant to tax support, but its effect proves not significant. Placing this nonsignificant predictor in the model comes at a high cost: more than 400 observations lost because of missing values on income, making the sample less representative as well as smaller. Finally, we also tested for ideology × condition (or party × condition) interaction effects, as suggested by the partisan county-level results mentioned in the section “Who Thinks Infrastructure Conditions Are Better?” In this individual-level analysis, neither interaction proved significant.
Robustness of Findings
In the course of analysis, researchers face many choices among plausible alternatives for treatment of data and statistical methods. This process can, sometimes unwittingly, be guided by what yields the most pleasing results—leading down a “garden of forking paths” that ends with appealing but nonrobust and possibly unreplicable conclusions (Gelman & Loken, 2014). In this article, we sought choices that made the most substantive sense, while also being relatively parsimonious, interpretable, and comparable to other studies. A crucial step, however, is to test whether the resulting conclusions are robust across other plausible choices. This section describes three such tests.
Own County Versus Own and Adjacent
Engineer-assessed pavement and bridge conditions in respondents’ county of resident correlate strongly with county-level survey perceptions (Figure 2). An interview-timing appropriate composite derived from these relatively objective assessments significantly predicts individual-level subjective perceptions as well (condition, Table 2). Defining the objective indicators from respondents’ own county is inevitably imprecise, however, as some people live near borders or travel frequently through neighboring counties. To test whether geographically broadened regions might be more relevant, we calculated an alternative version of the infrastructure condition variable averaging conditions in respondent’s own county with all adjacent counties, using the same time windows for both. The combined own/adjacent county conditions exhibit a weaker county-level correlation with “infrastructure better” perceptions (r = 0.40, compared with r = 0.91 for own-county condition); and an individual-level logit model using own/adjacent county conditions finds no detectable effect on infrastructure perceptions (p = .543, compared with p < .001 for own-county condition). These statistical results support our conclusion that local conditions affect more general perceptions. Substantively, although some people near borders might be more familiar with a neighboring county, they might also have less experience of adjacent counties in opposite directions, making the own/adjacent average a less appropriate indicator for them as well as for those who mainly commute within their home county. Given such practical complications, our findings that own-county pavement and bridge conditions strongly correlate with aggregate surveyed perceptions at the county level, and that own-county conditions significantly affect individual-level perceptions even controlling for age, sex, education, and ideology, remain noteworthy. Future studies with more geographically specific designs could refine these results.
Ordinal Versus Categorical Predictors
Our education and ideology variables have intrinsically ordinal scales, from 1 (high school or less) to 4 (postgraduate work) for education, and from 1 (extremely or fairly liberal) to 5 (extremely or fairly conservative) for ideology (Table 1). Because they are not actual measurements, analysts might choose to incorporate such predictors into regression models either as ordered scales with approximately linear effects, or alternatively treat them as unordered categories represented by sets of dummy variables. To evaluate both choices, we estimated two versions of the models in Table 2, with the predictors in ordinal versus dummy-variable form. Conclusions remain substantially the same either way: “infrastructure better” perceptions rise with conservatism and decline with education; the reverse holds for supporting a gas tax. There are five additional parameters in each dummy-variable equation, without much improvement in fit. Coefficients on each set of dummies follow a monotonic progression in the tax equation, and monotonic apart from two level steps for the infrastructure-better equation. Consequently, the ordinal approach seen in Table 2 provides a statistically reasonable and parsimonious description, while retaining comparability to specifications used in many other studies. For examples using different dependent variables and New Hampshire survey datasets that demonstrate monotonic, roughly linear effects from education and ideology, see Hamilton et al. (2015; 2016); Hamilton, Hartter, et al. (2016); Hamilton, Wake, et al. (2016).
Binary Versus Ordinal Infrastructure Perceptions
Our survey question on gas tax (Table 1) is binary: Would you support an increase of X cents per gallon, or not? The question on infrastructure perceptions, however, gives three ordinal choices: Do you think that transportation infrastructure conditions became better, stayed about the same, or worsened? For modeling in Table 2 we recoded responses in binary form, 1 for counterfactual perceptions that conditions are better, and 0 for same, worse or don’t know. This permits straightforward interpretation in terms of counterfactual perceptions, but an obvious alternative would be to retain ordinal coding with three levels for this variable, while setting aside the don’t-knows. We tested this using weighted ordered logit regression, an ordinal counterpart to the binary logit in Table 2. An ordered-logit model estimates three additional parameters and requires a more abstract interpretation of odds in relation to cut points within a hypothetical continuous distribution. The ordered model also makes use of less data, omitting respondents who answered “don’t know.” In substantive terms, however, its main conclusions remain the same: the favorability of infrastructure perceptions is higher among more conservative respondents, as well as those living in counties with objectively better conditions. On secondary points, both models agree that favorability of perceptions is lower among older and better-educated respondents. One point of disagreement is that sex exhibits a significant negative effect in the ordered but not the binary model, partly because more women than men are dropped if we set aside “don’t know” responses.
Discussion
Survey-assessed perceptions of transportation infrastructure conditions correlate strongly with objective county-level assessments (|r| > .8, Figure 2). Survey researchers generally hope that such things are the case, but rarely find evidence so clear. Consequently, this seemingly obvious discovery stands out as a notable result from our study. Two complications are worth noting. First, this correlation occurs despite a mismatch of both temporal and spatial scales: Recent conditions in the respondent’s own county predict survey perceptions of statewide decadal trends. Second, we see a partisan pattern in county-level correlations between perceptions and objective indicators of infrastructure conditions: These correlations are consistently stronger when based only on Democrat/Independent survey respondents, than they are when based only on Republican/Tea Party respondents.
Facing budget constraints, transportation infrastructure conditions in New Hampshire have not improved in recent years; by some indicators, conditions have worsened. Almost one third of the respondents to our statewide surveys nevertheless perceived improvement (Figure 1). “Improvement” responses were least common among older or college-educated respondents. Older respondents in particular might have longer personal time frames to make a more accurate comparison; previous work also suggests this group tends to be more sensitive to bad road conditions (Tehrani et al., 2015). Other things being equal, women were less likely (35% lower odds) to support a tax increase. This sex difference was not expected theoretically, but it occurs on all four of our surveys and is consistent with previous research (Reuters, 2015).
Consistent with solution aversion theory, respondent ideology proves to be one of the strongest predictors of infrastructure perceptions—second only to the effects of actual conditions. Forty percent of conservative respondents, compared with 32% of moderates and 28% of liberals, expressed the counterfactual view that conditions have improved. Similarly, 38% of Tea Party supporters expressed this view, compared with 29% of Democrats or Independents (Figure 3). These strong ideological effects, along with weaker but still significant age and education effects, are independent of actual road conditions (Table 2 and Figure 5). Ideological constraints on infrastructure perceptions unexpectedly echo recent findings about weather conditions. Our findings suggest that infrastructure perceptions (seemingly physical and mundane) stand in relation to opinions about taxes (sharply politicized by conservatives) much as weather perceptions stand in relation to opinions about climate change (Borick & Rabe, 2017; Hamilton. Hartter, et al., 2016; Hamilton, Lemcke-Stampone, & Grimm, 2018; Howe & Leiserowitz, 2013; Myers et al., 2013; Shao, 2017).
We asked directly whether people would support increasing the state’s gas tax (by an experimentally varied amount) “if the funds are needed to maintain New Hampshire highways and bridges.” Unsurprisingly, the tax amount itself turns out to be a strong predictor of gas tax support—but not as strong as respondent ideology. The most conservative respondents opposed tax increases of any amount to maintain highways and bridges; moderate conservatives agreed to at least a small increase, while moderates, moderate liberals, and liberals said they were willing to pay more (Figure 5). Based on solution aversion theory, and consistent with the order of these two questions in interviews (infbetter asked before taxyes), we tested infrastructure perceptions as an intervening variable. Conservatives more often said infrastructure is improving, and if infrastructure is improving there is less need for taxes. Structural equation modeling (Table 2) confirms the significance of both steps. Unlike ideology and subjective perceptions, and contrary to what one might hope, objective infrastructure conditions do not directly affect support for a gas tax.
Conclusion
These results highlight a difficult reality facing U.S. policymakers and professionals today. Pervasive ideological divisions impede action on a wide range of issues. These now extend well beyond historical conflicts between interest groups, or on traditionally politicized topics. In our data, such divisions even influence perceptions about the condition of local roads and bridges. Acknowledging bad conditions would imply a need to spend government money on maintenance, so opposition to taxes becomes a motive not to acknowledge real problems.
We found that self-identified conservatives are more likely to say that infrastructure conditions have improved. This view runs counter to objective assessments of state road and bridge conditions made by transportation engineers, but under solution aversion, it does have logical consistency with conservative opposition to increasing taxes “if needed to maintain highways and bridges.” Conservatives in the United States overwhelmingly believe that the government is inefficient. According to the Pew Research Center (2017), 69% of conservatives in the United States believe that the government is “almost always wasteful and inefficient.” Conservatives are also less likely than liberals to believe that their taxes are fair. A Gallup poll found that only 46% of Republicans surveyed believed their income taxes were fair while 69% of Democrats said the same. Similarly, 57% of Republicans believed their taxes were too high compared with only 37% of Democrats (Riffkin, 2014). Our own findings fit into this broader picture, while adding details about ideological effects on infrastructure perceptions, regardless of actual infrastructure conditions; and of ideological effects on support for needed taxes, regardless of the proposed tax amount. Conservatives in our data were less likely to see problems, or to support any amount of tax increase, compared with moderates or liberals. Thus, even the physical condition of roads and bridges becomes a partisan-tinged issue.
Does this happen because ideology constrains actual perceptions, so that people do not see real problems? Or are the problems privately seen but not openly acknowledged? In either case, the effect supports a rationale for not raising taxes, which is the ideologically favored or identity-consistent goal. Our survey data cannot resolve the internal causality; both processes might be happening with different people, but they have essentially the same result. This effect weakens the impact of objective conditions on policy discussions, while adding to risks of policy paralysis based on cultural identity, or generalized political positions.
Focused efforts to inform the public about infrastructure conditions are needed to build support for action. But while information is necessary, our findings suggest that it will not be sufficient. A simple hypothesis termed the information deficit model, which like solution aversion has been most widely studied in connection with climate-change topics, holds that public opinion resists scientific perspectives because the public lacks good information, which could be supplied through better science communication (Suldovsky, 2017). An effective strategy supplies not just basic information, but also counterarguments against widespread misinformation (Cook et al. 2017; van der Linden et al., 2017). The information deficit model by itself does not account for active, identity-based resistance to new information. That phenomena finds explanation through processes such as solution aversion, and related information-filtering theories such as biased assimilation (McCright & Dunlap, 2011), motivated reasoning (Taber & Lodge, 2006), or cultural cognition (Kahan et al., 2011). Such theories converge on the insight that many people selectively acquire information according to prejudices tied to their sociopolitical identity. Regarding climate change, the information in question often starts with scientific reports, but can also extend to individual perceptions about local weather (Hamilton, Lemcke-Stampone, & Grimm, 2018). In the present article, we see evidence that similar filtering affects perceptions about the mundane reality of local road and bridge conditions. Rejection of identity-inconsistent information is a problem not easily solved, as the experimental literature on climate-change communication makes clear. Parallel studies of communication strategies for infrastructure investments could have value as well, given the challenges ahead.
Footnotes
Acknowledgements
The Granite State Poll is carried out by the Survey Center at the University of New Hampshire.
Declaration of Conflicting Interests
The author(s) declared no potential conflicts of interest with respect to the research, authorship, and/or publication of this article.
Funding
The author(s) disclosed receipt of the following financial support for the research, authorship, and/or publication of this article: The work was supported by grants from the U.S. National Science Foundation (grant numbers IIP-1230460, IIP-1430260). Conclusions in this article are those of the authors and do not necessarily represent the views of supporting organizations.