
Abstract
Recently, there has been an increase in the number of “unreported” cases in the Population Census of Japan caused by nonresponses to the survey. Subsequently, this has led to data reliability challenges. In light of this problem, the factors related to the low response rate of the 2015 Population Census in the central Tokyo area are examined in the present study. An online survey was conducted among individuals residing in the three Special Wards of Tokyo to inquire about their responses (submitted or not submitted) to the previous census. The statistical analyses demonstrated that particularly in central Tokyo, middle-aged (35–49 years) people and those who did not own a single-family residence were more likely to be nonrespondents, while most of the other characteristics were similar to the results reported in a previous nationwide study. However, further studies are required to fully understand the high rates of unreported cases in central Tokyo.
Introduction
Since 1920, the Population Census of Japan (administered approximately every 5 years) has provided basic statistics on the characteristics of Japan. This census is essential for comprehensive understandings of the historical changes and geographical variations of the residential characteristics of the country, such as family composition, housing, occupation, education, and mobility. The census is the only complete survey that targets the entire population residing in Japan. It is considered highly reliable and has, therefore, been utilized in many fields, including government policy development, market research, and academic studies. In geography and related disciplines, the data are particularly important because the census provides small area statistics that when combined with Geographic Information Systems (GIS) enable detailed spatial analyses.
In conducting the 2015 census, municipalities recruited about 700,000 census enumerators as a national total, who visited all households in each municipality to deliver user IDs and passwords to complete and submit the survey online. Households who did not submit the survey online by the deadline were also provided with paper questionnaires for submission directly to enumerators, to a municipal office, or via postal mail. In response to the rise of privacy awareness, submission by postal mail was introduced for the 2010 census, and online response began in the 2015 census (with the partial introduction in 2010). Each questionnaire required general household information (e.g., the number of members) and information on each person (e.g., age and occupation).
However, concerns have been raised about the increase in “unreported” cases in recent censuses (Abe, 2013; Koike & Yamauchi, 2014). Figure 1 illustrates the trends in the rate of unreported cases for certain variables. For example, the percentage of “place of residence 5 years ago not reported” was 8.8% in the 2015 census, and “education not reported” reached 13.1% in 2010 (education was not surveyed in 2015). The unreported cases are mainly caused by nonresponses to the entire survey (unit nonresponse) or individual questions (item nonresponse). Most significantly, since the 2000 census, the proportion of households that did not submit the census form by the deadline (i.e., unit nonresponse) has rapidly increased regardless of the installation of postal and online submission: 0.5% in 1995, 1.7% in 2000, 4.4% in 2005, 8.8% in 2010, and 13.1% in 2015. Local governments have tried complementing the missing information, mainly regarding basic items such as age and sex, by conducting follow-up surveys, by utilizing administrative information, and by interviewing neighbors. However, the rates of unreported cases have consistently increased since 2000, mainly for the items that cannot be complemented by the government, such as education.

Increasing trends in nonresponse rates are also common in many other social surveys and opinion polls. Since 2000, especially after enforcement of the Act on the Protection of Personal Information in 2005, statistical surveys in Japan have faced a difficult environment because people are increasingly conscious about their privacy, and attitudes of cautiousness in responding to surveys have increased (Inaba, 2007; Yasuda et al., 2008). It has also become harder to contact individuals because of household members’ working hours and an increase in secured buildings that may not allow for easy access by survey-takers (Hanibuchi & Muranaka, 2018; Tsuruta, 2008).
The increase in unreported cases creates problems regarding the reliability of the statistics because it may introduce systematic bias in the census data. For example, if unemployed people are more likely to not respond to the census survey, the unemployment rate will be underestimated. To address this issue, it is essential to understand the patterns and degree of possible biases. In other words, researchers must verify which people did not respond to the census and their reasons for not responding.
Recent studies on the completion of census forms in Japan have estimated that unreported cases were more likely to come from people who are young (Yamada, 2011, 2012, 2016), have never married (Unayama, 2013), lower educated (Sano et al., 2015), and live in one-person households (SBJ, 2017). Although these studies indirectly compared aggregated census data and other government statistics, Hanibuchi and Yamauchi (2019) conducted a nationwide online survey that investigated the responses to the 2015 Population Census and then analyzed the individual-level data to examine the nonresponse associations directly with many different variables simultaneously. They revealed that age was the fundamental factor related to nonresponse and that this was accompanied by increased nonresponses among individuals who have never married, one-person households, and short-term residents. They also reported that the degree of understanding the census was negatively associated with nonresponse regardless of age, while privacy-consciousness was (unexpectedly) not related to nonresponse.
Importantly, previous studies have reported that unreported cases tend to be more prevalent in urban areas (Hanibuchi et al., 2018; Koike & Yamauchi, 2014). As illustrated in Figure 2, using the percentage of “place of residence 5 years ago not reported” as an example, central Tokyo areas exhibited extremely high unreported rates. The rate for the 23 Special Wards (municipalities) of Tokyo was 28.5%, three times higher than the national rate (8.8%). In Minato-ku, one of the three target wards in this study, the percentage reached 47.8%, meaning that almost half of the residents did not respond either to that survey question or to the entire survey. In contrast, approximately 40% of the municipalities (757 of the 1,896 cities, wards, towns, and villages) had an unreported rate of less than 1%, and most of these were towns and villages in rural areas.

Geographical pattern of the percentages of “place of residence 5 years ago not reported” in the Tokyo metropolitan region (SBJ, 2015).
This regional variation in nonresponse rates, in combination with other response biases, could yield “spurious” regional differences and create misinterpretations in the “true” geographical patterns and correlations (Hanibuchi & Muranaka, 2018). This has become a serious issue in terms of using the census data for regional analyses. Although this urban–rural difference was partially explained by individual factors such as age (i.e., younger people tend to be nonrespondents and tend to live in urban areas, resulting in higher nonresponse rates in urban areas), contextual factors remained even after controlling for many demographic and socioeconomic factors as well as attitudes toward the census (Hanibuchi & Yamauchi, 2019). In other words, there may be specific factors related to the high nonresponse rate in urban areas. However, no studies to date have examined these factors by focusing on highly urbanized metropolitan areas.
In the present study, the factors related to low response rates to the 2015 Population Census in central Tokyo are examined. Central Tokyo was selected as the target of this study because it is one of the most highly urbanized areas in Japan and has the highest level of unreported rates, as shown in Figure 2. The results of studies focusing on such “advanced” areas could be key to finding factors of and solutions to the increasing census nonresponse rates. Specifically, the present researchers explored whether the factors extracted from Hanibuchi and Yamauchi’s (2019) nationwide study apply to central Tokyo or whether there are unique specific reasons why the area has low response rates. The findings of the present study may be crucial for both researchers and policymakers in interpreting existing census data and improving the quality of future censuses. This study can also contribute to the body of the literature by providing a Japanese context to the international debate on the census undercount/underenumeration (Martin, 2010; O’Hare, 2016).
Method
Data
The data were collected via an online survey conducted between January 28, 2019, and February 5, 2019, and administered by INTAGE Inc. An invitation was sent to all registered INTAGE members 20 years or older living in the three Special Wards of central Tokyo (Bunkyo-ku, Minato-ku, and Chiyoda-ku). These wards were chosen because they are all located in central Tokyo and cover a variety of residential neighborhood types (e.g., from historical and hilly residential areas to high rise condominiums in bay areas). In total, 10,084 people were invited to participate in the online survey, and 2,187 respondents completed the questionnaire within 48 hr of the invitation (response rate = 21.7%). Respondents received a small financial compensation upon completion of the survey (about ¥70 = US$0.8). Following Hanibuchi and Yamauchi (2019), the method was employed because it was considered an effective and efficient way to collect a large amount of individual-level data on the response status of the census as well as a large number of attributes and attitudinal variables. However, the present researchers acknowledge that the registered members were not a representative sample of the residents and that our survey also had a low response rate. Subsequently, the results must be carefully interpreted as they are not generalizable to the entire population.
Although information from respondents who stated that they were unaware of the Population Census (n = 98) is likely significant to the low response rate, such respondents were excluded for two reasons. First, it was not certain if they were real members of the nonresponding class because their family members could have responded to the census without informing them. Second, such respondents did not answer questions regarding attitudes toward the census. Samples that did not include data on education levels (n = 24) were also excluded. Subsequently, the final sample comprised of 2,065 responses.
Variables
The survey inquired whether the participants responded to the 2015 Population Census and about their demographics, socioeconomic status, and attitudes toward the census. To highlight the features of central Tokyo by comparing them with the results of the nationwide survey, the items included in the survey questionnaire and the variables used in the analysis were mostly the same as those used by Hanibuchi and Yamauchi (2019).
The outcome was a dummy variable for the response status in the 2015 Population Census (nonresponse = 1). The survey inquired about the response to the entire survey and asked whether they (or their family members) had submitted the census form. As illustrated in Figure 1, the percentages of unreported cases differed according to the items in the survey, suggesting that the respondents often submitted the questionnaire but left some questions unanswered. Nevertheless, the present researchers did not examine nonresponses to individual questions but focused on nonresponses to the entire survey (i.e., responses to all questions are missing) because the latter has a broader impact and was easier for the respondents to answer than the former.
The following were used as independent variables for demographic and socioeconomic status: age (20–34 years, 35–49 years, 50–64 years, and 65 years or above), gender (men and women), marital status (married, never married, and divorced or widowed), education level (low: junior high school/high school [12 years or less of education], middle: junior [technical] college/vocational school [13–15 years], and high: university/graduate school [16 years or more]), annual household income (less than 3 million Yen, 3–5 million Yen, 5–7 million Yen, 7–9 million Yen, 9 million Yen or more, and unknown), occupation (white-collar job, gray-collar job, blue-collar job, others, and not working [including retired, unemployed, students, and homemakers]), household composition (household with two or more and single-person household), housing types (own a single-family residence, own a multi-family residence, rent a multi-family residence, and others), and years of residence (20 years or more, 10–19 years, 5–9 years, 1–4 years, and less than 1 year).
Researchers in the present study also used privacy-consciousness, opinion of the census, and understanding of the census as attitudinal variables. The privacy-consciousness score was defined as the number of personal information items, such as birthday, education, income, phone number, medical history, and residential address that the respondents feel (“feel” or “somewhat feel”) resistant to provide. A positive opinion score was determined by the number of times the respondents agreed (“agree” or “somewhat agree”) with the following five opinions: (a) The census is beneficial to the country and society, (b) enumerators are not trustworthy (reverse coded), (c) it is burdensome to answer (reverse coded), (d) there is a concern about privacy (reverse coded), and (e) the census should be continued. In addition, the level of the respondents’ understanding of the census was scored by how many facts the respondents already knew about the census using the following six items: “it is conducted by the government,” “all people who usually live in Japan are surveyed,” “it is conducted every 5 years,” “the response is required by law,” “the results are used to calculate the number of Diet member seats and tax allocations to local governments,” and “the survey results and tabulated data are available online.” These scores showed good to acceptable levels of reliability (Cronbach’s alphas were .79 for the privacy-consciousness score, .66 for the positive opinion score, and .74 for the understanding level score).
Statistical Analysis
The data were tabulated to establish respondents’ characteristics and the percentage of nonresponses according to each independent variable. Then, a logistic regression analysis was performed using nonresponse to the census as the dependent variable and demographics, socioeconomic status, and attitudinal variables as the independent variables. Both crude odds ratios (ORs) and adjusted ORs were estimated to assess bivariate and independent associations between the dependent and independent variables. The variables of the Special Wards (Bunkyo-ku, Minato-ku, and Chiyoda-ku) were also included to adjust for regional differences in the process of enumeration because each municipality is in charge of its own enumeration (e.g., the recruitment and instruction of enumerators).
It is important to note that while the survey inquired about the respondents’ individual attributes and attitudes, in addition to their household attributes, census forms are distributed to and collected from households rather than individuals. This means that some respondents may not have been solely responsible for deciding whether to submit the census forms. Therefore, some variables of individual attributes and attitudes should be interpreted carefully as the respondents are not necessarily directly associated with the decision-making. For example, if a high nonresponse rate among the younger generation was observed, it does not necessarily mean that they as individuals tend to refuse. It does mean that the households to which this generation belongs display such trends, and that, as a result, data on members of this generation tend to be incomplete or missing from the census results.
Results
Table 1 illustrates the basic characteristics of the respondents and the nonresponse rates of the 2015 Population Census by the attributes and attitudinal variables. The survey respondents were more likely to be middle-aged, highly educated, and less likely to own a single-family residence. These may reflect the demographic and socioeconomic characteristics of the study area and the panel members of the online survey. In total, 13.9% of the respondents answered that they did not submit their 2015 Population Census form. For those 20 to 64 years old (i.e., excluding those 65 years or older for comparison), the value was 15.4%, which is approximately 1.7 times higher than the rate for the nationwide online survey (9.2%) conducted by Hanibuchi and Yamauchi (2019). The nonresponse rates differed greatly according to the respondents’ attributes and attitudes: taking age, for example, the values ranged from 3.2% for those aged 65 or older to 20.9% for those aged 35 to 49 years.
Basic Characteristics of the Respondents and the Percentages of Nonresponse for the 2015 Population Census of Japan (n = 2,065).
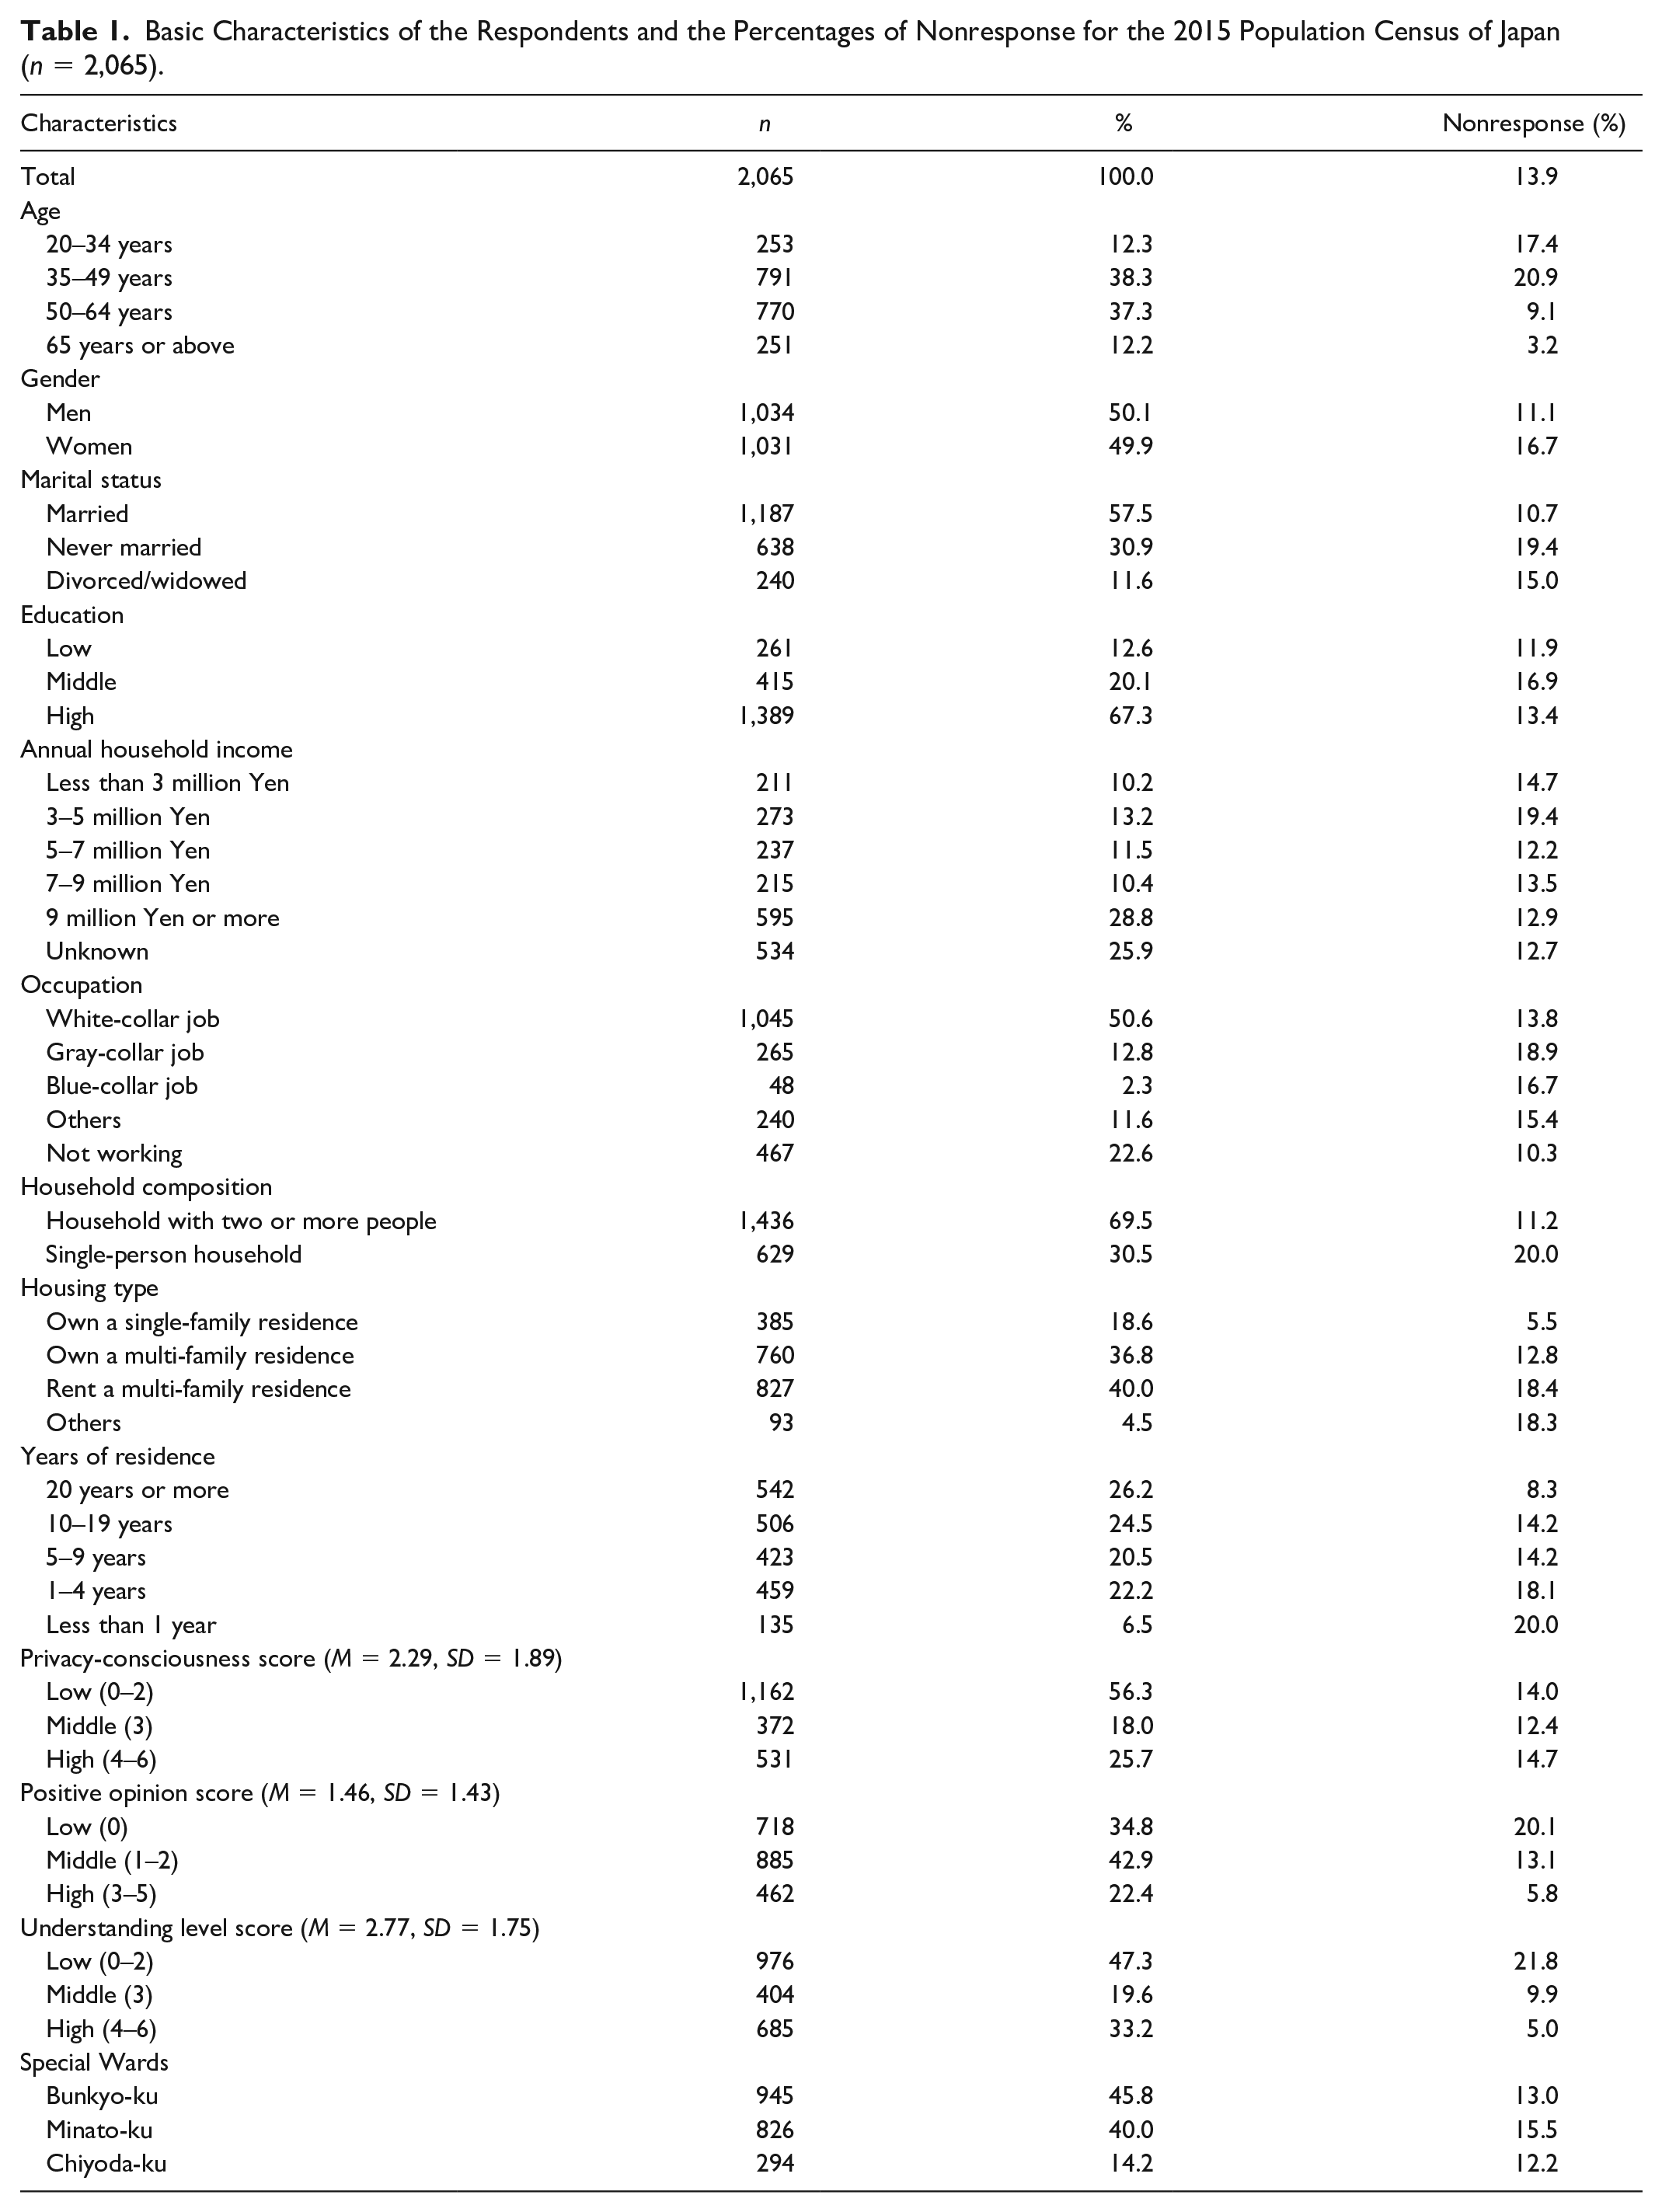
Table 2 presents the estimated ORs and 95% confidence intervals (CIs) for the nonrespondents. When looking at the results of the bivariate logistic regression (crude ORs), most of the independent variables, except for annual household income, Special Wards, and privacy-consciousness, showed significant or marginally significant associations with the dependent variable. Those 50 to 64 years (OR: 0.48, 95% CI: [0.32, 0.71]) and 65 years and older (OR: 0.16, 95% CI: [0.07, 0.34]) were less likely to be nonrespondents of the census than 20- to 34-year-olds. Women (OR: 1.60, 95% CI: [1.24, 2.06]), those who had never married (OR: 2.01, 95% CI: [1.54, 2.63]), individuals with gray-collar jobs (OR: 1.46, 95% CI: [1.02, 2.07]), single households (OR: 1.98, 95% CI: [1.54, 2.56]), those who did not own a single-family residence (ORs ranged 2.54–3.90), and individuals with shorter periods of residence (ORs ranged 1.83–2.76) also tended to be nonrespondents. Regarding education, the middle level of education had an OR of 1.51 (95% CI: [0.96, 2.37]) with marginal significance. Significant associations were also seen for the two attitudinal variables: positive opinion score (OR: 0.68, 95% CI: [0.61, 0.76]) and understanding level score (OR: 0.65, 95% CI: [0.60, 0.71]).
ORs and 95% CIs for Nonresponse to the 2015 Population Census Estimated by Logistic Regression Analysis.

Note. OR = odds ratio; CI = confidence interval.
***p < 0.001, **p < 0.01, *p < 0.05, +p < 0.1.
The multivariate logistic regression analysis (adjusted ORs) yielded somewhat contrasting results, and only a few independent variables remained statistically significant. Age, housing types, positive opinion score, and understanding level score were significantly associated with nonresponse to the 2015 Population Census, even after adjusting for the other independent variables. Associations with the other independent variables, including gender, marital status, education, occupation, household composition, and years of residence, were attenuated and lost their significance. In the multivariate model, those aged 35 to 49 years had an OR of more than 1 with marginal significance (OR: 1.46, 95% CI: [0.96, 2.22]), meaning that individuals from this age group were more likely to be nonrespondents than individuals from the younger age group (20–34 years).
Discussion
Findings of This Study
Central Tokyo reportedly has a very high percentage of unreported cases, but little is known about possible explanations for the phenomenon. Using online survey data targeting central Tokyo, the present study examined the factors associated with nonresponse to the 2015 Population Census of Japan. In this section, the present researchers discuss the characteristics of central Tokyo obtained from the statistical analysis and compare these with the results from a previous nationwide online survey (Hanibuchi & Yamauchi, 2019). Although these are not strictly comparable due to the differences in survey methods (e.g., survey company and sampling design [quota sampling vs. complete survey for registered panel members]), the comparison may nonetheless highlight some factors that are unique to central Tokyo.
The results of the tabulation and crude ORs demonstrated large differences in the nonresponse rates according to the respondents’ demographic and socioeconomic status. The younger age group, women, those who had never married, gray-collar workers, single-person households, those who do not own a single-family residence, and individuals with shorter periods of residence were more likely to have not submitted their census forms. These results are largely in line with previous studies on unreported cases in the census (Hanibuchi & Yamauchi, 2019; SBJ, 2017; Unayama, 2013; Yamada, 2011, 2012, 2016) To put it another way, the census’s unreported cases are not evenly distributed, but they are highly biased. Therefore, researchers and other users must use the recent census data carefully, especially when targeting regions with high unreported rates such as central Tokyo.
Many of these associations were attenuated and became insignificant in the multivariate model that simultaneously adjusted all of the independent variables. Among the respondents’ attributes, age retained a statistically significant association with nonresponse. This is similar to Hanibuchi and Yamauchi’s (2019) results, which demonstrated that age was the fundamental factor related to nonresponse, although differences exist when the data are explored in more detail (discussed below). In addition to age, positive opinion scores and understanding level scores were strongly and negatively related to nonresponse in both the unadjusted and adjusted models. This means that people who understand the census and have an affirmative opinion on the census tend to respond, suggesting the importance of statistics education in school and the dissemination of the census’s role in academic research and policy-making (Hatakeyama, 2009).
Differences From the Nationwide Survey
Most of the results mentioned above are similar to those from the nationwide survey conducted by Hanibuchi and Yamauchi (2019), but some differences should be noted. First, although the older age groups demonstrated lower nonresponse rates in both surveys, the trends were somewhat different (Figure 3). The nonresponse rates were very high among the respondents aged 20–34 years in both surveys. However, large differences were observed for the respondents aged 35–49 years. The nonresponse rate for this group was 7.8%, and while this is less than half of the rate for the 20–34 years old group (20.6%) in the nationwide survey, this reduction was not evident in the survey in central Tokyo. Rather, the rate was even higher among the older group as it was shown to have a marginally significant difference in the multivariate analysis. Relatively higher nonresponse rates in the survey in central Tokyo were also apparent among respondents aged 50–64 years. These high nonresponse rates, as well as the large population share of the middle-aged groups, may partially explain central Tokyo’s low response rate.
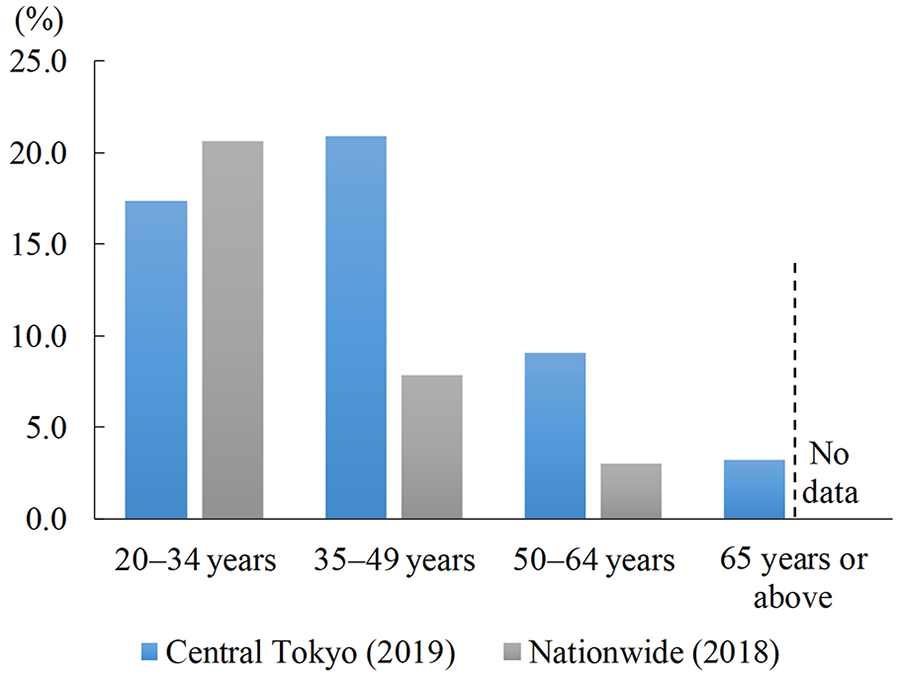
Comparison of nonresponse rates by age groups between the two surveys (Hanibuchi & Yamauchi, 2019).
Some contrasting results between the two surveys are also noteworthy. In the present study, having a middle level of education and having gray-collar jobs were both positively associated with nonresponse (i.e., they tended not to submit), although the associations lost statistical significance in the multivariate model. By contrast, in the nationwide survey, these variables were reported to have a negative association to nonresponse with significance or marginal significance (Hanibuchi & Yamauchi, 2019). Although not conclusive, those with a middle level of education and gray-collar workers living in central Tokyo might have distinctive characteristics compared with those in other regions. For example, their working environment (e.g., fixed and long working hours) might prevent them from being able to submit the census form to an enumerator.
Another difference between the two surveys was regarding housing types. In both surveys, single-family residence owners had the lowest nonresponse rates. However, in the multivariate model, the association remained significant only in the survey in central Tokyo, and the ORs were more than 2 for all categories (i.e., owning a multi-family residence, renting a multi-family residence, and others). Although the reasons for this were not clear, this might reflect difficult survey environments for multi-family residences in central Tokyo (e.g., high-level security including self-locking). In addition, single-family residence owners were more than half (53.3%) of the total respondents in the nationwide survey but less than one fifth (18.6%) of the present researchers’ survey in central Tokyo. Roughly speaking, most residents in central Tokyo did not own a single-family residence, and those who did not were less likely to submit the census forms. This may have also contributed to the low response rate in central Tokyo.
Limitations
Several limitations should be mentioned. First, as the respondents of the online survey did not comprise a representative sample, the results must be carefully interpreted as they are not generalizable to the entire population. Nevertheless, when compared with previous studies that compared aggregate census data with other government statistics (Sano et al., 2015; SBJ, 2017; Unayama, 2013; Yamada, 2011, 2012, 2016), using original survey data has advantages. For example, individual-level data allow multivariate analyses to detect independent associations between census nonresponse and a variety of attribute and attitudinal variables. Second, although the present study compared the results of the current study targeting central Tokyo with a previously conducted nationwide survey, the sample size and survey methods were not sufficient for a more detailed comparison. Further studies are required to determine the unique factors for central Tokyo’s low response rate by conducting a large-scale survey or analyzing pooled data. Third, there was a gap of approximately 3.3 years between the 2015 census and the online survey, which could introduce recall bias. Fourth, as illustrated in Figures 1 and 2, large differences in the unreported rates were apparent among the variables and regions, indicating that nonresponse to individual questions (item nonresponse) was also prevalent in central Tokyo. Further studies are necessary to examine the factors related to item nonresponses. Fifth, in the present study, the respondents who were unaware of the census had to be excluded because it was uncertain if their family members responded to the census without their knowledge. Although they seemed to display some similar trends (e.g., they tend to be young, women, unmarried, and have gray-collar jobs), a detailed analysis focusing on this population must still be conducted before firm conclusions can be drawn. Finally, previous studies have indicated that neighborhood environment, including social relationships with neighbors, might affect response behavior (Matsuoka & Maeda, 2015). This could be important for the Population Census because census enumerators are often assigned their own neighborhoods as their enumeration districts, and responses could be affected by their relationships with their neighbors (Sato, 2015). The role of enumerators and local governments in creating regional differences in unreported cases is also worthy of further research.
Conclusion
This study sought to examine factors related to the low response rates to the 2015 Population Census in central Tokyo. An online survey was conducted to determine the rate at which residents in central Tokyo submitted or did not submit their census forms. The statistical analyses demonstrated that demographic and socioeconomic status were associated with the likelihood of nonresponse. Although most of the associations found in this study were similar to the results reported by a previous nationwide study, higher nonresponse rates among the middle-aged population and those who did not own a single-family residence were considered the most distinctive characteristics found among the residents of central Tokyo. Although further studies are necessary, by providing initial findings regarding possible biases included in the census data, this study may assist researchers and policymakers with developing the future improvements necessary for the implementation of the census and raising of response rates.
Footnotes
Declaration of Conflicting Interests
The author(s) declared no potential conflicts of interest with respect to the research, authorship, and/or publication of this article.
Funding
The author(s) disclosed receipt of the following financial support for the research, authorship, and/or publication of this article: This work was supported by JSPS KAKENHI (Grant Numbers JP18KK0371 and JP17H00947).
Ethical Approval
Ethics approval was obtained from the Research Ethics Committee of Chukyo University (2018-041).